I will say up front, I am not a Wall Street cast off who can calculate the P/E of the S&P 500, nor can I tell you if each and every company in the index is presently valued as it should be. But what I can do, is enough technical analysis to find various times throughout this massive run up doesn't make a lot of sense, and at times seems beyond reason. So this little exercise it to prove to myself if my theories are correct, or I am just another market junkie who has been fooled by the market. At the same time, I may find enough proof to allow others to share my theory and therefore pass along our conclusions so others can be aware of the pitfalls, as well as a little piece of mind on why they lost their money. So here goes.
Below is a yearly chart of the S&P 500 for the entire year of 2009. What I will attempt to prove is some key dates, chart patterns, and events that changed the direction, sentiment, and ultimately, manipulations that affected the market. As you can see the S&P bottomed out on March 6th at 666.79 (intraday)and a high of 1130.38 (intraday)on December 28th - Merry Christmas huh? I used intraday values because they represent the highest and lowest level of the numbers. If you want to just the open/close numbers, they are as well accurate and very close. I did this because my charts(I'm using my trading account charting package where the support/resistance, trendlines, and notes have been updated as the year progressed)need little or no extra work. Using this, and my not so great memory, I think I will find certain events, on specific days, that will show manipulation, and will also coincide with particular chart patterns (using common technical indicators) that prove my theory. (click on images for larger view)

As you can see, the S&P formed a "doji" on March 6th, which in the world of TA (technical analysis from this point forward) sometimes signals a directional change; in other words, a reversal. From my research, a doji in this larger pattern will signal a reversal 52% of the time. That's like flipping a coin, but in this case it in fact signaled a change in direction - and as it turned out, a big one. A recap of the chaos on March 6th us summed up pretty good by Zach's Investment Research in this article, and a good refresher. I won't go into it since this is not the intent of this article.
It is also of note, March 6th was a Friday, and the monthly employment report came out that morning at 8:30. It was not good, as reported by the WSJ, who stated; The number of employed non-farm workers fell 651,000 in February. That followed declines of 655,000 in January and 681,000 in December. The market sold off hard on Thursday before this report, which makes one wonder if someone knew something. Friday's action formed the doji, and maybe everyone just wanted to get to the weekend. It was scary times in the market for sure.
I don't find anything of note for the weekend, but Monday the market didn't show us much. It lost ground again, but didn't break the intraday lows from Friday and formed another doji, although a sloppy one. Which brings us to...
Tuesday, March 10, 2009 - and the beginning of the rocket shot upward.
At this point anything can happen. We are still looking at financial Armageddon, and the market knows it. But then (drum roll please) the Vikram Pandit memo obtained by Bloomberg which you can read here, but it said - Citigroup Inc. Chief Executive Officer Vikram Pandit said his bank is having the best quarter since 2007, when it last posted a profit. The shares rose 38 percent and helped spur gains for finance company stocks.
“I am most encouraged with the strength of our business so far in 2009,” Pandit wrote in an internal memorandum obtained today by Bloomberg. “We are profitable through the first two months of 2009 and are having our best quarter-to-date performance since the third quarter of 2007.”
What happened? Wow, would be the correct answer;
Dow... 6,926.49 +379.44 (+5.80%)
Nasdaq... 1,358.28 +89.64 (+7.07%)
S&P 500... 719.60 +43.07 (+6.37%)
Gold future... 895.90 -22.10 (-2.41%)
30-Year Bond 3.71% +0.11 (+3.17%)
10-Yr Bond... 2.98% +0.10 (+3.33%)
But there is a little more to this. On this day as well, Barney Frank, head of the Financial Services committee was reported to have said the uptick rule would be imposed within a month, as reported by Reuters. But that's not all, and interestingly enough, the Citi/Pandit news, the memo, according to the link above, was meant for their employees. So if this memo was for internal consumption, how did Bloomberg get it???
You can do your own research on this, but if you send out a memo to your employees and figure it will not get to the public, especially one as important as this (if in fact true..er...scratch that) you are pretty naive in this blogger's opinion. Color me skeptical, and mark this one up as possible manipulation. I'll leave it at that.
Full disclosure: I had forgotten about this until I started researching for this article. I do think its pretty clear this rally had started with an internal memo from Vikram Pandit, with a little help from their friend Barney Frank and the uptick rule. And let's not forget the call of all calls; on March 3rd by President Obama said "It's a good time to buy stocks."
We are off to the races.
Thursday/Friday, March 12 -13, 2009
Dow... 7,170.06 +239.66 (+3.34%)
Nasdaq... 1,426.10 +54.46 (+3.97%)
S&P 500... 750.74 +29.38 (+4.07%)
Gold future... 923.80 +13.10 (+1.42%)
30-Year Bond 3.64% -0.02 (-0.60%)
10-Yr Bond... 2.89% -0.02 (-0.82%)
These are Thursday's numbers, but on Friday morning Reuters reported the following in a recap article;
Banking and insurance stocks led the rally, after U.S. lender Citigroup (C.N)said the bank does not need any more emergency cash from the government and expects to stay private, while rival Bank of America (BAC.N) said it was profitable in January and February, calming worries over the faith of the two stricken banks and the financial system in general.
Not sure why they said Citi staying private, but the point remains; more gas for the market and we all know how profitable those two have been.
Wednesday,March 18, 2009
Of note, from the FOMC notes;
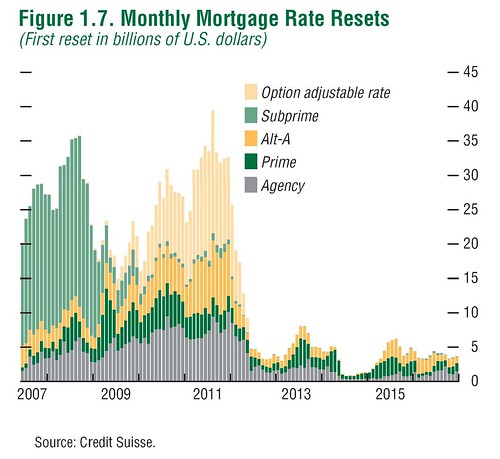
To provide greater support to mortgage lending and housing markets, the Committee decided today to increase the size of the Federal Reserve’s balance sheet further by purchasing up to an additional $750 billion of agency mortgage-backed securities, bringing its total purchases of these securities to up to $1.25 trillion this year, and to increase its purchases of agency debt this year by up to $100 billion to a total of up to $200 billion. Moreover, to help improve conditions in private credit markets, the Committee decided to purchase up to $300 billion of longer-term Treasury securities over the next six months. The Federal Reserve has launched the Term Asset-Backed Securities Loan Facility to facilitate the extension of credit to households and small businesses and anticipates that the range of eligible collateral for this facility is likely to be expanded to include other financial assets.
Monday, March 23, 2009
The market sold off on Thursday and Friday of the previous week, but as reported by CNN; Stocks surged Monday, recharging the rally, after Treasury's plan to buy up billions in bad bank assets and a better-than-expected existing home sales report raised hopes that the economy is stabilizing. as well as; The Treasury Department unveiled its long-awaited plan to remove many of the troubled assets from banks' books Monday, representing one of the biggest efforts by the U.S. government so far aimed at tackling the ongoing financial crisis.
Under the new so-called "Public-Private Investment Program," taxpayer funds will be used to seed partnerships with private investors that will buy up toxic assets backed by mortgages and other loans.
The goal is to buy up at least $500 billion of existing assets and loans, such as subprime mortgages that are now in danger of default. Which resulted in;
Dow... 7,775.86 +497.48 (+6.40%)
Nasdaq... 1,555.77 +98.50 (+6.76%)
S&P 500... 822.92 +54.38 (+7.08%)
Gold future... 952.50 -3.70 (-0.39%)
30-Year Bond 3.69% +0.04 (+1.07%)
10-Yr Bond... 2.66% +0.04 (+1.33%)
The market moved up until a large sell of on March 30th, a Monday, possibly because of the General Motors bankruptcy plans released by the government. I can't find what I consider solid data for the sell off that day,other than the GM news, but the indexes were down 3 to 3 1/2 percent, or 250 on the DOW and 28 on the S&P. On May 1st the market began to rally again, even on bad news, including a horrible employment number on Friday the 3rd. Alcoa sent the market lower on Tuesday, April 7th with a worse than expected earnings report, kicking off the earnings season.
Thursday, April 9th, 2009
Wells Fargo is the hero this time. From a MarketWatch report; Wells Fargo & Co. said Thursday that first-quarter earnings would surge to a record $3 billion, well ahead of analyst forecasts, as loan losses and loss provisions dropped from the difficult previous quarter and its mortgage business thrived.
Wells shares jumped 26% as the bank also said its Wachovia acquisition was exceeding expectations and reported another quarter of double-digit revenue growth.
"They didn't just beat estimates, they blew them out of the water," said Stuart Plesser, a financial-services analyst at Standard & Poor's Equity Research.
Which resulted in the following:
Dow... 8,083.38 +246.27 (+3.05%)
Nasdaq... 1,652.54 +61.88 (+3.89%)
S&P 500... 856.56 +31.40 (+3.81%)
Gold future... 883.30 -2.60 (-0.29%)
30-Year Bond 3.76% +0.10 (+2.65%)
10-Yr Bond... 2.93% +0.08 (+2.77%)
The earnings by Wells sent the market higher until April 17th, a Friday, with only one down day, the 14th. At this point (see chart below) the rally had came back to the 875 level, which many considered a support/resistance point. Since the beginning of this rally, the sentiment was still very bearish because the economic indicators, especially jobs, were still bad. Not to mention the banks were still in trouble and everyone knew it. Reading throughout the investment/trading sites, the general belief was to go short. Ha! Hell, we haven't even got started yet. (click on link for larger picture)

Sitting at a critical technical level, and knowing Monday would bring the earnings reports from Bank of America, many traders shorted the market on Friday. They had a happy Monday as the market responded as they had hoped, even though BAC's earning were not that bad.
Dow... 7,841.73 -289.60 (-3.69%)
Nasdaq... 1,608.21 -64.86 (-3.88%)
S&P 500... 832.39 -37.21 (-4.28%)
Gold future... 887.50 +19.60 (+2.21%)
30-Year Bond 3.69% -0.10 (-2.59%)
10-Yr Bond... 2.84% -0.09 (-2.97%)
Opps! Still a bit of volatility it seems. Zacks summed the day up nicely; The dramatic fall that markets witnessed Monday reignited fears that the recent run was nothing but a mere bear market rally. Financials once again bore the brunt, declining 10.6%. On the DJIA, financial components Bank of America (NYSE:BAC - Analyst Report) dropped 24.3%, Citigroup (NYSE:C - Analyst Report) fell 19.5%, American Express (NYSE:AXP - Analyst Report) declined 13.0% and JP Morgan (NYSE:JPM - Analyst Report) was off 10.7%. Bank of America (NYSE:BAC - Analyst Report) CEO Lewis added to concerns, warning of "challenges primarily from deteriorating credit quality driven by weakness in the economy and growing unemployment."
Larry Summers' comments on administration intentions to rein-in credit card abuses drew fire, as traders increasingly grew wary of Obama's intentions. Media reports suggesting the government may convert its interest in rescued banks from preferreds to common equity brought with it fears of nationalization and shareholder dilution. And another report that circulated yesterday said 16 of the 19 banks facing stress tests are "technically insolvent," a charge later denied by the Treasury.
Tuesday, April 21, 2009
The large down day on Monday spooked many in the market, but Tuesday brought Tim Geithner in front of congress. I can't find anything significant, but Geither must have said something, or an earnings report helped juice the market. Geithner's testimony was summed up by the NYT in this article. I can't find an intraday chart so I can't tell how the day unfolded. The indexes rallied just the same as the DOW recorded a triple digit gain and the S&P adding 17 keeping the rally intact after the large sell off on Monday.
The market was up and down until April 28, where it formed another doji at the 855 level, still below the 875 resistance. We had heard during the period from the likes of Nouriel Roubini and Merideth Whitney, two market moving economists/analysts both citing the continued doom we are facing in the economy and markets.Over the weekend of 25/26 we became aware of potential problems with the swine flu problem. This may have spooked the markets on Monday and Tuesday, both down days. We also learned of an investigation into Joe Cassano, the AIGFP head accused of blowing up the world. Well, maybe not that bad, but a CBS article had this to say; Sources say investigators are digging into whether Joseph Cassano, the former head of London-based AIG Financial Products, and two of his top deputies - Andrew Forster, an executive vice president, and Thomas Athan, a managing director - committed securities fraud and other federal crimes, reports CBS News chief investigative correspondent Armen Keteyian.Haven't heard much about that lately have we.
Wednesday, April 29, 2009
After closing at 855 on Tuesday, the market gapped up on Wednesday after a not so good GDP report and rallied nicely throughout the day. Zacks summed up the session as follows; In a marketplace given to looking forward six months or so, investors did not have enough reason to rejoice as the latest growth data showed GDP fell at an annual rate of 6.1% from January through March. Nevertheless, investors looking for reassuring signs did find consumer data somewhat comfortable. And U.S. Federal Reserve’s observation that the rate of economic contraction was “somewhat slower” was an added relief. Markets shrugged off reports suggesting Chrysler’s imminent bankruptcy and media reports that at least one-third of the stress-test banks may require additional capital. At the end of the day, the DJIA closed up 2.1% to its highest since February 9, the tech-heavy NASDAQ was up 2.3% to its highest since November 4, and the S&P up 2.2% to its highest since January 28.
The S&P tested the 875 level on Wednesday, even poking it's head above the key level of 875 but closed at 873.64, mere points below the critical level. Thursday the 31st, and Friday, May 1st were flat with Thursday down a little but Friday an up day, finally finishing above the key 875 level at 877.52 keeping the suspense going though the weekend. A tough spot of both Bulls and Bears. For traders and technicians who follow TA, finishing above a critical support/resistance signals which strategy to play - long or short. Let's expand on that a bit.
Using TA to play the market, technical levals are critical to which way you place your bets, if we may call them that. As many on TV talk about, as well as looking at the charts, the 875 level is a large support/resistance area. This level also coincides with another tool technicians use when predicting the markets and their direction - Fibonacci analysis, sometimes called Fibonacci retracements. For an in-depth explanation of Fib (to be called from this point forward) see this article as a starting point. Or use Google and you will find enough information to keep you busy for weeks.
As we can see from the chart below, the S&P is at or close to both the 875 S/R (support/resistance) level as well as just below the 881.38 Fib level of 23.6. These values are based on the S&P high of 1576.09 of October 11, 2007 and the 666.79 of March 6, 2009. Many technicians and Elliot Wave followers use these tools to predict direction and timing. As we can see, the S&P on May 1st is just above the S/R but a tad below the 881.38 Fib retracement. As we can see from a closer look at the charts, this Fib level has been tested, or very close by daily candles on Jan 13 (877.02), Jan 28 (877.86), April 29 (882.06) as well as breached on May 30 and April 1st.
The difference in these two levels are slight, and depending on how you set up your S/R levels or rather you use intraday candle wicks or open/close values, there is a definitive range of S/R in this area, and critical to analyzing the market direction. At this point we have a stalemate between Bulls and Bears on which direction to take, but this area is significant and important. See charts below for details.
Setup of S&P high/low Fib retracement.


Monday, May 4, 2009
Before we move on, we must not forget what hit the news on or about April 30th from Dick Durbin, the Senator from Illinois, as reported everywhere except the main stream media, had this to say; Sen. Dick Durbin, on a local Chicago radio station this week, blurted out an obvious truth about Congress that, despite being blindingly obvious, is rarely spoken: "And the banks -- hard to believe in a time when we're facing a banking crisis that many of the banks created -- are still the most powerful lobby on Capitol Hill. And they frankly own the place."
From the same article, and found easily on the web using Google, you will also find these little gems of news (that is if you don't use the MSM (main stream media from this point forward);

Goldman Sachs' new top lobbyist was recently the top staffer to Rep. Barney Frank, D-Mass., on the House Financial Services Committee chaired by Frank. Michael Paese, a registered lobbyist for the Securities Industries and Financial Markets Association since he left Frank's committee in September, will join Goldman as director of government affairs, a role held last year by former Tom Daschle intimate, Mark Patterson, now the chief of staff at the Treasury Department. This is not Paese's first swing through the Wall Street-Congress revolving door: he previously worked at JP Morgan and Mercantile Bankshares, and in between served as senior minority counsel at the Financial Services Committee.And this article from the New York Times,Geithner, Member and Overseer of Finance Club, a worthwhile read. Which contains the graphic on the left to help illustrate the connections. (click on graphic for larger image)
Back to the market. Over the weekend of May 2/3 we heard about the concerns over credit, the upcoming release of the stress tests, the ongoing housing crisis, and what might move the market in the coming week(s). Again, Zacks sums it up pretty well in this article which touches on many facets of the market, as well as this which I find a bit strange; U.S. stock futures suggested a higher opening at the Wall Street. Dow futures were up 49 points, or 0.6%, to 8,230, while the broader Standard & Poor's 500 futures rose 5.50 points, or 0.6%, to 881.60 which makes me assume the article was released before the market was open. I don't remember this weekend news very well but I do remember the anticipation of the stress tests might come out this week. Yet, as cited by Zacks the market gapped up in the morning and charged higher all day. This also verified the breech of the 875/Fib levels and any battle between Bulls and Bears is now settled - the Bears got their butts handed to them in fine fashion.
Monday's results;
Dow... 8,426.74 +214.33 (+2.54%)
Nasdaq... 1,763.56 +44.36 (+2.58%)
S&P 500... 907.24 +29.72 (+3.39%)
Gold future... 902.20 +14.00 (+1.55%)
30-Year Bond 4.07% -0.02 (-0.56%)
10-Yr Bond... 3.16% -0.02 (-0.54%)
Wow! Even more curious considering this report by MarketWatch which states the following; Standard & Poor's Ratings Services on Monday placed 23 U.S. large financial institutions, including Bank of America, Citibank and Wells Fargo, on CreditWatch with negative implication. "These rating actions identify companies that we believe have at least a one-in-two likelihood of a one-notch or multiple-rating downgrade within 90 days. That said, we believe that most rated institutions will be able to earn their way out of these credit losses during the cycle," S&P said in a statement. "Based on preliminary results, we believe the identified companies stand to underperform peers in the face of the emerging profit-growth pressure," it added. Other financial firms placed on review include BB&T , Capital One Financial Corp., Comerica, Fifth Third Bancorp, and KeyCorp.
At this point, and even before for many, this is getting ridiculous. The market doesn't make sense on many levels. It has been digesting bad news and going up, we know the banks are basically insolvent, the stress tests are due out, employment is awful - yet the market charges higher on a day like this - for what seems like no reason. The shorts once again, using what seems to be valid technical analysis as well as the old and proper analysis by valuations, have been been crushed. There is no reason for these types of moves - Maybe.
As we found out as the next few days played out, the results of the stress tests have been leaking out bit by bit. The Wall Street Journal reports on the 6th some of the conditions and findings of the results. Of course as we now know, they were a joke. What is strange here, the large rally on Monday appeared to be on information known only to the people on the inside. The market didn't do much Tuesday the 5th, up nicely the 6th, only to sell off again Thursday the 7th, perhaps in anticipation of the monthly employment numbers.
Friday, May 8th, 2009
We got the employment numbers at 8:30 as futures were up anyway because of more information (spin) on the stress tests. CNBC interviewd Ken Lewis who claimed he didn't know anything about the leaked stress test results.
The employment numbers (for April) were better than expected at -539,000 & 8.9% (at least headline numbers which are usually revised next month) which drove the futures on the DOW from around 90 up to over 100 by the open.
Some other interesting notes from today I dug up from my previous blog postings. Job losses from February and March were revised upward by 66,000 and we have now lost 5.7 million jobs since December 07. Fannie Mae said it needed another $19 million. As reported on CNBC; “We’re very well capitalized and expect to repay the TARP money soon,” Blankfein told shareholders at the company’s May 8 annual meeting. Goldman sold $10 billion in preferred shares to the Treasury in October. Fifth Third Bank needs to raise capital according to the stress tests, but they are up 43% on three upgrades. From that page you can also find the list of banks and what they need to raise.
At 3:30 that afternoon, Bernstein upgraded Google with a price target of $600. Google was trading around $410.00 at the time.
Late in the day Tim Geithner announced GMAC, the lending arm of General Motors will need and receive substantial support. Of course GM stock, which is trading at a little over a buck, is up for the day. Why would it even be traded, and even worse, why would anyone buy it? Gamblers!
Nouriel Roubini is on Closing Bell with Maria Bartoromo and claims the stress tests are not stressful enough. You would never know it looking at the final numbers for the day/week in the financial sector. The BKX ($BKX)Bank index was up 12.20% TODAY - 30% for the week. What did all this not so good news bring us?
Dow... 8,574.65 +164.80 (+1.92%)
Nasdaq... 1,739.00 +22.76 (+1.33%)
S&P 500... 929.23 +21.84 (+2.41%)
Gold future... 914.90 -0.60 (-0.07%)
30-Year Bond 4.27% +0.01 (+0.31%)
10-Yr Bond... 3.29% -0.00 (-0.06%)
After hours on Friday, we had one bank shut down by regulators. Westsound Bank, Bremerton, WA - the 33rd of the year.
Monday, May 11, 2009
At this point we have broken the technical levels of 875/881 area and closed on Friday at a 929, a 4 month high for the S&P. The banking index has led thoughout this rally, even though the the trouble has not been fixed or addressed. Many traders, trading and investing sites, message boards, etc., don't buy this rally. Too much, to fast. Even Wells Fargo questioned the rally (or did they?):
From its crisis low on March 9, the S&P 500 has risen by more than 35 percent—a rally whose size and speed leave a dizzy feeling of something too good to last! As the enclosed chart illustrates, however, there is precedent for the contemporary stock market surge. This chart compares the contemporary rally with the recession-ending stock market rally in 1982. The solid line shows the cumulative percent change in the S&P 500 index from its low on March 9, 2009, and the dotted line
shows the cumulative percent change in the stock market from its low on August 12, 1982. Thus far, the contemporary rally (now 44 days old) is remarkably similar to the 1982 rally!
Also, we are not far from another key level 934.70, which is the January 6th close. If broken, it would be a new high for the year and give the papers, TV, and government more ammunition to convince the public things are getting better. If this happens, could this perhaps finally convince people this rally was for real, and we should dive back in with both feet? If you watch CNBC like many do, you know they are the biggest bunch of pump monkeys on the planet. They attempt to take bad news and spin it into good news. Why people listen to them I don't understand, but some apparently do. The MSM usually give us headline numbers, such as the DOW closing price and perhaps a reason or two why it went up or down. In my opinion, they use the DOW because it is a large (the largest) number and people assume the bigger the number, the better. It's all about perception and confidence. I would really like to know how many people understand the DOW is only 30 companies, and it is a price (not market capitalization) index, so one stock can affect the index price much easier than the S&P (500 stocks) or Nasdaq (many more). Another reason I think they use the DOW.

The surprised debt holders had believed the malls would be insulated from the parent's bankruptcy because of the way General Growth had structured the assets.
General Growth's action has rattled investors throughout the $700 billion market for securities backed by commercial mortgages, or CMBS. Investors in other deals had also figured their investment was insulated from a parent company's bankruptcy. Now they're worried that General Growth's move will set a precedent that could affect them.
General Growth is the single largest CMBS borrower in the U.S. The CMBS market has grown up over the past two decades to become the major source of financing for commercial real estate.
At this point, commercial real estate problems are no secret, but just getting started, although you would never know it by watching the Dow Jones real estate traking ETF (IYR) which has exposure to commercial as well as residential.
We also read reports from the White House, as reported by the NYT, there would be positive employment growth this year even if the economy began to grow this year. Other bits of bad news on Monday included Lowe's and Home Depot getting downgraded, Bloomberg reports analysts turning Bearish on S&P 500 after 14% rally. In their words; The biggest earnings-season rally since 2002 has pushed 34 percent of the companies in the Standard & Poor’s 500 Index above analysts’ price targets for the next year, raising concerns about the pace of the recovery.The market futures were down before open on Monday and the selloff was on.
Monday also brought some more bad news such as Banks Brace for Cedit Card Write-offs, White House Forcasts Higher U.S. Budget Deficit, the Healthcare bill started getting more ink and air time. The highlight of the day was the drilling the Fed lawyer got in front of congressional committee about where all the bailout money had went. You can see the video here from YouTube.
Merideth Whitney was on CNBC late in the afternoon and stated: Earnings power continues to be an important focus of the banks. Do not see a bottom for fundamentals of bank stocks. Bank stocks defy gravity, grossly overvalued. Continued liquidity contraction. Unclear if this will be the final capital raise. You can watch the video here.
Tuesday, May 12 through Friday were a mixed bag of earnings, economic indicators, and news. The markets sold off for the week and the Bears once again got excited. Friday gapped down and stayed down closing the week at DOW at 8268 and the S&P at 882.88.
Monday, May 18th brought us a nice up move on some bank upgrades. I can't find who they were, but the DOW was up and the 235.44 (2.85%)S&P 500 909.71 +26.83 (3.04%). Incredible, but we will see this again I am sure. Unexpectedly, the market sold off for the next 4 days but stayed in a tight range. Friday's close on the S&P was 887. A pretty uneventful week unless you count the first 4 day losing streak since the March 6th lows.
Monday, May 25 was a holiday so the market was closed. But on the 26th we got another strong move upward. The Case-Shiller index and consumer confidence were decent numbers and the market took off - 196 on the Dow and 23 on the S&P - for no really good reason. The rest of the week were again, a mixed bag of news, reports, and earnings, all shrugged off by the market as it went higher. Friday close on the S&P put us right back around 919 on the last trading day of May.
Monday, June 1, 2009
GM files for bankruptcy is the headline of the day. As they used to say, as GM goes, so goes the country. Not any more apparently because the futures are up big. Up 122 on the Dow and 16 on the S&P. Dow 30 components GM and Citi (GM & C)out, replaced by Cisco & Travelers (CSCO & TRV). GM, even as bankrupt as they are, has a stock that is still trading, and even more crazy, people are still buying and selling it.
But the strange news story of the day is why in the hell are the futures up this big, especially on the GM news? We all know they were going bankrupt, so it should be priced in, one would think. We also know the market rallied hard at the end of the day on Friday, but if you look at the after hours between Friday and Monday you can see this:

Today, Monday, the SPX gapped up to open significantly higher at 923. The market proceed to charge higher (on the GM news as one thing) to 942 by 10:20AM. Let's do a little math here. From 905 to 942 is 37 points. The climb took all of 2 hours between Friday afternoon and 10:20 this morning.
A couple of observations. 1)The economic data that came out last week was not all that good, and even bad in some cases. 2)The ISM and spending data that came out today was not awful, but not that good either. 3)GM, once the largest company in the world, has filed for bankruptcy. 4)We knew this was coming, probably on Monday, and considering the climb in the SPX last week, it would make a good case to be short for the weekend, no? (NOTE: edited for clarity).
For many of us who follow the markets on a daily basis, we have seen moves such as this - or peculiar moves you might say - in the past. At this point in THE rally, many people still consider this a Bear market, and this rally nothing but a bounce. As the talking heads on TV along with the MSM keep telling us everything is better, we might just believe it. Unfortunately, when you follow the data - earnings of the companies, employment reports, consumer confidence, GDP - they don't seem to support where this market is priced. That opinion was shared by many at that time.
The S&P closed this day at 943, up 24 points, a big move. It becomes even stranger when we watch the market trade sideways for the next 9 days, with the S&P index trading in the range of 923 (the open of today) and an intraday of 956.23 on June11th., only to close at 944.89. Only slightly higher than the high of today. The numbers will show we made a bigger move today, than we will in the next 9 days, and we did all this in the span of a couple of hours. Interesting.
Monday, June 15 - Tuesday, July 7
World market were down overnight and it carried over to ours. The S&P lost over 20 to close at 923, right about where it opened on June 1st. The market lost ground for a couple of more days but still stayed in a tight range until a sell-off of 28 points on June 22nd. The index closed at 893, still in the shallow range of 880 to 956, digesting both good and bad moves as they came.
On June 29th, a Monday, a surprisingly honest interview, especially from CNBC about the intervention in the markets.
From June 23rd, the market started a mini-rally grinding upward 888 to 931 on July 1st, a Wednesday. On Thursday July 2nd perhaps driven by some not so good economic reports, along with the last day of a long weekend (market closed Friday for the holiday) the index opened on it's high of 921 and fell throughout the day to 896, a 25 point loss.After the weekend the market futures were down significantly Monday morning. Over 8 points on the S&P. But the market rallied and closed , only to give it all back, and then some on Tuesday.
Friday, May 8, 2009 - stress test results - on or around.
Bernanke testimony - moves market
GE credit rating
after hours spy contracts
Warren Buffet - times & BNI
China stimulus
Early reporting by a bank
ZH after hours trading - September 14 on
Neel Kashkari

2 comments:
Hey
Companies House Webcheck
Webcheck Companies House
[url=http://perosnalbinking.v3host.be/companies-house-webcheck.html]companies house webcheck[/url]
Nude woman [url=http://profiles.friendster.com/122183553] naked tape[/url] Nude babes
Post a Comment