Thursday, July 2, 2009

Market wrap - 5:00PM

The market hours were extended today by 15 minutes due to some electronic system problems at the NYSE. Closed at 4:15. The job numbers didn't sit too well with traders today as we saw a pretty good sell off. Dow 8,280.74 -223.32 (-2.63%) S&P 500 896.42 -26.91 (-2.91%) Nasdaq 1,796.52 -49.20 (-2.67%) Gold 931 -10 -1.09% Oil 66.31 -2.58 -3.75% Today by sector: Today's heatmap:
Lookie what we have here? I'm not a technician, but that looks like a pretty nice head and shoulders. We have yet to find out of course. Earnings season is right around the corner, and next week we have some bond auctions that might be interesting. The economic news is not very good with a few exceptions. Less bad, not as bad as expected, contracting slower, and green shoots have been the buzzwords. The chart is suggesting a bearish tone. I think we may want to watch that chart. Green shoots might turn into weeds.

Big Pay Packages Return to Wall Street - Update 1:22PM

I'm shocked, shocked I tell you: Big Pay Packages Return to Wall Street - WSJ Business is back on Wall Street. If the good times continue to roll, lofty pay packages may be set for a comeback as well. Based on analysts' earnings forecasts for 2009, Goldman Sachs Group Inc. is on track to pay out as much as $20 billion this year, or about $700,000 per employee. That would be nearly double the firm's $363,000 average last year, and slightly higher than the $661,000 for the average Goldman employee in fiscal 2007, according to analyst estimates reviewed by The Wall Street Journal. Morgan Stanley, the only other huge U.S. securities firm left as an independent company, will likely pay out $11 billion to $14 billion in compensation and benefits this year, analysts predict. On a per-employee basis, payouts are expected to exceed last year's average of $262,000. Howard Chen, an analyst at Credit Suisse, projects that the company's average pay will come close to the $340,000 paid out by Morgan Stanley in fiscal 2007. More at link.

California ready to issue IOUs - 11:36AM

California ready to issue IOUs Full link here The controller's office is set to begin printing the scrip this afternoon, the first time in 17 years. Some 28,742 IOUs worth $53.3 million will be sent, mostly to residents awaiting tax refunds. By Eric Bailey 7:03 AM PDT, July 2, 2009 Reporting from Sacramento — With budget negotiators at a loggerheads and California government facing a cash crisis, the state controller's office will start printing IOUs this afternoon for the first time in 17 years. The presses are set to start at 2 p.m., churning out 28,742 IOUs worth $53.3 million that will be dispatched mostly to residents throughout the state still awaiting their income-tax refunds. A panel of state finance officials will meet this morning to set the interest rate for banks and other financial institutions that decide to accept the IOUs. Some banks have agreed to honor them, including Bank of America, which will do so until July 10. Other banks have not made a decision. The move comes little more than a day after Senate Republicans, with the support of Gov. Arnold Schwarzenegger, blocked an 11th-hour attempt by Democratic leaders to push through a slate of bills that would have staved off the IOUs. With the California economy hobbled, tax receipts waning and the budget deficit continuing to swell, the governor Wednesday declared a fiscal emergency, and ordered state workers to take a third unpaid furlough day each month. He also issued a new list of cuts to schools and public universities to address a deficit that his finance team now says has swelled to $26.3 billion. Schwarzenegger's latest cuts are designed to pare state spending by an additional $4.9 billion.
Green shoots!

MANUFACTURERS' SHIPMENTS, INVENTORIES, AND ORDERS - 10:00AM

For May - full report here Summary New orders for manufactured goods in May, up three of the last four months, increased $4.1 billion or 1.2 percent to $347.9 billion, the U.S. Census Bureau reported today. This followed a 0.5 percent April increase. Excluding transportation, new orders increased 0.8 percent. Shipments, down ten consecutive months, decreased $3.1 billion or 0.9 percent to $353.3 billion. This was the longest streak of consecutive monthly decreases since the series was first published on a NAICS basis in 1992 and followed a 0.5 percent April decrease. Unfilled orders, down eight consecutive months, decreased $1.8 billion or 0.2 percent to $747.3 billion. This was the longest streak of consecutive monthly decreases since November 2001-July 2002. This followed a 1.1 percent April decrease. The unfilled orders-to-shipments ratio was 6.15, up from 6.04 in April. Inventories, down nine consecutive months, decreased $3.2 billion or 0.6 percent to $513.3 billion. This was the longest streak of consecutive monthly decreases since March 2003-January 2004 and followed a 1.2 percent April decrease. The inventories-to-shipments ratio was 1.45, unchanged from April. New Orders New orders for manufactured durable goods in May, up three of the last four months, increased $2.9 billion or 1.8 percent to $163.4 billion, unchanged from the previously published increase. This followed a 1.4 percent April increase. New orders for manufactured nondurable goods increased $1.2 billion or 0.7 percent to $184.5 billion. Shipments Shipments of manufactured durable goods in May, down ten consecutive months, decreased $4.3 billion or 2.5 percent to $168.9 billion, revised from the previously published 2.1 percent decrease. This also was the longest streak of consecutive monthly decreases since the series was first published on a NAICS basis in 1992 and followed a 0.7 percent April decrease. Shipments of manufactured nondurable goods, up following three consecutive monthly decreases, increased $1.2 billion or 0.7 percent to $184.5 billion. This followed a 0.2 percent April decrease. This increase was due to petroleum and coal products, which increased $2.5 billion or 8.3 percent to $32.3 billion. Unfilled Orders Unfilled orders for manufactured durable goods in May, down eight consecutive months, decreased $1.8 billion or 0.2 percent to $747.3 billion, revised from the previously published 0.3 percent decrease. This followed a 1.1 percent April decrease. Inventories Inventories of manufactured durable goods in May, down five consecutive months, decreased $3.3 billion or 1.0 percent to $322.1 billion, revised from the previously published 0.8 percent decrease. This followed a 1.2 percent April decrease. Inventories of manufactured nondurable goods, up following eight consecutive monthly decreases, increased slightly to $191.2 billion. This followed a 1.1 percent April decrease. Petroleum and coal products drove the increase, up $0.7 billion or 3.0 percent to $25.2 billion. By stage of fabrication, May materials and supplies decreased 1.7 percent in durable goods and increased 0.3 percent in nondurable goods. Work in process decreased 0.2 percent in durable goods and increased 0.2 percent in nondurable goods. Finished goods decreased 1.4 percent in durable goods and 0.3 percent in nondurable goods.

Jobs report - 8:31AM

Opps! Did the green shoots get mowed down? Full report here THE EMPLOYMENT SITUATION: JUNE 2009 Nonfarm payroll employment continued to decline in June (-467,000), and the unemployment rate was little changed at 9.5 percent, the Bureau of Labor Statistics of the U.S. Department of Labor reported today. Job losses were widespread across the major industry sectors, with large declines occurring in manufacturing, professional and business services, and construction. Unemployment (Household Survey Data) The number of unemployed persons (14.7 million) and the unemployment rate (9.5 percent) were little changed in June. Since the start of the recession in December 2007, the number of unemployed persons has increased by 7.2 million, and the unemployment rate has risen by 4.6 percentage points. If you got to the site you need to look at the U-6 number: June 09 = 16.8 vs May = 15.9 U6 is Total unemployed, plus all marginally attached workers, plus total employed part time for economic reasons, as a percent of the civilian labor force plus all marginally attached workers.

Pre-market - July 2, 2009

Futures down before the jobs report: DJIA INDEX 8,398.00 -50.00 S&P 500 913.20 -6.00 NASDAQ 100 1,469.75 -9.00 Gold 941 14 1.50% Oil 68.05 -1.41 -2.03% Today's economic calendar: ECB Announcement 7:45 AM ET (interest rate unchanged) Employment Situation 8:30 AM ET Jobless Claims 8:30 AM ET 30-Yr Bond Announcement 9:00 AM ET Factory Orders 10:00 AM ET EIA Natural Gas Report 10:30 AM ET 3-Month Bill Announcement 11:00 AM ET 6-Month Bill Announcement 11:00 AM ET 3-Yr Note Announcement 11:00 AM ET 10-Yr Note Announcement 11:00 AM ET 10-Yr TIPS Announcement 11:00 AM ET Money Supply 4:30 PM ET Today's earnings reports: After market closes in BOLD

Wednesday, July 1, 2009

Construction spending - June - 10:10AM

Full report here For Release at 10:00 A.M. EDT, Wednesday, July 1, 2009 Michael Davis, Linnet Holland, or John Tremblay CB09-100 (301) 763-1605 MAY 2009 CONSTRUCTION AT $964.0 BILLION ANNUAL RATE The U.S. Census Bureau of the Department of Commerce announced today that construction spending during May 2009 was estimated at a seasonally adjusted annual rate of $964.0 billion, 0.9 percent (±1.1%)* below the revised April estimate of $972.5 billion. The May figure is 11.6 percent (±1.6%) below the May 2008 estimate of $1,090.7 billion. During the first 5 months of this year, construction spending amounted to $368.8 billion, 11.7 percent (±1.4%) below the $417.5 billion for the same period in 2008. PRIVATE CONSTRUCTION Spending on private construction was at a seasonally adjusted annual rate of $649.2 billion, 1.0 percent (±1.1%)* below the revised April estimate of $655.6 billion. Residential construction was at a seasonally adjusted annual rate of $240.2 billion in May, 3.4 percent (±1.3%) below the revised April estimate of $248.8 billion. Nonresidential construction was at a seasonally adjusted annual rate of $409.0 billion in May, 0.5 percent (±1.1%)* above the revised April estimate of $406.9 billion. PUBLIC CONSTRUCTION In May, the estimated seasonally adjusted annual rate of public construction spending was $314.9 billion, 0.6 percent (±1.9%)* below the revised April estimate of $316.9 billion. Educational construction was at a seasonally adjusted annual rate of $91.3 billion, 0.5 percent (±2.7%)* above the revised April estimate of $90.8 billion. Highway construction was at a seasonally adjusted annual rate of $78.5 billion, 1.3 percent (±6.6%)* below the revised April estimate of $79.5 billion.

ISM Manufacturing report - 10:10AM

Full report here June 2009 Manufacturing ISM Report On Business® PMI at 44.8% DO NOT CONFUSE THIS NATIONAL REPORT with the various regional purchasing reports released across the country. The national report's information reflects the entire United States, while the regional reports contain primarily regional data from their local vicinities. Also, the information in the regional reports is not used in calculating the results of the national report. The information compiled in this report is for the month of June 2009. Production Growing New Orders, Employment and Inventories Contracting Prices Unchanged Supplier Deliveries Slower (Tempe, Arizona) — Economic activity in the manufacturing sector failed to grow in June for the 17th consecutive month, while the overall economy grew for the second consecutive month following seven months of decline, say the nation's supply executives in the latest Manufacturing ISM Report On Business®. The report was issued today by Norbert J. Ore, CPSM, C.P.M., chair of the Institute for Supply Management™ Manufacturing Business Survey Committee. "Manufacturing continues to contract at a slower rate, but the trends in the indexes are encouraging as seven of 18 industries reported growth in June. Most encouraging is the gain in the Production Index, which is up 12.1 percentage points in the last two months to 52.5 percent. Aggressive inventory reduction continues and indications are that the de-stocking cycle is at or near the end in most industries, as the Customers' Inventories Index remained below 50 percent for the third consecutive month. The Prices Index was unchanged from May, indicating that the supply/demand balance is improving. Overall, a slow recovery for manufacturing is forming based on the current trends in the ISM data." PERFORMANCE BY INDUSTRY Seven of the 18 manufacturing industries reported growth in June. These industries — listed in order — are: Petroleum & Coal Products; Printing & Related Support Activities; Wood Products; Nonmetallic Mineral Products; Miscellaneous Manufacturing; Chemical Products; and Primary Metals. The industries reporting contraction in June — listed in order — are: Apparel, Leather & Allied Products; Furniture & Related Products; Machinery; Computer & Electronic Products; Electrical Equipment, Appliances & Components; Plastics & Rubber Products; Textile Mills; Transportation Equipment; Food, Beverage & Tobacco Products; and Fabricated Metal Products. WHAT RESPONDENTS ARE SAYING ... * "Customer inventory burn is complete and real demand has reappeared." (Machinery) * "... a lot of people are requoting old business and using favorable pricing to negotiate with their current suppliers." (Computer & Electronic Products) * "Banks are reluctant to lend to businesses, and until this changes the economy will continue to be weak." (Fabricated Metal Products) * "Slow June, but firm large orders in July, August and September." (Food, Beverage & Tobacco Products) * "Market appears to have bottomed out as aftermarket has picked up slightly over the past month." (Transportation Equipment)

ADP job report - 8:15AM

Not so good it seems: Full link here ROSELAND, N.J. – July 1, 2009 – According to today’s ADP National Employment Report®, private sector employment decreased by 473,000 in June. The ADP National Employment Report, created by ADP® Employer Services, a division of Automatic Data Processing, Inc. (ADP), in partnership with Macroeconomic Advisers, LLC, is derived from actual payroll data and measures the change in total nonfarm private employment each month. Nonfarm Private Employment Highlights – June Report: • Total employment: -473,000 • Small businesses* -177,000 • Medium businesses** -205,000 • Large businesses*** -91,000 • Goods-producing sector: -250,000 • Service-providing sector: -223,000 Addendum: • Manufacturing industry: -146,000 * Small businesses represent payrolls with 1-49 employees ** Medium businesses represent payrolls with 50-499 employees *** Large businesses represent payrolls with more than 499 employees

Pre-market - July 1, 2009

Futures up slightly this morning before some important numbers come out later: DJIA INDEX 8,433.00 39.00 S&P 500 920.70 5.20 NASDAQ 100 1,485.25 9.00 Gold 927 -13 -1.41% Oil 71.11 +1.21 +1.73% Economic calendar for today: Monster Employment Index Motor Vehicle Sales[djStar] MBA Purchase Applications 7:00 AM ET Challenger Job-Cut Report 7:30 AM ET ADP Employment Report 8:15 AM ET ISM Mfg Index 10:00 AM ET Construction Spending 10:00 AM ET Pending Home Sales Index 10:00 AM ET EIA Petroleum Status Report 10:30 AM ET Today's earnings reports: After market closed in BOLD

Tuesday, June 30, 2009

Market wrap - 4:15PM

Another slow day in the market. Volume down, little price action except for a few. Thee market was up a little after open, until the 10:00 Consumer Sentiment was released. Number went the wrong way and the market quickly sold off to a low of 912.86, from a high of 930.01 at 9:45 on the S&P. The large sell off came at 10:00 reports. The market hit the lows at 11:38. The market then traded lightly in a very gradual climb to the close. Dow 8,447.53 -81.85 (-0.96%) S&P 500 919.32 -7.91 (-0.85%) Nasdaq 1,835.04 -9.02 (-0.49%) Gold 927 -13 -1.41% Oil 70.08 -1.60 -2.23% Today by sector: Today's heatmap: Economic calendar for tomorrow: Monster Employment Index Motor Vehicle Sales[djStar] MBA Purchase Applications 7:00 AM ET Challenger Job-Cut Report 7:30 AM ET ADP Employment Report 8:15 AM ET ISM Mfg Index 10:00 AM ET Construction Spending 10:00 AM ET Pending Home Sales Index 10:00 AM ET EIA Petroleum Status Report 10:30 AM ET Tomorrows earnings reports - After market close in BOLD

U.S. housing misery poised to enter new phase - Reuters - 1:45PM

Link to article here. U.S. housing misery poised to enter new phase U.S. housing misery poised to enter new phase Fri Jun 26, 2009 1:25pm EDT By Herbert Lash - Analysis NEW YORK (Reuters) - Signs that home prices may have bottomed have stirred hope on Wall Street that the economy is on the mend, yet tight credit and a new foreclosure wave cast doubt on any looming housing revival. Sales of previously owned U.S. homes rose for a second straight month in May, realty data on Tuesday showed, while the U.S. government and Federal Reserve have designed a number of programs to alleviate a battered housing market. However, the chief economist of the National Association of Realtors warned of the danger of a "delayed" recovery in housing, with prices down 32 percent nationwide from their peak three years ago. Big risk factors that could spur more foreclosures include expectations of rising unemployment and the forecast resetting of interest rates on 2.8 million subprime and Alt-A mortgages in the next two years. Delinquency rates on mortgage payments typically rise in tandem with unemployment, which is expected to top 10 percent after hitting a 25-year high of 9.4 percent in May. And when mortgages interest rates reset, they are typically at higher rates that can cause monthly payments to balloon. "I'm worried that the investment community is a little too sanguine about how much of the housing pain is behind us and that we might be in the all-clear," said Ronald Temple, co-director of research at Lazard Asset Management in New York. Against this backdrop comes continuing tightness in housing credit. According to Amherst Securities Group LP, a severe lack of credit outside of government-sponsored mortgages has reduced loans, especially for the purchase of new homes, and is putting further downward pressure on prices. Authorities are aware of the hurdles housing poses to economic recovery. The U.S. government is trying to stabilize housing by offering incentives for lenders to favorably modify the terms of delinquent mortgages. And the Federal Reserve has pledged to buy as much as $1.25 trillion in mortgage-backed securities to free up funding for new home loans. FORECLOSURES HITTING THE MORE CREDIT-WORTHY One in eight U.S. households at the end of March had entered foreclosure or was delinquent on payments, the Mortgage Bankers Association (MBA) said last month. The number of homes in foreclosure in the first quarter jumped to a record 3.85 percent of outstanding U.S. mortgages, MBA said. The bulk of recent foreclosures was on prime, fixed-rate loans, extended to the most credit-worthy borrowers and the bedrock of home ownership in America. The first wave of foreclosures had been mostly on subprime loans offered to the riskiest borrowers. The foreclosure rate is getting worse and will likely rise to about 4.5 percent, said Patrick Newport, an economist at IHS in Lexington, Massachusetts who closely follows housing. "What's driving people to leave their homes is a combination of having their house under water and then losing their job," Newport said. "Under water," or negative equity, refers to when the market value of a home is less than the mortgage. "We're in this vicious cycle and there are no signs that we're getting out of it," Newport said. Another wave of defaults, this one associated with Alt-A loans, is building. While Alt-A borrowers in general were more credit-worthy, they included self-documented income histories, which may be problematic, and loans that need to be recast or redone, said Mark Fleming, chief economist at First American CoreLogic. About 812,000 adjustable-rate mortgages, or 11 percent, have already had their interest rates reset, according to Loan Performance, a unit of First American CoreLogic Inc, a leading provider of real estate and property information. Compounding the problem for loans facing rate resets is that the potential for negative equity has increased as home prices have fallen more. "These homeowners are having this issue of resets in an environment where the economic stress is higher, and the cumulative effect of house price declines is higher," Fleming said. LIMITED CREDIT SQUEEZING HOUSING MARKET In addition, while analysts and the press have focused on foreclosures and unemployment, the lack of mortgage credit has "received significantly less attention than it deserves" and instead of being addressed, continues to deteriorate, according to Amherst. Government-sponsored lending, known as agency debt, soared to account for more than 98 percent of U.S. residential loans in the first quarter. That is a dramatic surge from 2005 and 2006 -- the height of the housing boom -- when it was less than 50 percent, according to data that Amherst compiled from Inside MBS & ABS, Loan Performance and its own information. Mortgage debt held in bank portfolios has dropped, while issuance of subprime and Alt-A loans, the latter accounting for $1 trillion in mortgage issuance in both 2005 and 2006, has plunged. Only $64 billion was issued in that space last year. While agency activity has picked up considerably, most of that has been for refinancing existing loans, leaving very little credit for new home loans, Amherst said. New lending has been minimal and one reason for declining home prices is that mortgage credit is very tight, Amherst said. And declining prices could spell more trouble in the future. The average U.S. household at the end of March held only 8 percent equity in their home, Temple said. A 20 percent slide in home prices could lead in two years to more than 30 million people who owe more than their homes are worth, he said.
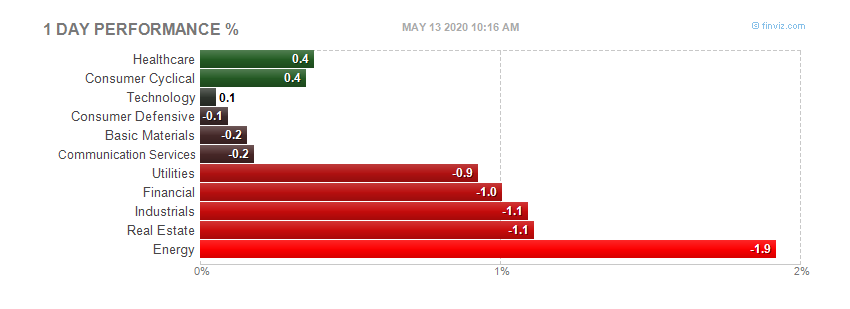
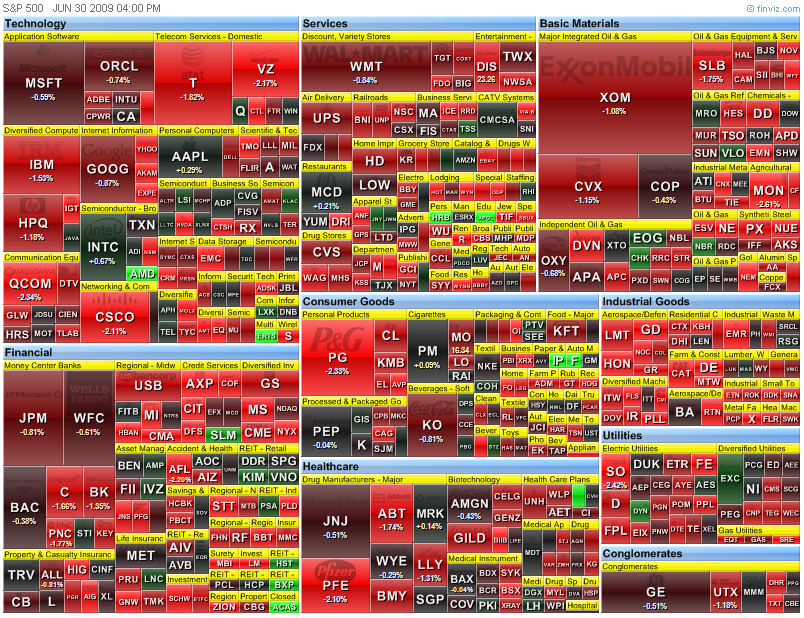
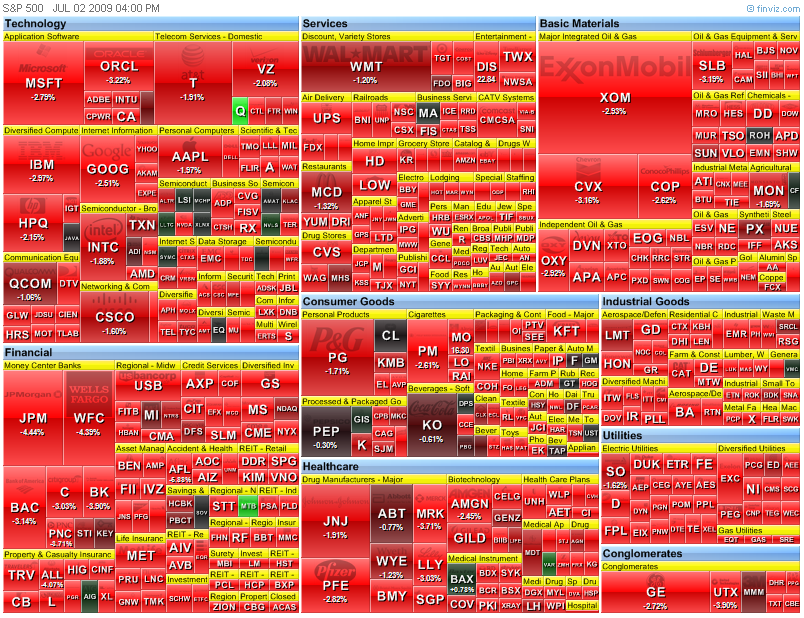
Consumer confidence report - 10:45AM

Full report here. Consumer Confidence Survey™ Press Release Please visit the Consumer Research Center pages to learn more about: * detailed consumer confidence data * additional consumer information * benefits of center membership THESE DATA ARE FOR ANALYSIS PURPOSES ONLY. NOT FOR REDISTRIBUTION, PUBLISHING, DATABASING, OR PUBLIC POSTING WITHOUT EXPRESS WRITTEN PERMISSION. The Conference Board Consumer Confidence Index™ Retreats June 30, 2009 The Conference Board Consumer Confidence Index™, which had improved considerably in May, retreated in June. The Index now stands at 49.3 (1985=100), down from 54.8 in May. The Present Situation Index decreased to 24.8 from 29.7. The Expectations Index declined to 65.5 from 71.5 in May. The Consumer Confidence SurveyTM is based on a representative sample of 5,000 U.S. households. The monthly survey is conducted for The Conference Board by TNS. TNS is the world’s largest custom research company. The cutoff date for June’s preliminary results was June 23rd. Says Lynn Franco, Director of The Conference Board Consumer Research Center: "After back-to-back months of strong gains, Consumer Confidence retreated in June. The decline in the Present Situation Index, caused by a less favorable assessment of business conditions and employment, continues to imply that economic conditions, while not as weak as earlier this year, are nonetheless weak. Looking ahead, Expectations continue to suggest less negative conditions in the months ahead, as opposed to strong growth." Consumers' appraisal of present-day conditions was less favorable in June. Those claiming business conditions are "good" decreased to 8.0 percent from 8.8 percent, while those saying conditions are "bad" increased to 45.6 percent from 44.5 percent. Consumers’ assessment of the labor market was also less favorable. Those stating jobs are "hard to get" increased to 44.8 percent from 43.9 percent. Those saying jobs are "plentiful" decreased to 4.5 percent from 5.8 percent. Consumers' short-term outlook also waned in June. Consumers anticipating an improvement in business conditions over the next six months decreased to 21.2 percent from 22.5 percent, while those expecting conditions will worsen increased to 20.2 percent from 18.0 percent in May. The job outlook was also more pessimistic. Those anticipating more jobs in the months ahead decreased to 17.4 percent from 19.3 percent, while those anticipating fewer jobs increased to 27.3 percent from 25.6 percent. The proportion of consumers expecting an increase in their incomes declined to 9.8 percent from 10.8 percent. The next release is scheduled for Tuesday, July 28, at 10:00 AM ET. For further information contact: Lynn Franco at +1 212 339 0344 lynn.franco@conference-board.org
There is nothing in this report that is good. The last time it was released, the market shot up like a rocket because it spiked (bump is more like it)up a little. The clowns (clowns is being nice) on CNBC hailed it all day as "GREEN SHOOTS". Today, the worse of the worse, Larry "I can scream louder than you" Kudlow, an admitted permabull, said "ehh" no big deal. It sure was the last time you damn liar. Kudlow is beyond watchable, and CNBC is getting there fast. What a bunch of assclowns.

Chicago PMI - 11:42AM

Full report here. Chicago PMI Better than Expected Last Update: 30-Jun-09 10:08 ET According to the Institute of Supply Management-Chicago and Kingsbury International, Ltd., the Chicago Purchasing Managers Index increased to 39.9 in June from 34.9 in May. That was better than the consensus estimate of 39.0 and above the six-month average of 35.6. A reading below 50 still connotes a contraction in manufacturing activity in this region, although the uptick from May implies the rate of contraction has slowed. The June number improved month-to-month, aided by an uptick in new orders, which jumped to 41.6 from 37.3. In fact, increases were seen in every component index, although some increases didn't necessarily imply encouraging things. For instance, the inventories index went up to 34.2 from 31.5 and prices paid increased to 36.3 from 29.8. Separately, production improved to 39.3 from 38.1, order backlogs increased to 37.6 from 26.3, and employment edged up to 28.9 from 25.0. This survey was better than expected, but one needs to be careful not to extrapolate too much encouragement from it just yet knowing that it follows on the heels of a very problematic period for the auto industry, which is closely linked to the Chicago region. In other words, it could simply mark a temporary bounce from a very depressed situation.

Pre-market - June 30, 2009

Futures up a little before things get underway today: DJIA INDEX 8,469.00 11.00 S&P 500 922.80 1.60 NASDAQ 100 1,483.00 1.50 Gold 941 0 -0.03% Oil 71.41 -0.11 -0.15% Today's economic calendar: ICSC-Goldman Store Sales 7:45 AM ET Redbook 8:55 AM ET Chicago PMI 9:45 AM ET Consumer Confidence 10:00 AM ET State Street Investor Confidence Index 10:00 AM ET Jim Bullard Speaks 12:00 PM ET 4-Week Bill Auction 1:00 PM ET 52-Week Bill Auction 1:00 PM ET Today's earnings reports: Before market opens in BOLD

Monday, June 29, 2009

Market wrap - 4:10PM

Well, there you have it. Another day watching the paint dry. Awful market, no volume (other than the 10 o'clock jam job). Dow 8,529.76 +91.37 (1.08%) S&P 500 927.12 +8.22 (0.89%) Nasdaq 1,844.06 +5.84 (0.32%) Gold 941 0 -0.03% Oil 71.49 2.33 3.37% Today by sector: Funny, nothing up big, but all sectors up. 91 points on the DOW worth.

Madoff sentanced to 150 years - Update11:35AM

More details when I can get them. The news just broke. Update 11:40AM - From MarketWatch Madoff faces life in prison at sentencing NEW YORK (MarketWatch) -- Bernard Madoff on Monday will learn his fate for stealing at least $13 billion from thousands of unwitting victims, and regardless of the sentence, it's likely that the 71-year-old admitted swindler will end up in jail for the rest of his life. Madoff, who bilked clients over several decades in what's been called the biggest Ponzi scheme in history, could be sentenced to a maximum of 150 years in a Manhattan courthouse at 10 a.m. Eastern. His lawyers, however, have reportedly sought a sentence of just 12 years, arguing that Madoff is expected to live only another 13 years. In March, Madoff pleaded guilty to 11 felony charges, including securities fraud, money laundering and theft from an employee-benefit plan. His clients have reportedly lost more than $13 billion. See archived story. Madoff's scam, which he admitted to his sons last December, came undone as too many clients sought to withdraw money at the same time in the aftermath of the September 2008 financial meltdown. As the credit crisis hit hard and falling markets sparked exploding demand for cash, investors sought to tap the funds they had with Madoff to meet other commitments and raise cash. But, as Madoff recounted it to his sons, he had been using new investors' money to fund earlier investors' returns, and when too many clients sought to withdraw money, the game was up. It was the classic unraveling of the Ponzi scheme, named for one of the scam's most successful perpetrators, Charles Ponzi, who ran it in the early 20th century. While thousands lost money with Madoff, some of his clients were higher-profile than others, ranged across occupations from entertainers to executives, and included several charities and foundations -- several of which were completely wiped out. See interactive list of Madoff's victims. His victims included Fred Wilpon, an owner of the New York Mets baseball team, as well as Norman Braman, the former owner of football's Philadelphia Eagles, and the Elie Wiesel Foundation for Humanity. Madoff's sentencing comes just days after his wife agreed to relinquish her claim to more than $80 million of assets, according to a Wall Street Journal report. Ruth Madoff gave up millions of dollars in cash and securities, as well as her $7.5 million interest in a New York City apartment and a $7 million Montauk, N.Y., property, the Journal reported. She will retain $2.5 million. See full story at WSJ.com. The court-appointed trustee has so far recovered just $1.2 billion of the losses that investors suffered. Most of what the trustee is expected to recover from now on will come from any "clawback" suits against investors who had withdrawn money from their accounts with Madoff in recent years, the Journal reported. See full story at WSJ.com.

Someone finally admits it - and more surprising - CNBC let them say it - 9:55AM

Watch this video, and pay special attention to the guy in the red shirt:


This guy said some things I thought would never see the light of television, little lone the cheerleaders from CNBC. Incredible!

Pre-market - June 29, 2009

Futures up slightly this morning: DJIA INDEX 8,394.00 21.00 S&P 500 916.50 2.60 NASDAQ 100 1,481.75 5.00 Gold 941 2 0.16% Oil 69.94 +0.83 +1.20% Today's economic calendar: 4-Week Bill Announcement 11:00 AM ET 3-Month Bill Auction 1:00 PM ET 6-Month Bill Auction 1:00 PM ET Farm Prices 3:00 PM ET Today's earnings reports: Before market opens in BOLD