Thursday, August 27, 2009
Jobless clams - 8:30am
Full report here
UNEMPLOYMENT INSURANCE WEEKLY CLAIMS REPORT
SEASONALLY ADJUSTED DATA
In the week ending Aug. 15, the advance figure for seasonally adjusted initial claims was 576,000, an increase of 15,000 from the previous week's revised figure of 561,000. The 4-week moving average was 570,000, an increase of 4,250 from the previous week's revised average of 565,750.
The advance seasonally adjusted insured unemployment rate was 4.7 percent for the week ending Aug. 8, unchanged from the prior week's unrevised rate of 4.7 percent.
The advance number for seasonally adjusted insured unemployment during the week ending Aug. 8 was 6,241,000, an increase of 2,000 from the preceding week's revised level of 6,239,000. The 4-week moving average was 6,266,000, a decrease of 2,500 from the preceding week's revised average of 6,268,500.
The fiscal year-to-date average for seasonally adjusted insured unemployment for all programs is 5.565 million.
UNADJUSTED DATA
The advance number of actual initial claims under state programs, unadjusted, totaled 454,216 in the week ending Aug. 15, a decrease of 28,406 from the previous week. There were 343,169 initial claims in the comparable week in 2008.
The advance unadjusted insured unemployment rate was 4.4 percent during the week ending Aug. 8, unchanged from the prior week. The advance unadjusted number for persons claiming UI benefits in state programs totaled 5,798,001, a decrease of 97,650 from the preceding week. A year earlier, the rate was 2.4 percent and the volume was 3,160,610.
Extended benefits were available in Alaska, Arizona, Arkansas, California, Colorado, Connecticut, Delaware, the District of Columbia, Florida, Georgia, Idaho, Illinois, Indiana, Kansas, Kentucky, Maine, Massachusetts, Michigan, Minnesota, Missouri, Nevada, New Jersey, New York, North Carolina, Ohio, Oregon, Pennsylvania, Puerto Rico, Rhode Island, South Carolina, Tennessee, Texas, Vermont, Virginia, Washington, and Wisconsin during the week ending Aug. 1.
Initial claims for UI benefits by former Federal civilian employees totaled 1,639 in the week ending Aug. 8, an increase of 271 from the prior week. There were 2,252 initial claims by newly discharged veterans, an increase of 232 from the preceding week.
There were 20,577 former Federal civilian employees claiming UI benefits for the week ending Aug. 1, an increase of 1,009 from the previous week. Newly discharged veterans claiming benefits totaled 30,325, a decrease of 15 from the prior week.
States reported 2,877,756 persons claiming EUC (Emergency Unemployment Compensation) benefits for the week ending Aug. 1, an increase of 92,384 from the prior week. There were 1,406,779 claimants in the comparable week in 2008. EUC weekly claims include both first and second tier activity.
The highest insured unemployment rates in the week ending Aug. 1 were in Puerto Rico (7.3 percent), Oregon (6.2), Pennsylvania (6.1), Michigan (5.9), Nevada (5.9), Wisconsin (5.5), California (5.3), Connecticut (5.3), New Jersey (5.3), North Carolina (5.1), and South Carolina (5.1).
The largest increases in initial claims for the week ending Aug. 8 were in Tennessee (+2,525), North Carolina (+2,469), Wisconsin (+2,078), Georgia (+1,753), and Washington (+1,697), while the largest decreases were in California (-5,635), Michigan (-1,490), Ohio (-951), Kentucky (-690), and Delaware (-226).
More at link with tables
GDP report - 8:30am
Full report here
GROSS DOMESTIC PRODUCT: SECOND QUARTER (SECOND ESTIMATE)
CORPORATE PROFITS: SECOND QUARTER (PRELIMINARY ESTIMATE)
Real gross domestic product -- the output of goods and services produced by labor and property located in the United States -- decreased at an annual rate of 1.0 percent in the second quarter of 2009, (that is, from the first quarter to the second quarter), according to the "second" estimate released by the Bureau of Economic Analysis. In the first quarter, real GDP decreased 6.4 percent.
The GDP estimate released today is based on more complete source data than were available for the "advance" estimate issued last month. In the advance estimate, the decrease in real GDP was also 1.0 percent (see "Revisions" on page 3).
The decrease in real GDP in the second quarter primarily reflected negative contributions from private inventory investment, nonresidential fixed investment, personal consumption expenditures (PCE), residential fixed investment, and exports that were partly offset by positive contributions from federal government spending and state and local government spending. Imports, which are a subtraction in the calculation of GDP, decreased.
The much smaller decrease in real GDP in the second quarter than in the first primarily reflected much smaller decreases in nonresidential fixed investment and in exports, an upturn in federal government spending, smaller decreases in private inventory investment and residential fixed investment, and an upturn in state and local government spending that were partly offset by a much smaller decrease in imports and a downturn in PCE.
Motor vehicle output added 0.20 percentage point to the second-quarter change in real GDP after subtracting 1.69 percentage points from the first-quarter change. Final sales of computers subtracted 0.05 percentage point from the second-quarter change in real GDP after adding 0.06 percentage point to the first-quarter change.
________________________
FOOTNOTE.--Quarterly estimates are expressed at seasonally adjusted annual rates, unless otherwise specified. Quarter-to-quarter dollar changes are differences between these published estimates. Percent changes are calculated from unrounded data and are annualized. “Real” estimates are in chained (2005) dollars. Price indexes are chain-type measures.
This news release is available on BEA’s Web site along with the Technical Note and Highlights related to this release.
________________________
The price index for gross domestic purchases, which measures prices paid by U.S. residents, increased 0.5 percent in the second quarter, 0.2 percentage point less than in the advance estimate; this index decreased 1.4 percent in the first quarter. Excluding food and energy prices, the price index for gross domestic purchases increased 0.8 percent in the second quarter, compared with an increase of 0.2 percent in the first.
Real personal consumption expenditures decreased 1.0 percent in the second quarter, in contrast to an increase of 0.6 percent in the first. Real nonresidential fixed investment decreased 10.9 percent, compared with a decrease of 39.2 percent. Nonresidential structures decreased 15.1 percent, compared with a decrease of 43.6 percent. Equipment and software decreased 8.4 percent, compared with a decrease of 36.4 percent. Real residential fixed investment decreased 22.8 percent, compared with a decrease of 38.2 percent.
Real exports of goods and services decreased 5.0 percent in the second quarter, compared with a decrease of 29.9 percent in the first. Real imports of goods and services decreased 15.1 percent, compared with a decrease of 36.4 percent.
Real federal government consumption expenditures and gross investment increased 11.0 percent in the second quarter, in contrast to a decrease of 4.3 percent in the first. National defense increased 13.3 percent, in contrast to a decrease of 5.1 percent. Nondefense increased 6.2 percent, in contrast to a decrease of 2.5 percent. Real state and local government consumption expenditures and gross
investment increased 3.6 percent, in contrast to a decrease of 1.5 percent.
The change in real private inventories subtracted 1.39 percentage points from the second-quarter change in real GDP, after subtracting 2.36 percentage points from the first-quarter change. Private businesses decreased inventories $159.2 billion in the second quarter, following decreases of $113.9 billion in the first and $37.4 billion in the fourth.
Real final sales of domestic product -- GDP less change in private inventories -- increased 0.4 percent in the second quarter, in contrast to a decrease of 4.1 percent in the first.
Gross domestic purchases
Real gross domestic purchases -- purchases by U.S. residents of goods and services wherever produced -- decreased 2.5 percent in the second quarter, compared with a decrease of 8.6 percent in the first.
Gross national product
Real gross national product -- the goods and services produced by the labor and property supplied by U.S. residents -- decreased 0.8 percent in the second quarter, compared with a decrease of 6.6 percent in the first. GNP includes, and GDP excludes, net receipts of income from the rest of the world, which increased $6.4 billion in the second quarter after decreasing $6.1 billion in the first; in the
second quarter, receipts decreased $16.8 billion, and payments decreased $23.2 billion.
Current-dollar GDP
Current-dollar GDP -- the market value of the nation's output of goods and services -- decreased 1.0 percent, or $34.7 billion, in the second quarter to a level of $14,143.3 billion. In the first quarter, current-dollar GDP decreased 4.6 percent, or $169.3 billion.
Revisions
The “second” estimate of the second-quarter decrease in real GDP is the same as the advance estimate. Upward revisions to exports, residential fixed investment, PCE, and government spending were offset by downward revisions to private inventory investment and to nonresidential fixed investment.
Advance Estimate Second Estimate
(Percent change from preceding quarter)
Real GDP............................... -1.0 -1.0
Current-dollar GDP..................... -0.8 -1.0
Gross domestic purchases price index... 0.7 0.5
Corporate Profits
Profits from current production (corporate profits with inventory valuation and capital consumption adjustments) increased $67.6 billion in the second quarter, compared with an increase of $59.1 billion in the first quarter. Current-production cash flow (net cash flow with inventory valuation adjustment) -- the internal funds available to corporations for investment -- decreased $26.9 billion in the second quarter, in contrast to an increase of $16.2 billion in the first.
Taxes on corporate income increased $40.8 billion in the second quarter, compared with an increase of $47.0 billion in the first. Profits after tax with inventory valuation and capital consumption adjustments increased $26.8 billion in the second quarter, compared with an increase of $12.0 billion in the first. Dividends decreased $47.0 billion compared with a decrease of $51.8 billion; current-production undistributed profits increased $73.8 billion, compared with an increase of $63.7 billion.
Domestic profits of financial corporations increased $39.7 billion in the second quarter, compared with an increase of $115.9 billion in the first. Domestic profits of nonfinancial corporations increased $28.4 billion in the second quarter, in contrast to a decrease of $40.2 billion in the first. In the second quarter, real gross value added of nonfinancial corporations decreased, and profits per unit of
real value added increased. The increase in unit profits reflected decreases in unit labor and nonlabor costs that more than offset a decrease in unit prices.
The rest-of-the-world component of profits decreased $0.6 billion in the second quarter, compared with a decrease of $16.6 billion in the first. This measure is calculated as (1) receipts by U.S. residents of earnings from their foreign affiliates plus dividends received by U.S. residents from unaffiliated foreign corporations minus (2) payments by U.S. affiliates of earnings to their foreign
parents plus dividends paid by U.S. corporations to unaffiliated foreign residents. The second-quarter decrease was accounted for by a larger decrease in receipts than in payments.
Profits before tax increased $114.4 billion in the second quarter, compared with an increase of $186.4 billion in the first. The before-tax measure of profits does not reflect, as does profits from current production, the capital consumption and inventory valuation adjustments. These adjustments convert depreciation of fixed assets and inventory withdrawals reported on a tax-return, historical-cost basis to the current-cost measures used in the national income and product accounts. The capital consumption adjustment increased $16.1 billion in the second quarter (from -$144.9 billion to -$128.8 billion), in contrast to a decrease of $69.3 billion in the first. The inventory valuation adjustment decreased $62.9 billion (from $81.1 billion to $18.2 billion), compared with a decrease of $58.1 billion.
Pre-market - 8:00am
Futures mixed, but flat as of 7:30 this morning waiting on Jobless claims and GDP numbers.
DJIA INDEX 9,530.00 4.00
S&P 500 1,026.70 -0.10
NASDAQ 100 1,636.50 0.00
Today's economic calendar:
GDP 8:30 AM ET
Jobless Claims 8:30 AM ET
Corporate Profits 8:30 AM ET
EIA Natural Gas Report 10:30 AM ET
3-Month Bill Announcement 11:00 AM ET
6-Month Bill Announcement 11:00 AM ET
7-Yr Note Auction 1:00 PM ET
Money Supply 4:30 PM ET
Today's earnings reports:
Before open;
AEO American Eagle Outfitters, Inc. Services Apparel Stores
APWR A-Power Energy Generation Systems, Ltd. Utilities Electric Utilities
CONN Conns Inc. Services Electronics Stores
CSUN China Sunergy Co. Ltd. Technology Semiconductor - Integrated Circuits
DLIA dELiA*s, Inc. Services Catalog & Mail Order Houses
ENER Energy Conversion Devices, Inc. Technology Semiconductor - Specialized
FRED Fred's Inc. Services Discount, Variety Stores
GCO Genesco Inc. Services Apparel Stores
GRB Gerber Scientific Inc. Industrial Goods Diversified Machinery
HURN Huron Consulting Group Inc. Services Management Services
LB LaBarge Inc. Technology Scientific & Technical Instruments
NOVN Noven Pharmaceuticals Inc. Healthcare Drug Delivery
OSIS OSI Systems, Inc. Technology Semiconductor Equipment & Materials
RY Royal Bank of Canada Financial Money Center Banks
SCVL Shoe Carnival Inc. Services Apparel Stores
TD Toronto-Dominion Bank Financial Money Center Banks
TK Teekay Corporation Services Shipping
TOL Toll Brothers Inc. Industrial Goods Residential Construction
VIP Vimpel-Communications Technology Wireless Communications
After close;
ARUN Aruba Networks, Inc. Technology Computer Peripherals
BEBE Bebe Stores, Inc. Services Apparel Stores
CLCT Collectors Universe Inc. Services Business Services
CPWM Cost Plus Inc. Services Department Stores
DELL Dell Inc. Technology Personal Computers
DLLR Dollar Financial Corp. Financial Credit Services
FCEL FuelCell Energy Inc. Industrial Goods Industrial Electrical Equipment
IMMR Immersion Corporation Technology Computer Peripherals
JCG J. Crew Group, Inc. Services Apparel Stores
LAVA Magma Design Automation Inc. Technology Business Software & Services
MCRS MICROS Systems, Inc. Technology Technical & System Software
MRVL Marvell Technology Group Ltd. Technology Semiconductor - Integrated Circuits
NCTY The9 Limited Services Gaming Activities
NOVL Novell Inc. Technology Security Software & Services
NZ Netezza Corporation Technology Diversified Computer Systems
OVTI OmniVision Technologies Inc. Technology Semiconductor
RBI Sport Supply Group, Inc Services Catalog & Mail Order Houses
SB Safe Bulkers, Inc. Services Shipping
SHI Sinopec Shanghai Petrochemical Co. Ltd. Basic Materials Synthetics
SLH Solera Holdings Inc. Technology Business Software & Services
TBAC Tandy Brands Accessories Inc. Consumer Goods Textile - Apparel
TLVT Telvent Git S.A. Technology Computer Based Systems
UEPS Net 1 Ueps Technologies Inc. Services Business Services
XETA XETA Technologies Inc. Technology Communication Equipment
Wednesday, August 26, 2009
Market wrap - 4:40pm
A pretty boring day on the street, one might say. Even with "better than expected" (debatable) new home sales numbers, the market didn't do much other than go sideways on low volume.
Dow 9,543.52 +4.23 (0.04%)
S&P 500 1,028.12 +0.12 (0.01%)
Nasdaq 2,024.43 +0.20 (0.01%)
Gold 946 -0 -0.02%
Oil 71.44 -0.62 -0.86%
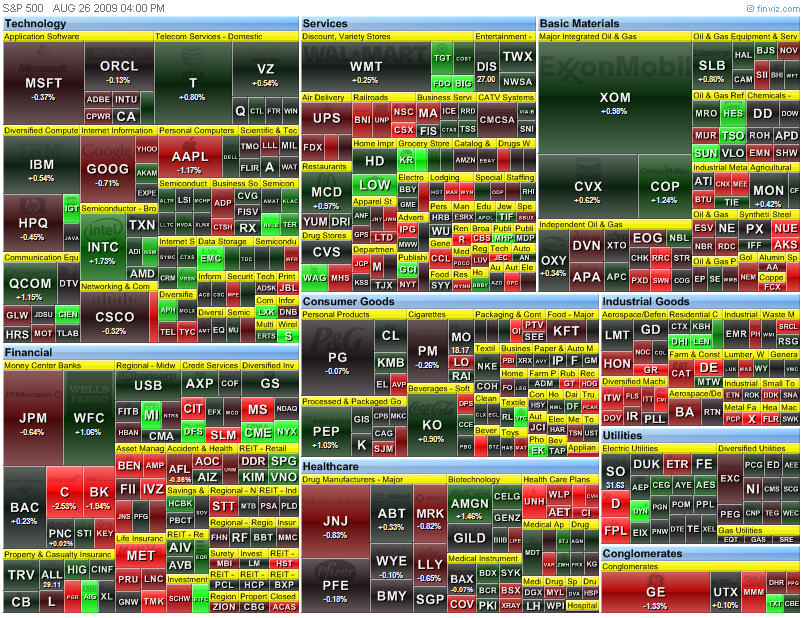
Today by sector:
 Today's heatmap:
Today's heatmap:

New home sales - 10:00am
Full report here
NEW RESIDENTIAL SALES IN JULY 2009
Sales of new one-family houses in July 2009 were at a seasonally adjusted annual rate of 433,000, according to estimates released jointly today by the U.S. Census Bureau and the Department of Housing and Urban Development. This is 9.6 percent (±13.4%)* above the revised June rate of 395,000, but is 13.4 percent (±12.9%) below the July 2008 estimate of 500,000.
The median sales price of new houses sold in July 2009 was $210,100; the average sales price was $269,200. The seasonally adjusted estimate of new houses for sale at the end of July was 271,000. This represents a supply of 7.5 months at the current sales rate.
Much more at link
Durable goods - 8:30am
Full report here
Summary
New orders for manufactured goods in June, up four of the last five months, increased $1.4 billion or 0.4 percent to $349.0 billion, the U.S. Census Bureau reported today. This followed a 1.1 percent May increase. Excluding transportation, new orders increased 2.3 percent.
Shipments, up following ten consecutive monthly decreases, increased $4.9 billion or 1.4 percent to $358.3 billion. This followed a 0.8 percent May decrease. Unfilled orders, down nine consecutive months, decreased $6.5 billion or 0.9 percent to $740.2 billion. This was the longest streak of consecutive monthly decreases since November 2001-July 2002. This followed a 0.3 percent May decrease. The unfilled orders-to-shipments ratio was 6.04, down from 6.15 in May.
Inventories, down ten consecutive months, decreased $4.2 billion or 0.8 percent to $508.3 billion. This was the longest streak of consecutive monthly decreases since March 2003-January 2004 and followed a 0.8 percent May decrease. The inventories-to-shipments ratio was 1.42, down from 1.45 in May.
New Orders
New orders for manufactured durable goods in June, down following two consecutive monthly increases, decreased $3.6 billion or 2.2 percent to $159.1 billion, revised from the previously published 2.5 percent decrease. This followed a 1.3 percent May increase.
Transportation equipment, down following two consecutive monthly increases, had the largest decrease, $5.5 billion or 13.2 percent to $36.4 billion. New orders for manufactured nondurable goods increased $5.0 billion or 2.7 percent to $190.0 billion.
Shipments
Shipments of manufactured durable goods in June, down eleven consecutive months, decreased $0.1 billion or 0.1 percent to $168.3 billion, revised from the previously published 0.2 percent decrease. This also was the longest streak of consecutive monthly decreases since the series was first published on a NAICS basis in 1992 and followed a 2.7 percent May decrease. Computers and electronic products, down five of the last six months, had the largest decrease, $0.4 billion or 1.6 percent to $27.3 billion.
Shipments of manufactured nondurable goods, up two consecutive months, increased $5.0 billion or 2.7 percent to $190.0 billion. This followed a 0.9 percent May increase. This increase was led by petroleum and coal products, which increased $4.3 billion or 13.2 percent to $37.1 billion. This was the largest increase in petroleum and coal products since November 2007.
Unfilled Orders
Unfilled orders for manufactured durable goods in June, down nine consecutive months, decreased $6.5 billion or 0.9 percent to $740.2 billion, unchanged from the previously published decrease. This followed a 0.3 percent May decrease. Transportation equipment, down nine consecutive months, had the largest decrease, $6.0 billion or 1.4 percent to $433.3 billion.
Inventories
Inventories of manufactured durable goods in June, down six consecutive months, decreased $3.8 billion or 1.2 percent to $317.8 billion, revised from the previously published 0.9 percent decrease. This followed a 1.2 percent May decrease.
Computers and electronic products, down six consecutive months, had the largest decrease, $1.2 billion or 2.5 percent to $44.4 billion.
Inventories of manufactured nondurable goods, down ten consecutive months, decreased $0.4 billion or 0.2 percent to $190.6 billion. This followed a 0.1 percent May decrease. Chemical products drove the decrease, down $0.7 billion or 1.2 percent to $63.1 billion.
By stage of abrication, June materials and supplies decreased 1.3 percent in durable goods and increased 0.4 percent in nondurable goods. Work in process decreased 0.6 percent in durable goods and 0.8 percent in nondurable goods. Finished goods decreased 1.9 percent in durable goods and 0.4 percent in nondurable goods.
More at link with tables included
More at link with tables included
Pre-market - August 26, 2009
Futures down a little at 7:40am this morning.
DJIA INDEX 9,511.00 -12.00
S&P 500 1,024.30 -1.80
NASDAQ 100 1,636.50 0.00
Today's economic calendar:
Durable Goods Orders 8:30 AM ET
New Home Sales 10:00 AM ET
EIA Petroleum Status Report 10:30 AM ET
5-Yr Note Auction 1:00 PM ET
Today's earnings reports:
Before open:
BWS Brown Shoe Co. Inc. Consumer Goods Textile - Apparel Footwear & Accessories
CCUR Concurrent Computer Corporation Technology Computer Based Systems
CHRS Charming Shoppes Inc. Services Apparel Stores
DLTR Dollar Tree Inc. Services Discount, Variety Stores
DSW DSW Inc. Services Apparel Stores
ISLE Isle of Capri Casinos Inc. Services Resorts & Casinos
IVR Invesco Mortgage Capital Inc. Financial Mortgage Investment
KIRK Kirkland's Inc. Services Home Furnishing Stores
NWY New York & Company Inc. Services Apparel Stores
WSM Williams-Sonoma Inc. Services Home Furnishing Stores
After close:
ANGN Angeion Corp. Healthcare Medical Instruments & Supplies
CWTR Coldwater Creek Inc. Services Specialty Retail, Other
GES Guess? Inc. Services Apparel Stores
HEI HEICO Corp. Industrial Goods Aerospace/Defense Products & Services
JAS Jo-Ann Stores Inc. Services Specialty Retail, Other
PSJ PowerShares Dynamic Software Financial Exchange Traded Fund
SIGM Sigma Designs Inc. Technology Semiconductor - Specialized
SINA Sina Corp. Technology Internet Software & Services
SWS SWS Group Inc. Financial Investment Brokerage - Regional
TIVO TiVo Inc. Services CATV Systems
Tuesday, August 25, 2009
Market wrap - 4:55pm
The S&P ramped up at the open, gave back most after the 10:00 reports, only to rally back within a point of the day's high at 12:30. For the rest of the day it gave back most of it's gains, even dipping into the red at 2:45.
Dow 9,539.29 +30.01 (0.32%)
S&P 500 1,028.00 +2.43 (0.24%)
Nasdaq 2,024.23 +6.25 (0.31%)
Gold 946 +2 +0.24%
Oil 71.39 -2.32 -3.15%
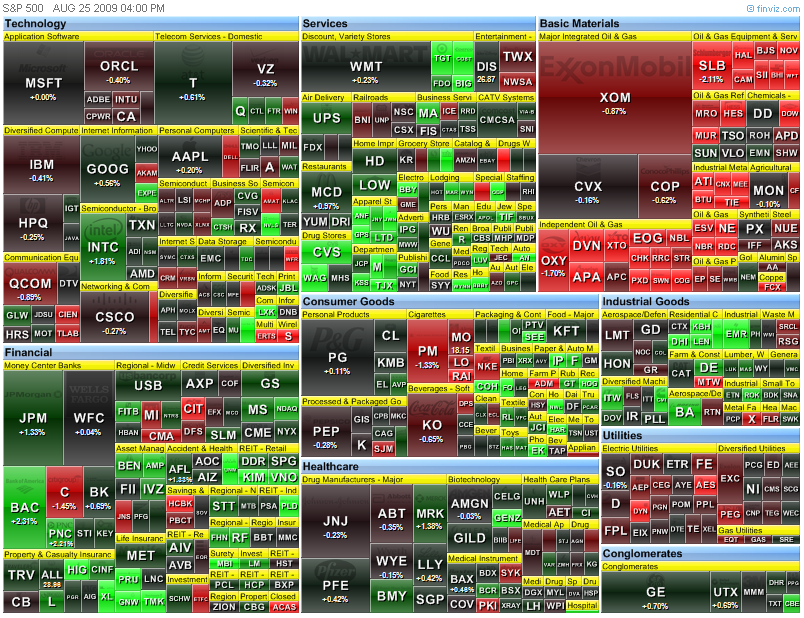
Today by sector:
 Today's heatmap:
Today's heatmap:
FHFA Housing report - 10:20am
Full report here
FEDERAL HOUSING FINANCE AGENCY NEWS RELEASE
For Immediate Release Contact: Corinne Russell (202) 414-6921
August 25, 2009 Stefanie Mullin (202) 414-6376
Home Prices Decline Slightly in Second Quarter
WASHINGTON, DC – U.S. home prices fell 0.7 percent in the second quarter of 2009 from
the first quarter of 2009, according to the Federal Housing Finance Agency’s (FHFA)
seasonally-adjusted purchase-only house price index (HPI). This decline is slightly larger than the o.5 percent decline in the prior quarterly period. Over the year ending in the second quarter of 2009, seasonally-adjusted prices fell 6.1 percent.
The HPI is calculated using home sales price information from Fannie Mae- and Freddie Mac-acquired mortgages. The quarterly report analyzing housing price appreciation trends was released today by FHFA Senior Deputy Director and Chief Operating Officer Edward J. DeMarco.
The seasonally-adjusted monthly index for June rose 0.5 percent following a revised increase of 0.6 percent in May, but these gains did not fully offset earlier declines affecting the quarterly result. The monthly index has risen a net 0.5 percent over the first six months of this year.
“For the second consecutive quarter we are seeing much slower rates of depreciation in the HPI than in 2008,” said DeMarco. “This is further evidence that prices may be stabilizing for the nation as a whole.” While the national, purchase-only house price index fell 6.1 percent from the second quarter of 2008 to the second quarter of 2009, prices of other goods and services fell 2.4 percent.
Accordingly, the inflation-adjusted price of homes fell approximately 3.8 percent over the latest year. FHFA’s all-transactions house price index, which include data from mortgages used for both home purchases and refinancings, declined more over the latest quarter than the purchase-only index. The all-transactions HPI decreased 2.4 percent in the latest quarter but was down only 4.0 percent over the four-quarter period.
Significant Findings:
As estimated in FHFA’s seasonally-adjusted, purchase-only indexes, six of the
nine Census Divisions experienced price declines in the latest quarter.
Prices were weakest in the New England Division, which experienced a 1.6 percent
price decline in the quarter and strongest in the West South Central Division,
which saw a price increase of 0.2 percent.
Seasonally-adjusted, purchase-only indexes indicate that prices fell in the latest
quarter in 38 states. Prices fell over the last year in 46 states and Washington,
D.C.
1
In terms of four-quarter appreciation rates, 37 states and Washington, D.C. are
ranked above the national average and only 13 are below average.
Of the recently released purchase-only indexes for the 25 most-populated
metropolitan areas in the U.S., four-quarter price declines were greatest in the
Miami-Miami Beach-Kendall, FL Metropolitan Division. That area saw price
declines of 28.2 percent from the second quarter of 2008.
Prices held up best in the Houston-Sugar Land-Baytown, TX Metropolitan Area,
where prices rose 2.9 percent over that period.
The complete list of state appreciation rates is on pages 10 and 11. The complete list of metropolitan area appreciation rates computed in a purchase-only series is on page 23 and on pages 26-39 for all-transactions indexes.
Much more at link
Office of Management and Budget - Midseason review - 10:20am
Released today from the Office of Management and Budget
Tuesday, August 25th, 2009 at 9:30 am
Mid-Session Review
Peter R. Orszag, Director
Today, OMB released the Mid-Session Review (MSR) which updates the Administration’s economic forecast, last done in February, and its budget projections.
The MSR shows a smaller 2009 deficit but larger out-year deficits than previously projected. Overall, it underscores the dire fiscal situation that we inherited and the need for serious steps to put our nation back on a sustainable fiscal path.
First, let’s consider this year’s deficit. We now expect that the policies put in place to repair the financial system are likely to cost taxpayers less than previously anticipated. In particular, we have decided to remove from the budget a placeholder for further financial stabilization efforts that seemed prudent earlier this year. And we have lowered our estimate of the expected costs of FDIC bank rescues.
The net result is a $262 billion improvement in the projected 2009 deficit. The 2009 deficit is now projected to be $1.58 trillion – or 11.2 percent of GDP – down from a previously projected $1.84 trillion or 12.9 percent of GDP.
Second, with regard to the out-year deficits, the changes are primarily driven by changes in our economic assumptions. In line with the current consensus among professional forecasters, the Administration’s economic projections show that we inherited a deeper recession than projected in February. These revisions are based on new data on the severity of the recession that weren’t available last winter.
As a result of a deeper-than-expected recession, certain spending programs (such as unemployment insurance and food stamps) are projected to automatically increase and revenues are projected to automatically decline, compared to our previous projection. Although these effects help to ameliorate the economic downturn by stimulating demand, they also lead to higher medium-term deficits both directly and indirectly (through higher interest costs on a higher level of public debt). Over the next 10 years, the net impact is to add $2 trillion to the projected deficit, compared to our last projection made based on February’s economic assumptions. That brings the projected 10-year deficit for 2010-2019 to $9.05 trillion – in line with CBO’s June projection.
It is worth noting, however, that by 2019, the difference between non-interest spending and revenue, which is also known as the "primary deficit," is only 0.6 percent of GDP. Interest payments, which almost entirely represent the cost of the debt accumulated due to the policies of past administrations and the need to run short-run deficits to help the economy recover from the worst downturn since the Great Depression, are 3.4 percent of GDP.
During an economic downturn, one wants to allow the deficit to increase, so deficit reduction should be focused on the out-years – after the economy has recovered. That said, the out-year deficits hover in the range of 4 percent of GDP, which is higher than desirable. Getting the out-year deficit under control is a top priority of the Administration.
We are in the midst of the policy process surrounding the FY 2011 budget, and that process will include proposals to put the nation back on a fiscally sustainable path. In the meantime, we have to stop making these longer-term deficits worse – which is why the Administration supports statutory pay-as-you-go legislation, so that any new tax or entitlement initiatives are fully paid for. (If pay-go rules had been followed over the past eight years, the projected deficit would be $5 trillion lower over the next decade.)
In addition to avoiding making the problem any worse, we need to address the key driver of our long-term deficits: health care costs. The federal government simply cannot be put on a fiscally sustainable path without slowing the rate of health care cost growth in the long run. That is why the Administration is insistent that health care reform not only be deficit neutral over the next ten years, but also incorporate changes that will help reduce the deficit thereafter.
There’s no doubt that additional steps will be necessary to reduce our out-year deficits (including continuing our effort to reduce spending and reform government contracting), and the Administration will have more to say about all that as part of the FY 2011 Budget.
On inauguration day, the Administration inherited the greatest economic crisis and the largest deficits since the end of World War II. The economic freefall has been arrested, and, while too many people remain out of work, the consensus among private forecasters is that the economy will return to positive growth in the second half of this year. As the economy recovers, the Administration is committed to putting the nation on a fiscally sustainable path.
State Street Investor Confidence - 10:10am
Investor Confidence Index Rises from 119.4 to 122.9 in August
25/08/2009
Boston, August 25, 2009 – State Street Global Markets, the investment research and trading arm of State Street Corporation (NYSE:STT), today released the results of the State Street Investor Confidence Index® for August 2009.
Global Investor Confidence rose by 3.5 points to 122.9 from July’s level of 119.4. Looking across the regions, the confidence of North American institutional investors declined slightly by 2.2 points from 120.6 to 118.4, a decline echoed among Asian investors, whose confidence fell 2.3 points from 94.1 to 91.8. By contrast, European institutional investors displayed increased risk appetite, and their confidence benchmark rose 4.3 points to 109.2 from 104.9 last month.
Developed through State Street Global Markets’ research partnership, State Street Associates, by Harvard University professor Ken Froot and State Street Associates Director Paul O’Connell, the State Street Investor Confidence Index measures investor confidence on a quantitative basis by analyzing the actual buying and selling patterns of institutional investors. The index is based on financial theory that assigns precise meaning to changes in investor risk appetite, or the willingness of investors to allocate their portfolios to equities. The more of their portfolio that institutional investors are willing to devote to equities, the greater their risk appetite or confidence.
“This month’s increase represents the eighth consecutive improvement in Global Investor Confidence, and places the risk appetite of institutional investors firmly in the range that is associated with accumulation of risk exposures,” commented Froot. “At the same time, the rate of increase in the Index has moderated relative to some months ago, suggesting that institutions are being somewhat selective in their allocations.”
“This month we note some increased regional variation across the Indices,” added O’Connell. “While European institutional investors continued to ‘catch up’ with their North American counterparts, in terms of reallocating out of cash, North American and Asian institutions displayed some ambivalence about further reallocations, given trends over the last six months. Keeping in mind that a level of 100 denotes ‘neutral’ for the Index – the level at which investors are neither reducing nor increasing their allocations to risky assets – we can see European confidence remains somewhat below that of North American institutions, and that caution prevails in Asia.”
 Full report here
About State Street Global Markets
State Street Global Markets provides specialized investment research and trading in foreign exchange, equities, fixed income and derivatives. Its goal is to enhance and preserve portfolio values for asset managers and asset owners. From its unique position at the crossroads of the global markets, it creates and unlocks value for its clients with original flow-based research, innovative portfolio strategies, trade process optimization, and global connectivity across multiple asset classes and markets.
State Street Global Markets’ research team of leading academic and industry experts is committed to continually advancing the science, including theory and application of its proprietary investor behavior research and innovative portfolio & risk management technologies to help its clients challenge conventional thinking, shape ideas, make more informed investment decisions and deliver measurable results.
About the State Street Investor Confidence Index®
The index is released globally at 10 a.m. Eastern time in Boston on the last Tuesday of each month. More information on the State Street Investor Confidence Index is available at http://www.statestreet.com/investorconfidenceindex.
About State Street
State Street Corporation (NYSE: STT) is the world's leading provider of financial services to institutional investors including investment servicing, investment management and investment research and trading. With $16.4 trillion in assets under custody and administration and $1.6 trillion in assets under management at June 30, 2009, State Street operates in 27 countries and more than 100 geographic markets worldwide. For more information, visit State Street’s web site at www.statestreet.com.
Full report here
About State Street Global Markets
State Street Global Markets provides specialized investment research and trading in foreign exchange, equities, fixed income and derivatives. Its goal is to enhance and preserve portfolio values for asset managers and asset owners. From its unique position at the crossroads of the global markets, it creates and unlocks value for its clients with original flow-based research, innovative portfolio strategies, trade process optimization, and global connectivity across multiple asset classes and markets.
State Street Global Markets’ research team of leading academic and industry experts is committed to continually advancing the science, including theory and application of its proprietary investor behavior research and innovative portfolio & risk management technologies to help its clients challenge conventional thinking, shape ideas, make more informed investment decisions and deliver measurable results.
About the State Street Investor Confidence Index®
The index is released globally at 10 a.m. Eastern time in Boston on the last Tuesday of each month. More information on the State Street Investor Confidence Index is available at http://www.statestreet.com/investorconfidenceindex.
About State Street
State Street Corporation (NYSE: STT) is the world's leading provider of financial services to institutional investors including investment servicing, investment management and investment research and trading. With $16.4 trillion in assets under custody and administration and $1.6 trillion in assets under management at June 30, 2009, State Street operates in 27 countries and more than 100 geographic markets worldwide. For more information, visit State Street’s web site at www.statestreet.com.
Consumer Confidence Survey® Press Release - 10:00am
Full report here
THESE DATA ARE FOR ANALYSIS PURPOSES ONLY. NOT FOR REDISTRIBUTION, PUBLISHING, DATABASING, OR PUBLIC POSTING WITHOUT EXPRESS WRITTEN PERMISSION.
The Conference Board Consumer Confidence Index ® Bounces Back
August 25, 2009
The Conference Board Consumer Confidence Index ®, which had retreated in July, rebounded in August. The Index now stands at 54.1 (1985=100), up from 47.4 in July. The Present Situation Index increased slightly to 24.9 from 23.3 last month. The Expectations Index improved to 73.5 from 63.4 in July.
The Consumer Confidence Survey ® is based on a representative sample of 5,000 U.S. households. The monthly survey is conducted for The Conference Board by TNS. TNS is the world's largest custom research company. The cutoff date for August's preliminary results was August 18th.
Says Lynn Franco, Director of The Conference Board Consumer Research Center: "Consumer confidence, which had posted back-to-back monthly declines, appears to be back on the mend. The Present Situation Index increased slightly, mainly the result of an improvement in consumers' assessment of the job market. The Expectations Index improved considerably and is now at its highest level since December 2007 (Index, 75.8). Consumers were more upbeat in their short-term outlook for both the economy and the job market in August, but only slightly more upbeat in their income expectations. And, as long as earnings continue to weigh heavily on consumers' minds, spending is likely to remain constrained."
Consumers' assessment of current conditions improved slightly in August. Those claiming business conditions are "bad" decreased to 45.6 percent from 46.5 percent, however, those claiming conditions are "good" decreased to 8.6 percent from 8.9 percent. Consumers' appraisal of the job market was more favorable this month. Those saying jobs are "hard to get" decreased to 45.1 percent from 48.5 percent, while those claiming jobs are "plentiful" increased to 4.2 percent from 3.7 percent.
Consumers' short-term outlook was much improved from last month. Those expecting an improvement in business conditions over the next six months increased to 22.4 percent from 18.4 percent. Those anticipating conditions to worsen decreased to 15.8 percent from 19.0 percent.
The labor market outlook was also more upbeat. The percentage of consumers expecting more jobs in the months ahead increased to 18.4 percent from 15.5 percent, while those expecting fewer jobs decreased to 23.3 percent from 26.1 percent. The proportion of consumers expecting an increase in their incomes increased slightly to 10.6 percent from 10.1 percent.
For further information contact:
Lynn Franco
at +1 212 339 0344
lynn.franco@conference-board.org
Case-Shiller Home Price Index - 9:10am
Home Prices on an Upswing in the Second Quarter of 2009 According to the S&P/Case-Shiller Home Price Indices
New York, August 25, 2009 – Data through June 2009, released today by Standard & Poor’s for its S&P/Case-Shiller1 Home Price Indices, the leading measure of U.S. home prices, show that the U.S. National Home Price Index improved in the second quarter of 2009.
 Full report here
The chart above depicts the annual returns of the U.S. National, the 10-City Composite and the 20-City Composite Home Price Indices. The S&P/Case-Shiller U.S. National Home Price Index – which covers all nine U.S. census divisions – recorded a 14.9% decline in the 2nd quarter of 2009 versus the 2nd quarter of 2008. While still a substantial negative annual rate of return, this is an improvement over the record decline of 19.1% reported in the 1st quarter of the year. The 10-City and 20-City Composites recorded annual declines of 15.1% and 15.4%, respectively. These are also improvements from their recent respective record losses of -19.4% and -19.1%.
“For the second month in a row, we’re seeing some positive signs,” says David M. Blitzer, Chairman of the Index Committee at Standard & Poor’s. “The U.S. National Composite rose in the 2nd quarter compared to the 1st quarter of 2009. This is the first time we have seen a positive quarter-over-quarter print in three years. Both the 10-City and 20-City Composites posted monthly increases, as did most of the cities. As seen in both seasonally adjusted and unadjusted data, as well as the charts, there are hints of an upward turn from a bottom. However, some of the hardest hit cities, especially in the Sun Belt, show continued weakness.”
More at link with more charts
Full report here
The chart above depicts the annual returns of the U.S. National, the 10-City Composite and the 20-City Composite Home Price Indices. The S&P/Case-Shiller U.S. National Home Price Index – which covers all nine U.S. census divisions – recorded a 14.9% decline in the 2nd quarter of 2009 versus the 2nd quarter of 2008. While still a substantial negative annual rate of return, this is an improvement over the record decline of 19.1% reported in the 1st quarter of the year. The 10-City and 20-City Composites recorded annual declines of 15.1% and 15.4%, respectively. These are also improvements from their recent respective record losses of -19.4% and -19.1%.
“For the second month in a row, we’re seeing some positive signs,” says David M. Blitzer, Chairman of the Index Committee at Standard & Poor’s. “The U.S. National Composite rose in the 2nd quarter compared to the 1st quarter of 2009. This is the first time we have seen a positive quarter-over-quarter print in three years. Both the 10-City and 20-City Composites posted monthly increases, as did most of the cities. As seen in both seasonally adjusted and unadjusted data, as well as the charts, there are hints of an upward turn from a bottom. However, some of the hardest hit cities, especially in the Sun Belt, show continued weakness.”
More at link with more charts
Pre-market - August 23, 2009
Futures up a little this morning after news of a Bernanke re-appointment:
DJIA INDEX 9,522.00 29.00
S&P 500 1,027.50 3.00
NASDAQ 100 1,637.75
Today's economic calendar:
Redbook 8:55 AM ET
S&P Case-Shiller HPI 9:00 AM ET
Consumer Confidence 10:00 AM ET
State Street Investor Confidence Index 10:00 AM ET
4-Week Bill Auction 11:30 AM ET
52-Week Bill Auction 1:00 PM ET
2-Yr Note Auction 1:00 PM ET
Today's earnings reports:
Before market opens
AMWD American Woodmark Corp. Industrial Goods Lumber, Wood Production
BGP Borders Group, Inc. Services Specialty Retail, Other
BIG Big Lots Inc. Services Discount, Variety Stores
BKC Burger King Holdings Inc. Services Restaurants
CHS Chico's FAS Inc. Services Apparel Stores
CMRG Casual Male Retail Group, Inc. Services Apparel Stores
COCO Corinthian Colleges Inc. Services Education & Training Services
DAKT Daktronics Inc. Industrial Goods Industrial Electrical Equipment
GIGM GigaMedia Ltd. Technology Internet Software & Services
JAVA Sun Microsystems Inc. Technology Diversified Computer Systems
MDT Medtronic, Inc. Healthcare Medical Appliances & Equipment
RAIL FreightCar America Inc. Services Railroads
RTLX Retalix Ltd. Technology Application Software
SAFM Sanderson Farms Inc. Consumer Goods Meat Products
SPLS Staples, Inc. Services Specialty Retail, Other
TUES Tuesday Morning Corp. Services Discount, Variety Stores
After market closes
APSG Applied Signal Technology, Inc. Technology Communication Equipment
BCSI Blue Coat Systems Inc. Technology Business Software & Services
DY Dycom Industries Inc. Industrial Goods Heavy Construction
HAIN The Hain Celestial Group, Inc. Consumer Goods Processed & Packaged Goods
IRF International Rectifier Corporation Technology Semiconductor
LIHR Lihir Gold Ltd. Basic Materials Gold
LTON Linktone Ltd. Technology Wireless Communications
MYGN Myriad Genetics Inc. Healthcare Diagnostic Substances
Monday, August 24, 2009
FED website and interactive map of financial problems - nice - 11:55am
Full interactive map here of credit conditions in the US. Nice. Have to give the FED credit for this.
An example:


One of the better interviews I have seen on health insurance - 11:30am
Good interview, and a smart guy asking the questions - Thank you Mark Haines;
Pre-market -- August 24, 2009
Futures up slightly this morning after some good overnight action in foreign markets:
DJIA INDEX 9,527.00 38.00
S&P 500 1,029.00 3.80 1,024.50
NASDAQ 100 1,638.75 3.25
Today's economic calendar:
4-Week Bill Announcement 11:00 AM ET
3-Month Bill Auction 1:00 PM ET
6-Month Bill Auction 1:00 PM ET
Today's earnings reports:
Before open;
NPD China Nepstar Chain Drugstore Ltd. Services Drug Stores
PCAP Patriot Capital Funding, Inc. Financial Closed-End Fund - Debt
After close;
ARAY Accuray Incorporated Healthcare Medical Appliances & Equipment
WINN Winn-Dixie Stores Inc. Services Grocery Stores
Subscribe to:
Comments (Atom)
