Full report here
Prepared at the Federal Reserve Bank of New York and based on information collected on or before November 20, 2009. This document summarizes comments received from businesses and other contacts outside the Federal Reserve and is not a commentary on the views of Federal Reserve officials.
Reports from the twelve Federal Reserve Districts indicate that economic conditions have generally improved modestly since the last report. Eight Districts indicated some pickup in activity or improvement in conditions, while the remaining four--Philadelphia, Cleveland, Richmond, and Atlanta--reported that conditions were little changed and/or mixed.
Consumer spending was reported to have picked up moderately since the last report, for both general merchandise and vehicles; a number of Districts noted relatively robust sales of used autos. Most Districts indicated that non-auto retailers were holding lean inventories going into the holiday season. Tourism activity varied across Districts. Manufacturing conditions were said to be, on balance, steady to moderately improving across most of the country, while conditions in the nonfinancial service sector generally strengthened somewhat, though with some variation across Districts and across industries. Residential real estate conditions were somewhat improved from very low levels, on balance, led by the lower end of the market. Most Districts reported some pickup in home sales, though prices were generally said to be flat or declining modestly; residential construction was characterized as weak, but some Districts did note some pickup in activity. Commercial real estate markets and construction activity were depicted as very weak and, in many cases, deteriorating.
Financial institutions generally reported steady to weaker loan demand, continued tight credit standards, and steady or deteriorating loan quality. In the agricultural sector, the fall harvest was delayed in the eastern half of the nation due to excessively wet conditions during October and early November. Most energy-producing Districts noted a slight uptick in activity in the sector since the last report. Labor market conditions remained weak since the last report, though there were signs of stabilization and scattered signs of improvement. While some Districts reported upward pressure on commodity prices, they saw little or no indication of upward wage pressures or of any significant increase in prices of finished goods.
Consumer Spending and Tourism
Consumer spending strengthened since the last report, with sales of both general merchandise and autos improving across much of the country. Non-auto sales were reported to have picked up in the New York, Philadelphia, Cleveland, Richmond, Atlanta, Kansas City, and San Francisco Districts; sales were described as steady or mixed in the Boston, Chicago, Minneapolis, and Dallas Districts. St. Louis described retail sales as below expectations and down from a year earlier. Auto sales generally improved since the last report, in some cases rebounding from a brief dip after the "cash-for-clunkers" program ended. Increased vehicle sales were reported from New York, Philadelphia, Richmond, Chicago, St. Louis, and Dallas, while sales were described as flat or mixed in the Cleveland, Minneapolis, Kansas City, and San Francisco Districts. A number of Districts reported that used vehicles have been selling better than new ones.
Most Districts also noted that retailers were holding leaner inventories this holiday season, though some indicate that retailers have recently become more optimistic about the holiday-season outlook. Auto dealers' inventories, largely depleted during the cash-for-clunkers program, have been or are being rebuilt.
Tourism was mixed across those Districts reporting. Travel and tourism--especially leisure travel--was described as robust or improved in the New York, Dallas, and San Francisco Districts. Atlanta and Kansas City characterized tourism as sluggish, while Richmond and Minneapolis described it as mixed; Richmond noted that tourism has been adversely affected by severe and damaging coastal storms, while Kansas City characterized the outlook as "grim." New York indicated that business travel remained sluggish, but Minneapolis and Dallas note a slight pickup.
Nonfinancial Services
Activity in the service sector generally picked up since the last report, though results were mixed across Districts and across service industries. New York and Philadelphia reported that service-sector activity overall remained steady to up slightly, while St. Louis noted expanding activity. The information technology industry was reported to be showing improvement in the Boston, Minneapolis, and Kansas City Districts. A pickup in activity at staffing firms was reported by Boston and Dallas, whereas New York noted that activity remained sluggish. Strength in health services was noted in the Boston and Richmond Districts. Shipping activity was characterized as flat in the Cleveland, Atlanta, and Kansas City District, while Dallas reports some gain; however, Dallas and Atlanta both noted particular weakness in rail shipping activity. Professional and business support firms reportedly registered some improvement in the St. Louis and Minneapolis Districts but flat to declining activity in Richmond and San Francisco.
Manufacturing
Most Districts reported mixed to moderately improving manufacturing conditions since the last report. New York, Philadelphia, Cleveland, Minneapolis, Kansas City, and San Francisco all noted modest increases in manufacturing activity within their Districts. Manufacturing conditions in the Boston and Dallas Districts were characterized as mixed, with some improvement noted for biopharmaceuticals companies in Boston and high-tech manufacturing firms in Dallas. By contrast, Richmond and Chicago both reported that manufacturing activity had leveled off since the last report, while activity continued to decline in the Atlanta and St. Louis Districts, although at a somewhat slower pace than the last report. Tighter credit limited the ability of customers to place new orders in the Richmond District, while in the Chicago District, contacts noted a slowdown in the restocking of inventories. Increases in activity related to the transportation industry were cited in the Chicago, St. Louis, Cleveland, and Kansas City Districts, although such activity was mixed in the Dallas District and reported as declining in the San Francisco District. Several Districts noted an uptick in food-related production.
Many Districts reported that their contacts were optimistic about the near-term outlook. Manufacturers in the Boston, New York, Philadelphia, Atlanta, Minneapolis, and Kansas City Districts expected business conditions to improve in the coming months, while producers in the Cleveland District expressed uncertainty about near-term conditions. The outlook in the Dallas District was mixed, with most manufacturers expressing cautious optimism about the near term and construction-related manufacturers expressing pessimism about the future largely due to expectations of prolonged weakness in commercial real estate.
Real Estate and Construction
Home sales and construction activity improved across much of the nation, though prices were generally said to be flat or still declining somewhat. A majority of Districts reported that the lower-priced segment of the housing market has outperformed the high end. Increases in sales activity were reported in the Boston, Cleveland, Richmond, Atlanta, Chicago, Minneapolis, Kansas City, Dallas, and San Francisco Districts, whereas sales were described as steady or mixed in the New York and Philadelphia Districts. Multifamily housing markets deteriorated further in the New York and Chicago Districts. More broadly, a number of eastern Districts reported continued declines in home prices--specifically, Boston, New York, Philadelphia, and Richmond. In contrast, prices were said to have firmed somewhat in the Dallas and San Francisco Districts and stabilized in the Chicago and Kansas City Districts. Most reports maintained that the lower end of the market has outperformed the higher end: New York, Philadelphia, Richmond, Atlanta, Minneapolis, and Kansas City all noted relative weakness at the high end of the market, with relative strength at the lower end; in most cases, this strength was largely attributed to the homebuyer tax credit (which was recently reinstated and expanded to include existing owners).
Despite the firming in sales, the level of new residential construction activity was generally characterized as weak, though recent trends have been mixed--Atlanta, Kansas City, and Dallas noted some pickup in home construction, whereas the Chicago and St. Louis Districts reported declines. Residential construction was described as flat or stabilizing by Cleveland, Minneapolis, and San Francisco.
Commercial real estate conditions were widely characterized as weak and, in many cases, deteriorating further. Market conditions were reported to have weakened in virtually all Districts, with rising vacancy rates, downward pressure on rents, and little, if any, new development. Expectations for 2010 were also quite low. Boston characterized the commercial real estate outlook as "bleak," Dallas noted that construction was at "historically low levels," and Kansas City described the sector as "distressed." Still, some Districts noted scattered signs of encouragement: Cleveland and Chicago referenced public-works projects as a source of increased business, Richmond noted signs of increased leasing activity from the health and education sectors, Atlanta indicated a modest pickup in new development projects, Minneapolis noted some recently started hotel and retail development, and San Francisco cited slight improvement in availability of financing for new development.
Banking and Finance
Banks reported steady to softer conditions in most Districts. Loan demand was said to have weakened in the New York, Philadelphia, Cleveland, St. Louis, Kansas City, and Dallas Districts. New York noted particular weakness in demand for home mortgage loans, whereas Richmond and St. Louis reported this to be the strongest segment of late. For the most part, the weakness appears to have been concentrated in the commercial sector, though Boston and Chicago reported some pickup in commercial real estate lending--largely refinancing. Credit quality showed signs of deteriorating in the New York, Philadelphia, Dallas, and San Francisco Districts but was described as stable or mixed in Cleveland, Chicago, and Kansas City, with Chicago reporting some improvement outside of commercial real estate. Increasingly tight credit standards were reported in the New York, Richmond, Chicago, St. Louis, Dallas, and San Francisco--largely on commercial loans.
Agriculture and Natural Resources
Excessively wet conditions during October and early November were reported in a number of Districts. As a result, the fall harvest was delayed in many parts of the Richmond, Atlanta, Chicago, St. Louis, Minneapolis, and Kansas City Districts. Flooding from Tropical Storm Ida and a November "nor'easter" damaged crops and delayed planting throughout the Richmond District, and Virginia health officials closed fishing in all Chesapeake Bay tributaries and temporarily banned the harvesting of shellfish due to potential storm water contamination. By contrast, rainfall in the Dallas District helped alleviate drought conditions experienced in many parts of the region. Contacts in the Chicago, Minneapolis, and Kansas City Districts noted that corn and soybean prices rallied over the past month, although a wide variation in margins was expected for crop farms due to differences in input costs. Losses for livestock operations occurred in the Chicago and Kansas City Districts.
Most energy-producing Districts reported a slight uptick in activity in extraction industries since the last report. Contacts in the Cleveland, Atlanta, Dallas, Minneapolis, Kansas City, and San Francisco Districts noted steady to increasing oil and natural gas production within their regions, albeit from low levels of production observed earlier this year. Contacts in the Cleveland District also reported that a sharp decline in coal production had leveled out since the last report. In general, oil prices increased somewhat, while reports on the price of natural gas were mixed due in large part to differences in inventory levels across Districts. Mining activity in the Minneapolis District increased.
Employment, Wages, and Prices
Labor market conditions remained weak since the last report, with further layoffs, sluggish hiring, and high levels of unemployment in most Districts. However, contacts in the Atlanta, Cleveland, and Richmond Districts reported that the pace of job cuts generally slowed in their regions, and most contacts in the Dallas District reported stable employment levels. Despite generally weak employment conditions, some signs of improvement were noted. For example, contacts in Boston reported that they were beginning to hire and reverse pay cuts or freezes that were implemented earlier in the year, and contacts in the St. Louis District reported that the service sector had started to expand recently. Expectations for the holiday season were mixed across Districts, with contacts in the New York and Dallas Districts reporting lighter-than-normal seasonal hiring and/or increases in the hours of existing employees, as opposed to hiring temporary workers, to meet the seasonal demand. On the other hand, most retailers in the Richmond District have hired the usual number of seasonal workers this year.
Districts generally reported little or no upward wage pressures, while some Districts noted upward pressure in commodity prices, and most Districts reported stable selling prices. Wages were largely reported to be holding steady in the Boston, Cleveland, Richmond, Chicago, Minneapolis, Kansas City, Dallas, and San Francisco Districts. Most Districts reported stable prices overall, although some reported higher input prices, largely for energy and other commodities used in production, with a limited ability to raise selling prices. Prices were reported as moderately lower in the Kansas City District, and downward price pressures were cited for some professional services and intermodal transportation firms in the Dallas District. Some makers of food products and chemicals in the Philadelphia District reported raising prices, and the prices of computer memory chips continued to firm in the San Francisco District. Retailers in several Districts indicated that they have managed inventory levels in an effort to prevent the steep price discounting that occurred last year, however, some promotional price discounting is expected through the holiday season.


 * Non-Manufacturing ISM Report On Business® data is seasonally adjusted for Business Activity, New Orders, Prices and Employment. Manufacturing ISM Report On Business® data is seasonally adjusted for New Orders, Production, Employment, Supplier Deliveries and Inventories.
** Number of months moving in current direction.
COMMODITIES REPORTED UP / DOWN IN PRICE, and IN SHORT SUPPLY
Commodities Up in Price
Beef; Cheese (4); Diesel Fuel; #1 Diesel Fuel; #2 Diesel Fuel; Fuel (2); Gasoline; Laboratory Equipment; Masks [for TB/H1N1 use] (2); and Pharmacy Supplies.
Commodities Down in Price
Alloys (2); and Carbon Pipe.
Commodities in Short Supply
Masks [for TB/H1N1 use] (2) is the only commodity reported in short supply.
Note: The number of consecutive months the commodity is listed is indicated after each item.
* Non-Manufacturing ISM Report On Business® data is seasonally adjusted for Business Activity, New Orders, Prices and Employment. Manufacturing ISM Report On Business® data is seasonally adjusted for New Orders, Production, Employment, Supplier Deliveries and Inventories.
** Number of months moving in current direction.
COMMODITIES REPORTED UP / DOWN IN PRICE, and IN SHORT SUPPLY
Commodities Up in Price
Beef; Cheese (4); Diesel Fuel; #1 Diesel Fuel; #2 Diesel Fuel; Fuel (2); Gasoline; Laboratory Equipment; Masks [for TB/H1N1 use] (2); and Pharmacy Supplies.
Commodities Down in Price
Alloys (2); and Carbon Pipe.
Commodities in Short Supply
Masks [for TB/H1N1 use] (2) is the only commodity reported in short supply.
Note: The number of consecutive months the commodity is listed is indicated after each item.
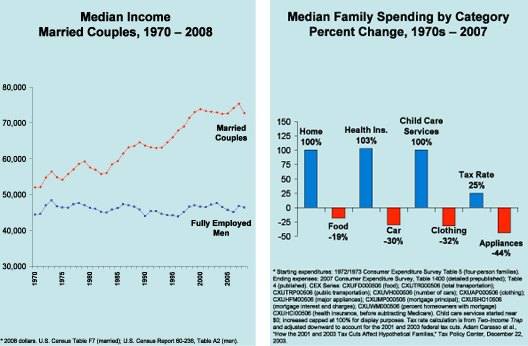
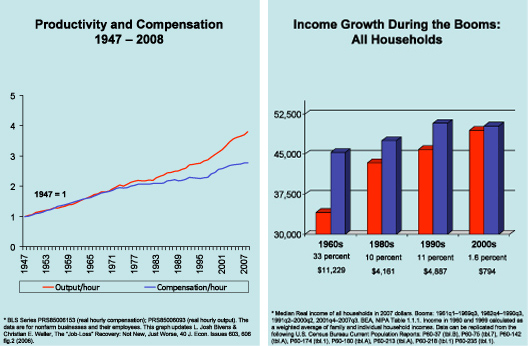 But core expenses kept going up. By the early 2000s, families were spending twice as much (adjusted for inflation) on mortgages than they did a generation ago -- for a house that was, on average, only ten percent bigger and 25 years older. They also had to pay twice as much to hang on to their health insurance.
To cope, millions of families put a second parent into the workforce. But higher housing and medical costs combined with new expenses for child care, the costs of a second car to get to work and higher taxes combined to squeeze families even harder. Even with two incomes, they tightened their belts. Families today spend less than they did a generation ago on food, clothing, furniture, appliances, and other flexible purchases -- but it hasn't been enough to save them. Today's families have spent all their income, have spent all their savings, and have gone into debt to pay for college, to cover serious medical problems, and just to stay afloat a little while longer.
But core expenses kept going up. By the early 2000s, families were spending twice as much (adjusted for inflation) on mortgages than they did a generation ago -- for a house that was, on average, only ten percent bigger and 25 years older. They also had to pay twice as much to hang on to their health insurance.
To cope, millions of families put a second parent into the workforce. But higher housing and medical costs combined with new expenses for child care, the costs of a second car to get to work and higher taxes combined to squeeze families even harder. Even with two incomes, they tightened their belts. Families today spend less than they did a generation ago on food, clothing, furniture, appliances, and other flexible purchases -- but it hasn't been enough to save them. Today's families have spent all their income, have spent all their savings, and have gone into debt to pay for college, to cover serious medical problems, and just to stay afloat a little while longer.
 Through it all, families never asked for a handout from anyone, especially Washington. They were left to go on their own, working harder, squeezing nickels, and taking care of themselves. But their economic boats have been taking on water for years, and now the crisis has swamped millions of middle class families.
The contrast with the big banks could not be sharper. While the middle class has been caught in an economic vise, the financial industry that was supposed to serve them has prospered at their expense. Consumer banking -- selling debt to middle class families -- has been a gold mine. Boring banking has given way to creative banking, and the industry has generated tens of billions of dollars annually in fees made possible by deceptive and dangerous terms buried in the fine print of opaque, incomprehensible, and largely unregulated contracts.
And when various forms of this creative banking triggered economic crisis, the banks went to Washington for a handout. All the while, top executives kept their jobs and retained their bonuses. Even though the tax dollars that supported the bailout came largely from middle class families -- from people already working hard to make ends meet -- the beneficiaries of those tax dollars are now lobbying Congress to preserve the rules that had let those huge banks feast off the middle class.
Pundits talk about "populist rage" as a way to trivialize the anger and fear coursing through the middle class. But they have it wrong. Families understand with crystalline clarity that the rules they have played by are not the same rules that govern Wall Street. They understand that no American family is "too big to fail." They recognize that business models have shifted and that big banks are pulling out all the stops to squeeze families and boost revenues. They understand that their economic security is under assault and that leaving consumer debt effectively unregulated does not work.
Families are ready for change. According to polls, large majorities of Americans have welcomed the Obama Administration's proposal for a new Consumer Financial Protection Agency (CFPA). The CFPA would be answerable to consumers -- not to banks and not to Wall Street. The agency would have the power to end tricks-and-traps pricing and to start leveling the playing field so that consumers have the tools they need to compare prices and manage their money. The response of the big banks has been to swing into action against the Agency, fighting with all their lobbying might to keep business-as-usual. They are pulling out all the stops to kill the agency before it is born. And if those practices crush millions more families, who cares -- so long as the profits stay high and the bonuses keep coming.
America today has plenty of rich and super-rich. But it has far more families who did all the right things, but who still have no real security. Going to college and finding a good job no longer guarantee economic safety. Paying for a child's education and setting aside enough for a decent retirement have become distant dreams. Tens of millions of once-secure middle class families now live paycheck to paycheck, watching as their debts pile up and worrying about whether a pink slip or a bad diagnosis will send them hurtling over an economic cliff.
America without a strong middle class? Unthinkable, but the once-solid foundation is shaking.
Elizabeth Warren is the Leo Gottlieb Professor of Law at Harvard and is currently the Chair of the Congressional Oversight Panel.
Through it all, families never asked for a handout from anyone, especially Washington. They were left to go on their own, working harder, squeezing nickels, and taking care of themselves. But their economic boats have been taking on water for years, and now the crisis has swamped millions of middle class families.
The contrast with the big banks could not be sharper. While the middle class has been caught in an economic vise, the financial industry that was supposed to serve them has prospered at their expense. Consumer banking -- selling debt to middle class families -- has been a gold mine. Boring banking has given way to creative banking, and the industry has generated tens of billions of dollars annually in fees made possible by deceptive and dangerous terms buried in the fine print of opaque, incomprehensible, and largely unregulated contracts.
And when various forms of this creative banking triggered economic crisis, the banks went to Washington for a handout. All the while, top executives kept their jobs and retained their bonuses. Even though the tax dollars that supported the bailout came largely from middle class families -- from people already working hard to make ends meet -- the beneficiaries of those tax dollars are now lobbying Congress to preserve the rules that had let those huge banks feast off the middle class.
Pundits talk about "populist rage" as a way to trivialize the anger and fear coursing through the middle class. But they have it wrong. Families understand with crystalline clarity that the rules they have played by are not the same rules that govern Wall Street. They understand that no American family is "too big to fail." They recognize that business models have shifted and that big banks are pulling out all the stops to squeeze families and boost revenues. They understand that their economic security is under assault and that leaving consumer debt effectively unregulated does not work.
Families are ready for change. According to polls, large majorities of Americans have welcomed the Obama Administration's proposal for a new Consumer Financial Protection Agency (CFPA). The CFPA would be answerable to consumers -- not to banks and not to Wall Street. The agency would have the power to end tricks-and-traps pricing and to start leveling the playing field so that consumers have the tools they need to compare prices and manage their money. The response of the big banks has been to swing into action against the Agency, fighting with all their lobbying might to keep business-as-usual. They are pulling out all the stops to kill the agency before it is born. And if those practices crush millions more families, who cares -- so long as the profits stay high and the bonuses keep coming.
America today has plenty of rich and super-rich. But it has far more families who did all the right things, but who still have no real security. Going to college and finding a good job no longer guarantee economic safety. Paying for a child's education and setting aside enough for a decent retirement have become distant dreams. Tens of millions of once-secure middle class families now live paycheck to paycheck, watching as their debts pile up and worrying about whether a pink slip or a bad diagnosis will send them hurtling over an economic cliff.
America without a strong middle class? Unthinkable, but the once-solid foundation is shaking.
Elizabeth Warren is the Leo Gottlieb Professor of Law at Harvard and is currently the Chair of the Congressional Oversight Panel.


 COMMODITIES REPORTED UP/DOWN IN PRICE and IN SHORT SUPPLY
Commodities Up in Price
Aluminum (5); Copper (6); Copper Based Products (5); Natural Gas (2); Oil; and Steel (5).
Commodities Down in Price
No commodities are reported down in price.
Commodities in Short Supply
Electronic Components is the only commodity reported in short supply.
Note: The number of consecutive months the commodity is listed is indicated after each item.
PMI
Manufacturing growth decelerated in November as the PMI registered 53.6 percent, a decrease of 2.1 percentage points when compared to October's reading of 55.7 percent. This continues the recovery in the sector, but at a slower rate of growth. A reading above 50 percent indicates that the manufacturing economy is generally expanding; below 50 percent indicates that it is generally contracting.
A PMI in excess of 41.2 percent, over a period of time, generally indicates an expansion of the overall economy. Therefore, the PMI indicates growth for the seventh consecutive month in the overall economy, as well as expansion in the manufacturing sector for the fourth consecutive month. Ore stated, "The past relationship between the PMI and the overall economy indicates that the average PMI for January through November (45.4 percent) corresponds to a 1.3 percent increase in real gross domestic product (GDP). However, if the PMI for November (53.6 percent) is annualized, it corresponds to a 3.9 percent increase in real GDP annually."
THE LAST 12 MONTHS
COMMODITIES REPORTED UP/DOWN IN PRICE and IN SHORT SUPPLY
Commodities Up in Price
Aluminum (5); Copper (6); Copper Based Products (5); Natural Gas (2); Oil; and Steel (5).
Commodities Down in Price
No commodities are reported down in price.
Commodities in Short Supply
Electronic Components is the only commodity reported in short supply.
Note: The number of consecutive months the commodity is listed is indicated after each item.
PMI
Manufacturing growth decelerated in November as the PMI registered 53.6 percent, a decrease of 2.1 percentage points when compared to October's reading of 55.7 percent. This continues the recovery in the sector, but at a slower rate of growth. A reading above 50 percent indicates that the manufacturing economy is generally expanding; below 50 percent indicates that it is generally contracting.
A PMI in excess of 41.2 percent, over a period of time, generally indicates an expansion of the overall economy. Therefore, the PMI indicates growth for the seventh consecutive month in the overall economy, as well as expansion in the manufacturing sector for the fourth consecutive month. Ore stated, "The past relationship between the PMI and the overall economy indicates that the average PMI for January through November (45.4 percent) corresponds to a 1.3 percent increase in real gross domestic product (GDP). However, if the PMI for November (53.6 percent) is annualized, it corresponds to a 3.9 percent increase in real GDP annually."
THE LAST 12 MONTHS


 Highlights
* The Chicago PMI index jumped over the 50 point threshold for the first time since September 2008 as the index grew to 54.2 in October. The consensus expected the index to increase slightly to 49.0 from 46.1 and remain in the contraction phase.
* The production index increased to 63.9 from 47.2 and orders rose to 61.4 from 46.3.
* Inventories continued to contract and have gotten worse over the last month as the index declined to 32.2 from 38.9.
* The only other sector that continued to contract was employment, which declined to 38.3 from 38.8.
* Other components of the index showed the manufacturing sector strengthening including order backlogs, which increased to 41.9 from 36.7 and prices paid, which declined to 48.6 from 51.3.
Key Factors
* The entire index showed signs of a sustainable expansionary cycle.
* Unlike last month's national index, where production grew on the anticipation of new orders that never came in, production and new orders posted strong growth and entered an expansionary phase in the Chicago region.
Big Picture
* The Chicago PMI has little overall economic value, and is only watched by the financial markets because it is usually released one day in advance of the similar national ISM manufacturing survey. A significant move in this regional survey will therefore sometimes be seen as having predictive value for the ISM index.
Highlights
* The Chicago PMI index jumped over the 50 point threshold for the first time since September 2008 as the index grew to 54.2 in October. The consensus expected the index to increase slightly to 49.0 from 46.1 and remain in the contraction phase.
* The production index increased to 63.9 from 47.2 and orders rose to 61.4 from 46.3.
* Inventories continued to contract and have gotten worse over the last month as the index declined to 32.2 from 38.9.
* The only other sector that continued to contract was employment, which declined to 38.3 from 38.8.
* Other components of the index showed the manufacturing sector strengthening including order backlogs, which increased to 41.9 from 36.7 and prices paid, which declined to 48.6 from 51.3.
Key Factors
* The entire index showed signs of a sustainable expansionary cycle.
* Unlike last month's national index, where production grew on the anticipation of new orders that never came in, production and new orders posted strong growth and entered an expansionary phase in the Chicago region.
Big Picture
* The Chicago PMI has little overall economic value, and is only watched by the financial markets because it is usually released one day in advance of the similar national ISM manufacturing survey. A significant move in this regional survey will therefore sometimes be seen as having predictive value for the ISM index.
