Full report here
UNEMPLOYMENT INSURANCE WEEKLY CLAIMS REPORT
SEASONALLY ADJUSTED DATA
In the week ending July 25, the advance figure for seasonally adjusted initial claims was 584,000, an increase of 25,000 from the previous week's revised figure of 559,000. The 4-week moving average was 559,000, a decrease of 8,250 from the previous week's revised average of 567,250.
The advance seasonally adjusted insured unemployment rate was 4.7 percent for the week ending July 18, unchanged from the prior week's unrevised rate of 4.7 percent.
The advance number for seasonally adjusted insured unemployment during the week ending July 18 was 6,197,000, a decrease of 54,000 from the preceding week's revised level of 6,251,000. The 4-week moving average was 6,416,250, a decrease of 131,750 from the preceding week's revised average of 6,548,000.
The fiscal year-to-date average for seasonally adjusted insured unemployment for all programs is 5.497 million.
UNADJUSTED DATA
The advance number of actual initial claims under state programs, unadjusted, totaled 507,464 in the week ending July 25, a decrease of 78,111 from the previous week. There were 376,123 initial claims in the comparable week in 2008.
The advance unadjusted insured unemployment rate was 4.6 percent during the week ending July 18, a decrease of 0.1 percentage point from the prior week. The advance unadjusted number for persons claiming UI benefits in state programs totaled 6,060,671, a decrease of 196,289 from the preceding week. A year earlier, the rate was 2.4 percent and the volume was 3,208,848.
Extended benefits were available in Alaska, Arizona, Arkansas, California, Colorado, Connecticut, Delaware, the District of Columbia, Florida, Georgia, Idaho, Illinois, Indiana, Kansas, Kentucky, Maine, Massachusetts, Michigan, Minnesota, Missouri, Montana, Nevada, New Jersey, New York, North Carolina, Ohio, Oregon, Pennsylvania, Puerto Rico, Rhode Island, South Carolina, Tennessee, Texas, Vermont, Virginia, Washington, and Wisconsin during the week ending July 11.
Initial claims for UI benefits by former Federal civilian employees totaled 1,691 in the week ending July 18, a decrease of 343 from the prior week. There were 2,061initial claims by newly discharged veterans, a decrease of 173 from the preceding week.
There were 18,717 former Federal civilian employees claiming UI benefits for the week ending July 11, an increase of 256 from the previous week. Newly discharged veterans claiming benefits totaled 29,932, an increase of 834 from the prior week.
States reported 2,656,879 persons claiming EUC (Emergency Unemployment Compensation) benefits for the week ending July 11, an increase of 24,518 from the prior week. There were 127,438 claimants in the comparable week in 2008. EUC weekly claims include both first and second tier activity.
The highest insured unemployment rates in the week ending July 11 were in Puerto Rico (7.3 percent), Michigan (7.2), Oregon (6.7), Pennsylvania (6.4), Nevada (6.2), Wisconsin (6.1), Connecticut (5.6), New Jersey (5.6), Arkansas (5.5), California (5.5), North Carolina (5.5), and South Carolina (5.5).
The largest increases in initial claims for the week ending July 18 were in California (+4,290), Michigan (+3,654), Florida (+3,291), Connecticut (+749), and Indiana (+526), while the largest decreases were in New York (-22,052), Wisconsin (-6,791), Missouri (-6,529), Pennsylvania (-6,420), and Ohio (-5,062).
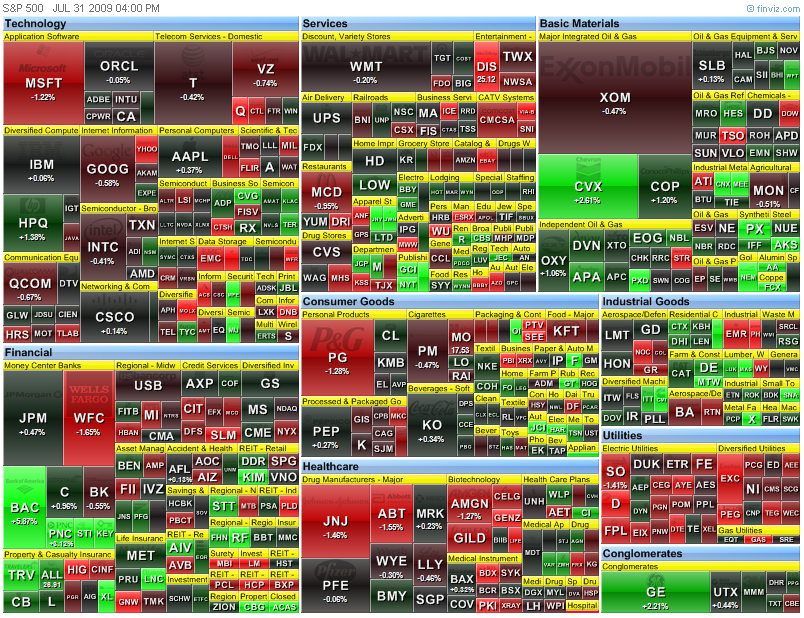
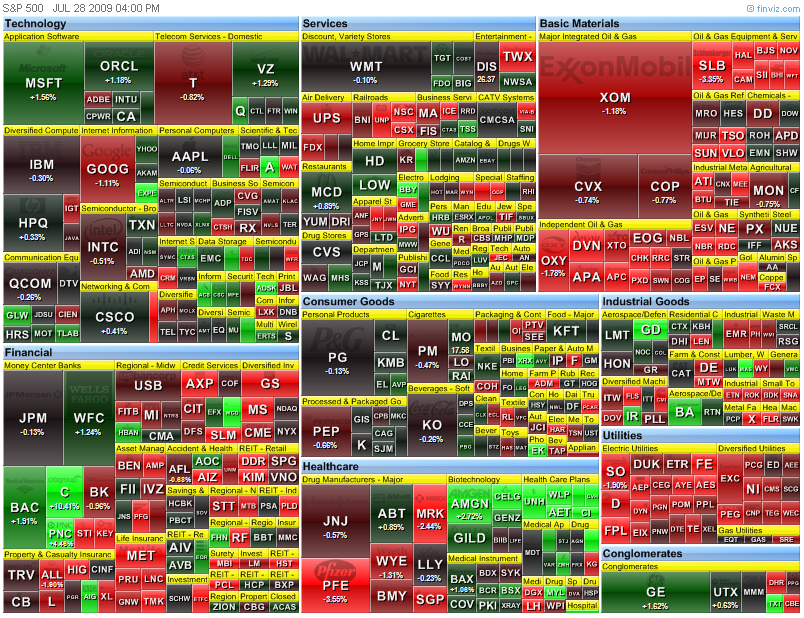
 Today's heatmap:
 Highlights
* According to the Institute of Supply Management-Chicago and Kingsbury International, Ltd., the Chicago Purchasing Managers Index increased to 39.9 in June from 34.9 in May. That was better than the consensus estimate of 39.0 and above the 6-month average of 35.6.
* The June number improved month-to-month, aided by an uptick in new orders, which jumped to 41.6 from 37.3. In fact, increases were seen in every component index, although some increases didn't necessarily imply encouraging things.
* The inventories index went up to 34.2 from 31.5 and prices paid increased to 36.3 from 29.8.
* Separately, production improved to 39.3 from 38.1, order backlogs increased to 37.6 from 26.3, and employment edged up to 28.9 from 25.0.
* The full report is available at www.kingbiz.com
Key Factors
* A reading below 50 still connotes a contraction in manufacturing activity in this region, although the uptick from May implies the rate of contraction has slowed.
* This survey was better than expected, but one needs to be careful not to extrapolate too much encouragement from it just yet knowing that it follows on the heels of a very problematic period for the auto industry, which is closely linked to the Chicago region. In other words, it could simply mark a temporary bounce from a very depressed situation.
Big Picture
* The Chicago PMI has little overall economic value, and is only watched by the financial markets because it is usually released one day in advance of the similar national ISM manufacturing survey. A significant move in this regional survey will therefore sometimes be seen as having predictive value for the ISM index.
Highlights
* According to the Institute of Supply Management-Chicago and Kingsbury International, Ltd., the Chicago Purchasing Managers Index increased to 39.9 in June from 34.9 in May. That was better than the consensus estimate of 39.0 and above the 6-month average of 35.6.
* The June number improved month-to-month, aided by an uptick in new orders, which jumped to 41.6 from 37.3. In fact, increases were seen in every component index, although some increases didn't necessarily imply encouraging things.
* The inventories index went up to 34.2 from 31.5 and prices paid increased to 36.3 from 29.8.
* Separately, production improved to 39.3 from 38.1, order backlogs increased to 37.6 from 26.3, and employment edged up to 28.9 from 25.0.
* The full report is available at www.kingbiz.com
Key Factors
* A reading below 50 still connotes a contraction in manufacturing activity in this region, although the uptick from May implies the rate of contraction has slowed.
* This survey was better than expected, but one needs to be careful not to extrapolate too much encouragement from it just yet knowing that it follows on the heels of a very problematic period for the auto industry, which is closely linked to the Chicago region. In other words, it could simply mark a temporary bounce from a very depressed situation.
Big Picture
* The Chicago PMI has little overall economic value, and is only watched by the financial markets because it is usually released one day in advance of the similar national ISM manufacturing survey. A significant move in this regional survey will therefore sometimes be seen as having predictive value for the ISM index.
 Today's heatmap:
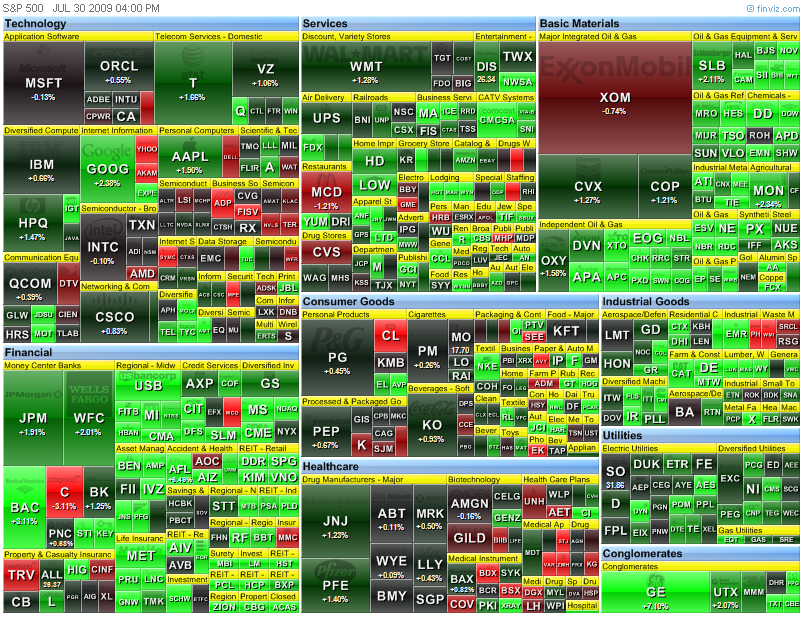
 Today's heatmap:
 Full report here
 Full report here
The Conference Board Consumer Confidence Index™ Retreats Again
July 28, 2009
The Conference Board Consumer Confidence Index™, which had retreated in June, declined further in July. The Index now stands at 46.6 (1985=100), down from 49.3 in June. The Present Situation Index decreased to 23.4 from 25.0 last month. The Expectations Index declined to 62.0 from 65.5 in June.
The Consumer Confidence Survey™ is based on a representative sample of 5,000 U.S. households. The monthly survey is conducted for The Conference Board by TNS. TNS is the world's largest custom research company. The cutoff date for July’s preliminary results was July 21st.
Says Lynn Franco, Director of The Conference Board Consumer Research Center: "Consumer confidence, which had rebounded strongly in late spring, has faded in the last two months. The decline in the Present Situation Index was caused primarily by a worsening job market, as the percent of consumers claiming jobs are hard to get rose sharply. The decline in the Expectations Index was more the result of an increase in the proportion of consumers expecting no change in business and labor market conditions, as opposed to an increase in the percent of consumers expecting conditions to deteriorate further. However, more consumers are pessimistic about their income expectations, which does not bode well for spending in the months ahead."
Consumers continued to rate current conditions unfavorably in July. Those saying business conditions are "bad" increased to 46.3 percent from 45.3 percent, however, those saying conditions are "good" increased to 9.1 percent from 8.1 percent. Consumers' assessment of the labor market deteriorated further. Those claiming jobs are "hard to get" increased to 48.1 percent from 44.8 percent, while those claiming jobs are "plentiful" decreased to 3.6 percent from 4.5 percent.
Overall, consumers remain quite pessimistic about the short-term outlook. The percent of consumers anticipating an improvement in business conditions over the next six months decreased to 18.0 percent from 20.9 percent, however, those expecting conditions to worsen decreased to 18.9 percent from 20.4 percent.
The labor market outlook was also mixed. The percentage of consumers expecting more jobs in the months ahead decreased to 15.0 percent from 17.5 percent, however, those expecting fewer jobs decreased to 26.3 percent from 27.6 percent. The proportion of consumers expecting an increase in their incomes declined to 9.5 percent from 10.1 percent.
For further information contact:
Lynn Franco
at +1 212 339 0344
lynn.franco@conference-board.org
Full report here
The Conference Board Consumer Confidence Index™ Retreats Again
July 28, 2009
The Conference Board Consumer Confidence Index™, which had retreated in June, declined further in July. The Index now stands at 46.6 (1985=100), down from 49.3 in June. The Present Situation Index decreased to 23.4 from 25.0 last month. The Expectations Index declined to 62.0 from 65.5 in June.
The Consumer Confidence Survey™ is based on a representative sample of 5,000 U.S. households. The monthly survey is conducted for The Conference Board by TNS. TNS is the world's largest custom research company. The cutoff date for July’s preliminary results was July 21st.
Says Lynn Franco, Director of The Conference Board Consumer Research Center: "Consumer confidence, which had rebounded strongly in late spring, has faded in the last two months. The decline in the Present Situation Index was caused primarily by a worsening job market, as the percent of consumers claiming jobs are hard to get rose sharply. The decline in the Expectations Index was more the result of an increase in the proportion of consumers expecting no change in business and labor market conditions, as opposed to an increase in the percent of consumers expecting conditions to deteriorate further. However, more consumers are pessimistic about their income expectations, which does not bode well for spending in the months ahead."
Consumers continued to rate current conditions unfavorably in July. Those saying business conditions are "bad" increased to 46.3 percent from 45.3 percent, however, those saying conditions are "good" increased to 9.1 percent from 8.1 percent. Consumers' assessment of the labor market deteriorated further. Those claiming jobs are "hard to get" increased to 48.1 percent from 44.8 percent, while those claiming jobs are "plentiful" decreased to 3.6 percent from 4.5 percent.
Overall, consumers remain quite pessimistic about the short-term outlook. The percent of consumers anticipating an improvement in business conditions over the next six months decreased to 18.0 percent from 20.9 percent, however, those expecting conditions to worsen decreased to 18.9 percent from 20.4 percent.
The labor market outlook was also mixed. The percentage of consumers expecting more jobs in the months ahead decreased to 15.0 percent from 17.5 percent, however, those expecting fewer jobs decreased to 26.3 percent from 27.6 percent. The proportion of consumers expecting an increase in their incomes declined to 9.5 percent from 10.1 percent.
For further information contact:
Lynn Franco
at +1 212 339 0344
lynn.franco@conference-board.org
