Existing-Home Sales Rise, Helped by Lower Prices - CNBC
A real estate group says U.S. home prices posted a gain in the second quarter, another sign that the ailing housing market is finally coming to life.
AP
The National Association of Realtors says the median sales price in the quarter was $174,100, up 4 percent from the first quarter, but still almost 16 percent below a year ago.
Prices were still down from a year ago in 129 out of 155 metropolitan areas the group tracks.
Total sales rose to a seasonally adjusted annual rate of 4.76 million, from 4.58 million in the first quarter, but were still about 3 percent below a year ago.
Thirty-nine states reflected sales increases from the first quarter, and nine states were higher than one year ago.
"With low interest rates, lower home prices and a first-time buyer tax credit, we've been seeing healthy increases in home sales, which are a hopeful sign for the economy," said Lawrence Yun, NAR chief economist.
Foreclosures and short sales made up more than one-third of the sales, weighing down home prices. The national median price was $174,100 — 15.6 percent lower on the year.
The largest sales gain between the first and second quarters was in Idaho, up 67.5 percent; followed by Hawaii which rose 24.2 percent; New York, up 22.3 percent, Wisconsin; with a 21.7 percent gain; and Nebraska with a 20.3 percent increase. Twelve other states experienced double-digit sales increases from the first quarter.
Year over year, California, Minnesota and Michigan are showing double-digit gains from the second quarter of 2008 but are off from the first quarter of this year.
Sharp price declines have continued to be concentrated in areas with high levels of foreclosures, such as California, Florida, Arizona and Nevada.
The biggest metro area price drop, of nearly 53 percent, was in Fort Myers, Fla. Prices also fell 35 percent or more in Phoenix, Riverside, Calif. and Las Vegas. The biggest price gain, of nearly 31 percent, was in Davenport, Iowa, followed by Cumberland, Md., at nearly 22 percent.
Regionally, existing-home sales in the Northeast jumped 15.0 percent in the second quarter, but are 8.4 percent below a year ago. In the midwest, existing-home sales rose 3.2 percent in the second quarter but are 5.3 percent lower on the year.
Sales rose 3.9 percent in the second quarter in the south, 7.2 percent lower on the year. In the west, existing-home sales fell 2.3 percent in the second quarter, but are 11.8 percent above a year ago.
Many economists now say that the worst of the housing recession is over, though foreclosures are expected to rise over the next year.
From the National association of Realtors
2nd Quarter Existing-Home Sales Rise in Most States, Helped by Affordable Metro Prices
Washington, August 12, 2009
Existing-home sales in the second quarter showed healthy gains from the first quarter in the vast majority of states, and price declines have increased affordability in most metro areas, according to the latest survey by the National Association of Realtors®.
Total state existing-home sales, including single-family and condo, rose 3.8 percent to a seasonally adjusted annual rate1 of 4.76 million units in the second quarter from 4.58 million units in the first quarter, but remain 2.9 percent below the 4.90 million-unit pace in the second quarter of 2008.
Thirty-nine states experienced sales increases from the first quarter, and nine states were higher than a year ago; the District of Columbia showed both quarterly and annual rises.
Lawrence Yun, NAR chief economist, said the sales gain appears to be sustainable. “With low interest rates, lower home prices and a first-time buyer tax credit, we’ve been seeing healthy increases in home sales, which are a hopeful sign for the economy,” he said. “There have been sustained sales gains in Arizona, Nevada and Florida, as well as diverse areas such as Maryland, the District of Columbia and Nebraska. More recently, we’ve seen strong double-digit gains in Idaho, Utah, New Mexico, Washington, Hawaii, New York, New Jersey, Maine, Vermont, Wisconsin, Indiana, South Dakota and Montana.”
Yun explained housing’s impact on the overall economy. “Given the need for related goods and services, each home sale pumps an additional $63,000 into the economy – that’s how the housing engine traditionally pulls us out of recession. In addition, sales are drawing down inventory and that will help stabilize home values, which in turn will lessen foreclosure pressure and boost credit availability for other sectors of the economy.”
During the second quarter, 129 out of 155 metropolitan statistical areas2 reported lower median existing single-family home prices in comparison with the second quarter of 2008, while 26 areas had price gains.
Distressed sales – foreclosures and short sales – accounted for 36 percent of transactions in the second quarter, which continued to weigh down median home prices because they typically are sold at a 15 to 20 percent discount; first-time buyers accounted for one-third of transactions. The national median existing single-family price was $174,100, which is 15.6 percent below the second quarter of 2008. The median is where half sold for more and half sold for less.
According to Freddie Mac, the national average commitment rate on a 30-year conventional fixed-rate mortgage declined to a record low 5.03 percent in the second quarter from 5.06 percent in the first quarter; the rate was 6.09 percent in the second quarter of 2008.
NAR President Charles McMillan, a broker with Coldwell Banker Residential Brokerage in Dallas-Fort Worth, said there are unique opportunities in the current market. “Housing affordability is hovering near record highs and there’s a wide selection of homes, but first-time buyers need to move quickly to take advantage of the $8,000 tax credit because they have to finalize the transaction by November 30,” he said. “Various state, local and nonprofit programs target first-time buyers, and a Realtor® can help you identify the programs and financing options that are currently available in your area.”
The largest sales gain between the first and second quarters was in Idaho, up 67.5 percent; followed by Hawaii which rose 24.2 percent; New York, up 22.3 percent, Wisconsin; with a 21.7 percent gain; and Nebraska with a 20.3 percent increase. Twelve other states experienced double-digit sales increases from the first quarter.
Year over year, California, Minnesota and Michigan are showing double-digit gains from the second quarter of 2008 but are off from the first quarter of this year.
The largest single-family home price increase in the second quarter was in the Davenport-Moline-Rock Island area of Iowa and Illinois, where the median price of $113,200 rose 30.6 percent from a year ago. Next was the Cumberland area of Maryland and West Virginia at $123,500, up 21.7 percent from the second quarter of 2008, followed by Elmira, N.Y., where the median price increased 11.3 percent to $85,000.
“The sharpest price declines continue to be concentrated in metros with high levels of foreclosures, including areas in California, Florida, Arizona and Nevada, where distressed homes comprise many of the transactions,” Yun said
Median second-quarter metro area single-family home prices ranged from a very affordable $55,700 in the Saginaw-Saginaw Township North area of Michigan to $569,500 in Honolulu. The second most expensive area in the second quarter was the San Jose-Sunnyvale-Santa Clara area of California, at $500,000, followed by San Francisco-Oakland-Fremont at $472,900.
Other affordable markets include the Youngstown-Warren-Boardman area of Ohio and Pennsylvania at $71,500, and Lansing-East Lansing, Mich., at $81,200.
“Recently sold homes are concentrated in lower price ranges. The median price may not be representative of overall values in a given area because many middle priced homes are not on the market,” Yun clarified.
In the condo sector, metro area condominium and cooperative prices – covering changes in 57 metro areas – showed the national median existing-condo price was $176,900 in the second quarter, down 19.8 percent from the second quarter of 2008. Four metros showed annual increases in the median condo price and 53 areas had declines.
The metros with condo price rises were the Virginia Beach-Norfolk-Newport News area of Virginia and North Carolina at $195,000, up 2.6 percent, followed by the Wichita, Kan., area, where the median price of $109,500 rose 2.0 percent from the second quarter of 2008, Dallas-Fort Worth-Arlington, at $137,800, up 0.7 percent, and the Colorado Springs, Colo., area, which rose 0.2 percent to $145,200.
Metro area median existing-condo prices in the second quarter ranged from $66,400 in Las Vegas-Paradise, Nev., to $405,700 in San Francisco-Oakland-Fremont. The second most expensive reported condo market was Honolulu at $318,400, followed by Boston-Cambridge-Quincy at $277,400.
Other affordable condo markets include the Sacramento-Arden-Arcade-Roseville area of California at $101,200 in the second quarter, and Tucson, Ariz., at $102,500.
Regionally, existing-home sales in the Northeast jumped 15.0 percent in the second quarter to a pace of 797,000 units but are 8.4 percent below a year ago.
The median existing single-family home price in the Northeast declined 9.7 percent to $246,000 in the second quarter from the same quarter in 2008. After Elmira, the best gain in the region was in Buffalo-Niagara Falls, N.Y., where the median price of $115,400 rose 6.7 percent from the second quarter of 2008, followed by Syracuse, N.Y., at $124,600, up 0.8 percent.
In the Midwest, existing-home sales rose 3.2 percent in the second quarter to a pace of 1.06 million but are 5.3 percent below a year ago.
The median existing single-family home price in the Midwest was down 8.6 percent to $146,800 in the second quarter from the same period in 2008. After Davenport-Moline-Rock Island, the next strongest metro price increase in the region was in Bismarck, N.D., where the median price of $157,800 was 3.5 percent higher than a year ago, followed by Springfield, Ill., at $116,200, also up 3.5 percent, and Topeka, Kan., at $113,300, up 2.7 percent.
In the South, existing-home sales increased 3.9 percent in the second quarter to an annual rate of 1.76 million but are 7.2 percent lower than the second quarter of 2008.
The median existing single-family home price in the South was $158,600 in the second quarter, down 10.3 percent from a year earlier. After Cumberland, the strongest price increase in the region was in Beaumont-Port Arthur, Texas, with an 11.0 percent gain to $138,600, followed by, Jackson, Miss., at $140,100, up 8.2 percent, and Shreveport-Bossier City, La., at $146,800, up 3.0 percent.
Existing-home sales in the West declined 2.3 percent in the second quarter to an annual rate of 1.13 million but are 11.8 percent above a year ago.
The median existing single-family home price in the West was $212,600 in the second quarter, which is 26.6 percent below the second quarter of 2008. The best metro price performances in the West were in Kennewick-Richland-Pasco area of Washington, where the median price of $163,900 rose 0.3 percent from a year earlier, and Yakima, Wash., at $162,800, also up 0.3 percent. No other areas covered in the region reported increases.
The National Association of Realtors®, “The Voice for Real Estate,” is America’s largest trade association, representing 1.2 million members involved in all aspects of the residential and commercial real estate industries.
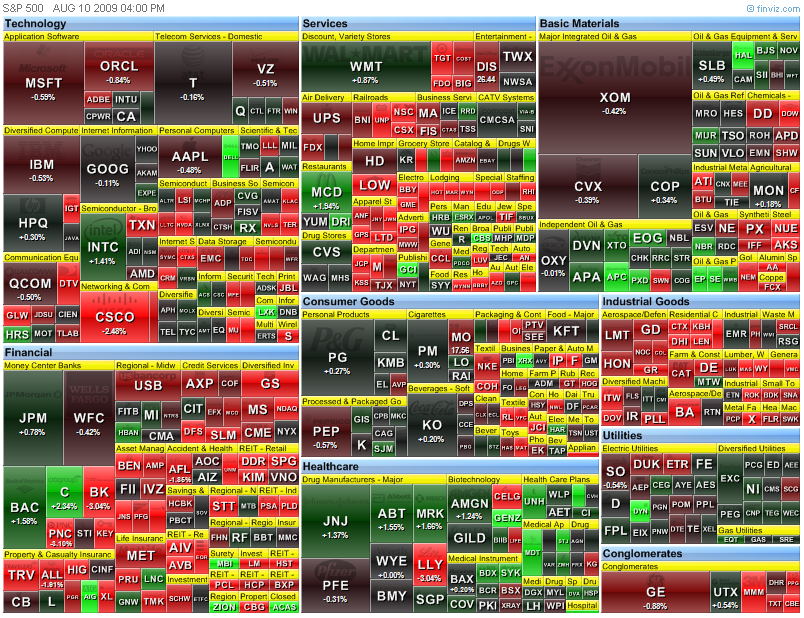
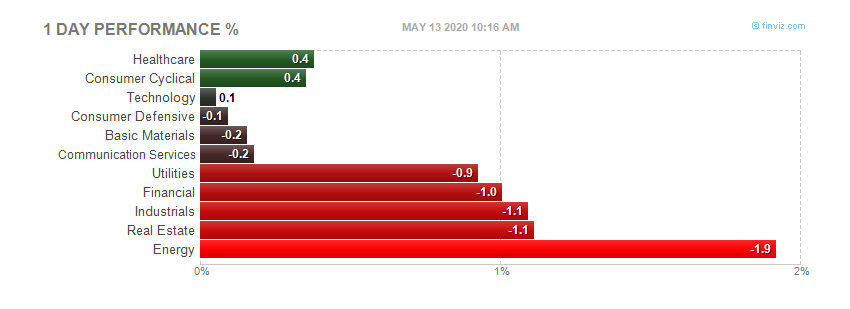
 Today's heatmap:
 The food and beverages index, which rose 0.1 percent in June, fell 0.2 percent in July. The decrease was caused by the food at home index, which declined for the seventh time in the last eight months, falling 0.5 percent. All six major grocery store food group indexes fell, with the largest decreases being a 1.3 percent decline in the index for meats, poultry, fish and eggs and a 0.6 percent decline in the dairy and related products index, which has now fallen for eight months in a row.
The cereals and bakery products index posted the smallest decrease of the six groups, falling 0.1 percent. The indexes for fruits and vegetables, for nonalcoholic
beverages, and for other food at home all declined 0.3 percent in July. The food at home index has declined 2.6 percent from its peak in November 2008. In contrast to the decline in the food at home index, the food away from home index rose 0.1 percent in July and the index for alcoholic beverages increased 0.3 percent.
The housing index fell 0.2 percent in July after being unchanged in June. The index for shelter fell 0.2 percent and the household energy index declined 0.3 percent. Within the shelter group, the indexes for rent and owners’ equivalent rent were both unchanged in July after rising 0.1 percent in June. The index for lodging away from home turned down in July, falling 2.1 percent after increasing 0.3 percent in June, and has fallen 8.9 percent over the past 12 months. Within household energy, a 0.9 percent increase in the index for natural gas was more than offset by declines in the other indexes, including a 0.6 percent decrease in the electricity index and a 1.5 percent fall in the fuel oil index.
The index for household furnishings and operations, unchanged for each of the previous three months, declined 0.1 percent in July. For the past 12 months, the housing index has declined 0.7 percent, with the shelter index up 0.9 percent and the household energy index down 14.1 percent.
After rising 4.2 percent in June, the transportation index increased 0.2 percent in July. Most of the moderation was due to the motor fuel index, which fell 0.4 percent in July after rising 17.2 percent in June. The new vehicle index increased 0.5 percent in July after rising 0.7 percent in June, and the index for used cars and
trucks was unchanged in July after rising 0.9 percent in June.
The public transportation index, however, turned up in July, rising 1.9 percent after declining 0.5 percent in June. The turnaround was mostly due to the index for airline fares, which rose 2.1 percent in July after declining in each of the previous ten months. Over the past 12 months, the transportation index has fallen 14.1 percent, with several of its components declining. The gasoline index fell 37.3 percent while the index for airline fares declined 16.6 percent and the index for used cars and trucks decreased 7.9 percent. However, the new vehicle index has risen 1.2 percent over the past 12 months.
Among other CPI groups, the medical care index rose 0.2 percent in July, the same increase as in June. Within that group, the index for hospital and related services rose 0.7 percent while the index for prescription drugs was unchanged. Over the last 12 months, the medical care index has risen 3.2 percent.
The index for other goods and services rose 0.8 percent in July after advancing 0.3 percent in June. The larger increase was driven by the tobacco index, which rose 2.2 percent as excise tax increases in several states went into effect in July. The tobacco index has now risen 27.8 percent over the past year.
The apparel index advanced 0.6 percent in July after a 0.7 percent increase in June. The index for education and communication rose 0.3 percent in July after rising 0.2 percent in June, while the index for recreation was unchanged in July after rising 0.5 percent in June.
More charts and info at link.
The food and beverages index, which rose 0.1 percent in June, fell 0.2 percent in July. The decrease was caused by the food at home index, which declined for the seventh time in the last eight months, falling 0.5 percent. All six major grocery store food group indexes fell, with the largest decreases being a 1.3 percent decline in the index for meats, poultry, fish and eggs and a 0.6 percent decline in the dairy and related products index, which has now fallen for eight months in a row.
The cereals and bakery products index posted the smallest decrease of the six groups, falling 0.1 percent. The indexes for fruits and vegetables, for nonalcoholic
beverages, and for other food at home all declined 0.3 percent in July. The food at home index has declined 2.6 percent from its peak in November 2008. In contrast to the decline in the food at home index, the food away from home index rose 0.1 percent in July and the index for alcoholic beverages increased 0.3 percent.
The housing index fell 0.2 percent in July after being unchanged in June. The index for shelter fell 0.2 percent and the household energy index declined 0.3 percent. Within the shelter group, the indexes for rent and owners’ equivalent rent were both unchanged in July after rising 0.1 percent in June. The index for lodging away from home turned down in July, falling 2.1 percent after increasing 0.3 percent in June, and has fallen 8.9 percent over the past 12 months. Within household energy, a 0.9 percent increase in the index for natural gas was more than offset by declines in the other indexes, including a 0.6 percent decrease in the electricity index and a 1.5 percent fall in the fuel oil index.
The index for household furnishings and operations, unchanged for each of the previous three months, declined 0.1 percent in July. For the past 12 months, the housing index has declined 0.7 percent, with the shelter index up 0.9 percent and the household energy index down 14.1 percent.
After rising 4.2 percent in June, the transportation index increased 0.2 percent in July. Most of the moderation was due to the motor fuel index, which fell 0.4 percent in July after rising 17.2 percent in June. The new vehicle index increased 0.5 percent in July after rising 0.7 percent in June, and the index for used cars and
trucks was unchanged in July after rising 0.9 percent in June.
The public transportation index, however, turned up in July, rising 1.9 percent after declining 0.5 percent in June. The turnaround was mostly due to the index for airline fares, which rose 2.1 percent in July after declining in each of the previous ten months. Over the past 12 months, the transportation index has fallen 14.1 percent, with several of its components declining. The gasoline index fell 37.3 percent while the index for airline fares declined 16.6 percent and the index for used cars and trucks decreased 7.9 percent. However, the new vehicle index has risen 1.2 percent over the past 12 months.
Among other CPI groups, the medical care index rose 0.2 percent in July, the same increase as in June. Within that group, the index for hospital and related services rose 0.7 percent while the index for prescription drugs was unchanged. Over the last 12 months, the medical care index has risen 3.2 percent.
The index for other goods and services rose 0.8 percent in July after advancing 0.3 percent in June. The larger increase was driven by the tobacco index, which rose 2.2 percent as excise tax increases in several states went into effect in July. The tobacco index has now risen 27.8 percent over the past year.
The apparel index advanced 0.6 percent in July after a 0.7 percent increase in June. The index for education and communication rose 0.3 percent in July after rising 0.2 percent in June, while the index for recreation was unchanged in July after rising 0.5 percent in June.
More charts and info at link.
 After close

 The banks win again, not a surprise at all.
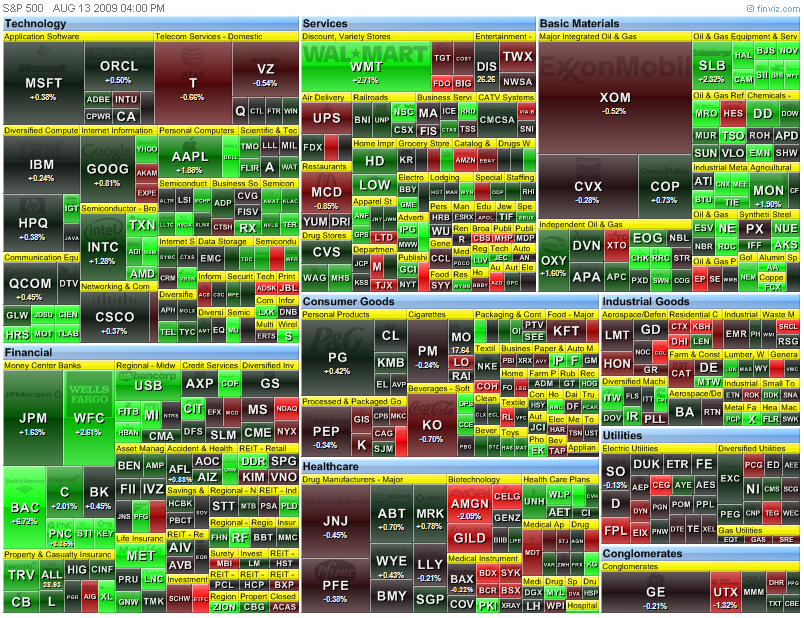
Today's heatmap:
The banks win again, not a surprise at all.
Today's heatmap:
 Full report here
The Manufacturing and Trade Inventories and Sales Report for July is scheduled to be released September 15, 2009 at 10:00 a.m. EDT.
For information, visit the Census Bureau’s Web site at
Full report here
The Manufacturing and Trade Inventories and Sales Report for July is scheduled to be released September 15, 2009 at 10:00 a.m. EDT.
For information, visit the Census Bureau’s Web site at  See footnotes and notes at the end of Table 3.
(p) Preliminary estimate.
(r) Revised estimate.
See footnotes and notes at the end of Table 3.
(p) Preliminary estimate.
(r) Revised estimate.

 (p) Preliminary estimate.
(r) Revised estimate.
1 Inventories are on a non-LIFO basis as of the end of the month.
2 Adjusted for seasonal variations and, in the case of sales, for trading-day differences and holiday variations. Concurrent seasonal adjustment is being used to adjust all sales, shipment, and inventory estimates. Concurrent seasonal adjustment uses all available unadjusted estimates as input to the X-12-ARIMA program. The factors derived from the program are applied to the current and previous month estimates and for retail and wholesale estimates a year ago as well. For retail sales, concurrent seasonal adjustment is also used to adjust the advance estimates (published one month before the preliminary estimates) and the estimates one year before the advance month. This explains the revision to retail estimates from a year ago.
3 Manufacturers sales refer to the value of shipments by manufacturers. The shipments data from individual manufacturers are adjusted prior to tabulation for the number of trading days as well as for any variations in the length of the reporting period.
4 The 2002 North American Industry Classification System (NAICS) defines merchant wholesalers as including manufacturers' sales branches and offices. However, the estimates included in this release exclude manufacturers' sales branches and offices. Note that this is not a change in coverage from prior releases and is consistent with the description used in the Monthly Wholesale Trade Survey data products.
Note: U.S. and group totals include kinds of business not shown. The Manufacturing and Trade Inventory and Sales estimates are based on data from three surveys: the Monthly Retail Trade Survey, the Monthly Wholesale Trade Survey, and the Manufacturers’ Shipments, Inventories, and Orders Survey. The sampling variability for retailers and merchant wholesalers can be used to construct a 90 percent confidence interval for the estimates. Over all possible samples, 90 percent of such intervals will cover the true estimate. These intervals are given in parentheses for the estimates on the front page. If, for example, the estimate is up 0.8 percent and the margin of sampling error is ±1.2 percent, the 90 percent confidence interval is -0.4 percent to +2.0 percent. If the range contains 0, it is uncertain whether there was an increase or decrease. Measures of reliability for Retail and Wholesale sales and inventory levels and changes are included in the detailed monthly press releases for those Industries. Manufacturers do not contribute to estimates of sampling variability because the manufacturer’s mail panel is not a probability sample from a known frame and standard errors of the industry estimates cannot be calculated. Estimates from all three surveys are also subject to nonsampling errors, which can arise in any stage of the survey. Such errors include coverage error (failure to accurately represent all population units in the sample), response errors, coding errors, and nonresponse. Although no direct measurement of these errors has been obtained, precautionary steps were taken in all phases of the collection, processing, and tabulation of the data to minimize their influence.
(p) Preliminary estimate.
(r) Revised estimate.
1 Inventories are on a non-LIFO basis as of the end of the month.
2 Adjusted for seasonal variations and, in the case of sales, for trading-day differences and holiday variations. Concurrent seasonal adjustment is being used to adjust all sales, shipment, and inventory estimates. Concurrent seasonal adjustment uses all available unadjusted estimates as input to the X-12-ARIMA program. The factors derived from the program are applied to the current and previous month estimates and for retail and wholesale estimates a year ago as well. For retail sales, concurrent seasonal adjustment is also used to adjust the advance estimates (published one month before the preliminary estimates) and the estimates one year before the advance month. This explains the revision to retail estimates from a year ago.
3 Manufacturers sales refer to the value of shipments by manufacturers. The shipments data from individual manufacturers are adjusted prior to tabulation for the number of trading days as well as for any variations in the length of the reporting period.
4 The 2002 North American Industry Classification System (NAICS) defines merchant wholesalers as including manufacturers' sales branches and offices. However, the estimates included in this release exclude manufacturers' sales branches and offices. Note that this is not a change in coverage from prior releases and is consistent with the description used in the Monthly Wholesale Trade Survey data products.
Note: U.S. and group totals include kinds of business not shown. The Manufacturing and Trade Inventory and Sales estimates are based on data from three surveys: the Monthly Retail Trade Survey, the Monthly Wholesale Trade Survey, and the Manufacturers’ Shipments, Inventories, and Orders Survey. The sampling variability for retailers and merchant wholesalers can be used to construct a 90 percent confidence interval for the estimates. Over all possible samples, 90 percent of such intervals will cover the true estimate. These intervals are given in parentheses for the estimates on the front page. If, for example, the estimate is up 0.8 percent and the margin of sampling error is ±1.2 percent, the 90 percent confidence interval is -0.4 percent to +2.0 percent. If the range contains 0, it is uncertain whether there was an increase or decrease. Measures of reliability for Retail and Wholesale sales and inventory levels and changes are included in the detailed monthly press releases for those Industries. Manufacturers do not contribute to estimates of sampling variability because the manufacturer’s mail panel is not a probability sample from a known frame and standard errors of the industry estimates cannot be calculated. Estimates from all three surveys are also subject to nonsampling errors, which can arise in any stage of the survey. Such errors include coverage error (failure to accurately represent all population units in the sample), response errors, coding errors, and nonresponse. Although no direct measurement of these errors has been obtained, precautionary steps were taken in all phases of the collection, processing, and tabulation of the data to minimize their influence.
 More at link

 More at link
 Before market opens
 Today after
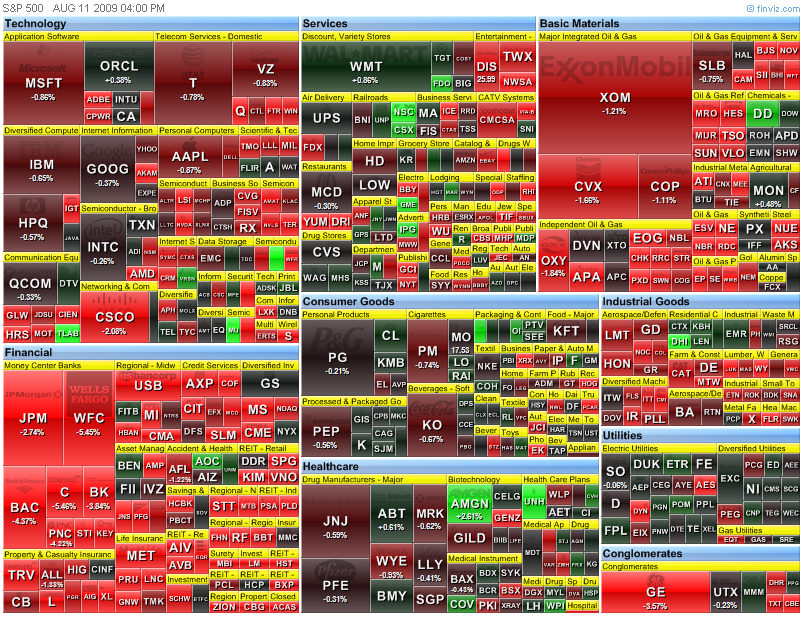
 Today's heatmap:

 Today before open
 Today after close
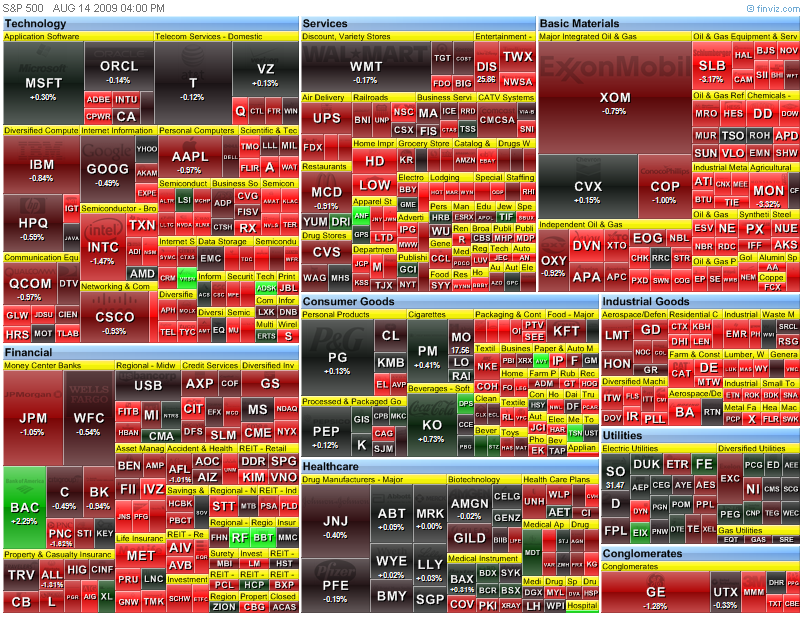
 Today's heatmap: