Friday, September 11, 2009
Pre-market - Friday, September 11, 2009
Futures up slightly this mornning:
DJIA INDEX 9,554.00 10.00
S&P 500 1,038.60 1.20 1,037.00
NASDAQ 100 1,684.25 1.50
Today's economic calendar:
Import and Export Prices 8:30 AM ET
Consumer Sentiment 9:55 AM ET
Wholesale Trade 10:00 AM ET
Treasury Budget 2:00 PM ET
Today's earnings reports:
Before open:
ACET Aceto Corp. Healthcare Drug Manufacturers - Major
BRC Brady Corp. Services Business Services
CPB Campbell Soup Co. Consumer Goods Processed & Packaged Goods
GROW U.S. Global Investors, Inc. Financial Asset Management
After close = none
Market wrap - Thrusday, September 10, 2009
Dow 9,627.48 +80.26 (0.84%)
S&P 500 1,044.14 +10.77 (1.04%)
Nasdaq 2,084.02 +23.63 (1.15%)
Thursday, September 10, 2009

International trade - 8:30am
Full report here
U.S. Census Bureau
U.S. Bureau of Economic Analysis
NEWS
U.S. Department of Commerce * Washington, DC 20230
U.S. INTERNATIONAL TRADE IN GOODS AND SERVICES
July 2009
Goods and Services
The U.S. Census Bureau and the U.S. Bureau of Economic Analysis, through the Department of Commerce, announced today that total July exports of $127.6 billion and imports of $159.6 billion resulted in a goods and services deficit of $32.0 billion, up from $27.5 billion in June, revised. July exports were $2.7 billon more than June exports of $124.9 billion. July imports were $7.2 billion more than June imports of $152.4 billion.
In July, the goods deficit increased $4.3 billion from June to $42.7 billion, and the services surplus decreased $0.1 billion to $10.7 billion. Exports of goods increased $2.7 billion to $86.7 billion, and imports of goods increased $7.0 billion to $129.4 billion. Exports of services increased $0.1 billion to $40.9 billion, and imports of services increased $0.2 billion to $30.2 billion.
In July, the goods and services deficit decreased $32.9 billion from July 2008. Exports were down $36.8 billion, or 22.4 percent, and imports were down $69.8 billion, or 30.4 percent.
Goods
The June to July increase in exports of goods reflected increases in automotive vehicles, parts, and engines ($1.3 billion); capital goods ($0.7 billion); industrial supplies and materials ($0.4 billion); consumer goods ($0.4 billion); and other goods ($0.2 billion). A decrease occurred in foods, feeds, and beverages ($0.4 billion).
The June to July increase in imports of goods reflected increases in automotive vehicles, parts, and engines ($2.4 billion); consumer goods ($1.7 billion); industrial supplies and materials ($1.4 billion); capital goods ($1.3 billion); and other goods ($0.2 billion). A decrease occurred in foods, feeds, and beverages ($0.1 billion).
The July 2008 to July 2009 decrease in exports of goods reflected decreases in industrial supplies and materials ($13.1 billion); capital goods ($7.9 billion); automotive vehicles, parts, and engines ($4.7 billion); foods, feeds, and beverages ($2.2 billion); consumer goods ($2.1 billion); and other goods ($0.4 billion).
The July 2008 to July 2009 decrease in imports of goods reflected decreases in industrial supplies and materials ($41.5 billion); capital goods ($8.6 billion); automotive vehicles, parts, and engines ($6.8 billion); consumer goods ($5.5 billion); other goods ($1.1 billion); and foods, feeds, and beverages ($0.7 billion).
Services
Services exports increased $0.1 billion from June to July. The increase was more than accounted for by an increase in other transportation (which includes freight and port services) and small increases in several other categories of services exports. Decreases in passenger fares and other private services (which includes items such as business, professional, and technical services, insurance services, and financial services) were partly offsetting.
Services imports increased $0.2 billion from June to July. The increase was more than accounted for by increases in other transportation and travel. A decrease in passenger fares was partly offsetting. Changes in other categories of services imports were small.
The July 2008 to July 2009 decrease in exports of services was $6.3 billion. The largest decreases were in travel ($2.3 billion), other transportation ($1.6 billion), other private services ($1.1 billion), and royalties and license fees ($1.0 billion). Within other private services, the largest decrease was in business, professional, and technical services.
The July 2008 to July 2009 decrease in imports of services was $4.7 billion. The largest decreases were in other transportation ($2.0 billion), passenger fares ($0.8
billion), travel ($0.6 billion), and other private services ($0.6 billion). Within other private services, the largest decreases were in business, professional, and technical services and financial services.
Goods and Services Moving Average
For the three months ending in July, exports of goods and services averaged $124.9 billion, while imports of goods and services averaged $153.5 billion, resulting in an average trade deficit of $28.6 billion. For the three months ending in June, the average trade deficit was $27.7 billion, reflecting average exports of $122.6 billion and average imports of $150.3 billion.
Selected Not Seasonally Adjusted Goods Details
The July figures show surpluses, in billions of dollars, with Hong Kong $1.3 ($1.4 for June), Australia $0.7 ($1.0), Singapore $0.7 ($0.5), and Egypt $0.2 ($0.2). Deficits were recorded, in billions of dollars, with China $20.4 ($18.4), the European Union $8.0 ($4.5), OPEC $6.9 ($5.9), Japan $3.9 ($3.7), Mexico $2.9 ($3.4), Venezuela $2.3 ($1.8), Canada $2.2 ($1.5), Nigeria $1.7 ($1.3), Korea $1.0 ($0.9), and Taiwan $0.7 ($0.6).
Advanced technology products (ATP) exports were $20.0 billion in July and imports were $26.6 billion, resulting in a deficit of $6.6 billion. July exports were $0.8 billion less than the $20.7 billion in June, while July imports were $1.2 billion more than the $25.3 billion in June.
Revisions
Goods carry-over in July was $0.1 billion (0.1 percent) for exports and $0.6 billion (0.4 percent) for imports. For June, revised export carry-over was virtually zero, revised down from $0.1 billion (0.1 percent). For June, revised import carry-over was $0.1 billion (0.1 percent), revised down from $0.5 billion (0.4 percent).
Services exports and imports for January 2009 through June 2009 reflect the incorporation of more comprehensive and revised quarterly and monthly data. For services exports, the largest monthly revisions were in royalties and license fees and other private services. For services imports, the largest monthly revisions were in other private services.
Services exports for June were revised down $1.0 billion to $40.8 billion. The revision was more than accounted for by downward revisions in royalties and license fees, other private services, and travel; an upward revision in transfers under U.S. military sales contracts was partly offsetting. Services imports for June were revised down $0.4 billion to $30.0 billion. The revision was more than accounted for by a downward revision in other private services; an upward revision in royalties and license fees was partly offsetting.
Jobless claims - 8:30am
Full report here
UNEMPLOYMENT INSURANCE WEEKLY CLAIMS REPORT
SEASONALLY ADJUSTED DATA
In the week ending Sept. 5, the advance figure for seasonally adjusted initial claims was 550,000, a decrease of 26,000 from the previous week's revised figure of 576,000. The 4-week moving average was 570,000, a decrease of 2,750 from the previous week's revised average of 572,750.
The advance seasonally adjusted insured unemployment rate was 4.6 percent for the week ending Aug. 29, a decrease of 0.1 percentage point from the prior week's unrevised rate of 4.7 percent.
The advance number for seasonally adjusted insured unemployment during the week ending Aug. 29 was 6,088,000, a decrease of 159,000 from the preceding week's revised level of 6,247,000. The 4-week moving average was 6,182,500, a decrease of 37,750 from the preceding week's revised average of 6,220,250.
The fiscal year-to-date average for seasonally adjusted insured unemployment for all programs is 5.617 million.
UNADJUSTED DATA
The advance number of actual initial claims under state programs, unadjusted, totaled 460,516 in the week ending Sept. 5, an increase of 3,834 from the previous week. There were 336,733 initial claims in the comparable week in 2008.
The advance unadjusted insured unemployment rate was 4.1 percent during the week ending Aug. 29, a decrease of 0.1 percentage point from the prior week. The advance unadjusted number for persons claiming UI benefits in state programs totaled 5,424,564, a decrease of 197,837 from the preceding week. A year earlier, the rate was 2.3 percent and the volume was 3,059,126.
Extended benefits were available in Alabama, Alaska, Arizona, Arkansas, California, Colorado, Connecticut, Delaware, the District of Columbia, Florida, Georgia, Idaho, Illinois, Indiana, Kansas, Kentucky, Maine, Massachusetts, Michigan, Minnesota, Missouri, Nevada, New Hampshire, New Jersey, New York, North Carolina, Ohio, Oregon, Pennsylvania, Puerto Rico, Rhode Island, South Carolina, Tennessee, Texas, Vermont, Virginia, Washington, West Virginia, and Wisconsin during the week ending Aug. 22.
Initial claims for UI benefits by former Federal civilian employees totaled 1,456 in the week ending Aug. 29, a decrease of 49 from the prior week. There were 2,153 initial claims by newly discharged veterans, a decrease of 33 from the preceding week.
There were 19,715 former Federal civilian employees claiming UI benefits for the week ending Aug. 22, a decrease of 434 from the previous week. Newly discharged veterans claiming benefits totaled 30,776, an increase of 661 from the prior week.
States reported 3,102,877 persons claiming EUC (Emergency Unemployment Compensation) benefits for the week ending Aug. 22, an increase of 73,209 from the prior week. There were 1,160,151 claimants in the comparable week in 2008. EUC weekly claims include both first and second tier activity.
The highest insured unemployment rates in the week ending Aug. 22 were in Puerto Rico (7.0 percent), Pennsylvania (5.9), Oregon (5.9), Michigan (5.7), Nevada (5.7), California (5.3), Wisconsin (5.3), Connecticut (5.2), New Jersey (5.1), North Carolina (4.8), Rhode Island (4.8), and South Carolina (4.8).
The largest increases in initial claims for the week ending Aug. 29 were in New York (+4,546), Texas (+2,837), Florida (+1,780), New Jersey (+1,368), and Georgia (+1,336), while the largest decreases were in Michigan (-1,915), Ohio (-1,832), Oregon (-1,717), Wisconsin (-1,235), and Pennsylvania
(-1,190).
More at link with formatted tables
Pre-market - Thursday, September 10, 2009
Futures mixed to down this morning waiting on the Jobless Claims report at 8:30:
DJIA INDEX 9,537.00 -1.00
S&P 500 1,032.50 0.00
NASDAQ 100 1,668.25 2.25
Today's economic calendar:
BOE Announcement 7:00 AM ET
International Trade 8:30 AM ET
Jobless Claims 8:30 AM ET
Bank of Canada Announcement 9:00 AM ET
RBC CASH Index 9:00 AM ET
EIA Natural Gas Report 10:30 AM ET
EIA Petroleum Status Report 11:00 AM ET
3-Month Bill Announcement 11:00 AM ET
6-Month Bill Announcement 11:00 AM ET
30-Yr Bond Auction 1:00 PM ET
Money Supply 4:30 PM ET
Today's earings reports:
Before market opens:
DSGX Descartes Systems Group Inc. (T Technology Business Software & Services
GNET Global Traffic Network Inc. Technology Information & Delivery Services
LULU Lululemon Athletica Inc. Consumer Goods Textile - Apparel Clothing
MDNU Medical Nutrition USA, Inc. Healthcare Drug Related Products
MDZ MDS, Inc. Healthcare Specialized Health Services
MGPI MGP Ingredients Inc. Consumer Goods Processed & Packaged Goods
OHB Orleans Homebuilders Inc. Industrial Goods Residential Construction
SCMR Sycamore Networks Inc. Technology Networking & Communication Devices
VOL Volt Information Sciences Inc. Services Staffing & Outsourcing Services (release delayed)
After market close:
CMRO Comarco, Inc. Technology Communication Equipment
FMCN Focus Media Holding Ltd. Services Advertising Agencies
NSM National Semiconductor Corporation Technology Semiconductor - Broad Line
PSEM Pericom Semiconductor Corp. Technology Semiconductor - Integrated Circuits
TSCM TheStreet.com, Inc. Technology Internet Information Providers
Market wrap for Wednesday
Dow 9,547.22 +49.88 (0.53%)
S&P 500 1,033.37 +7.98 (0.78%)
Nasdaq 2,060.39 +22.62 (1.11%)
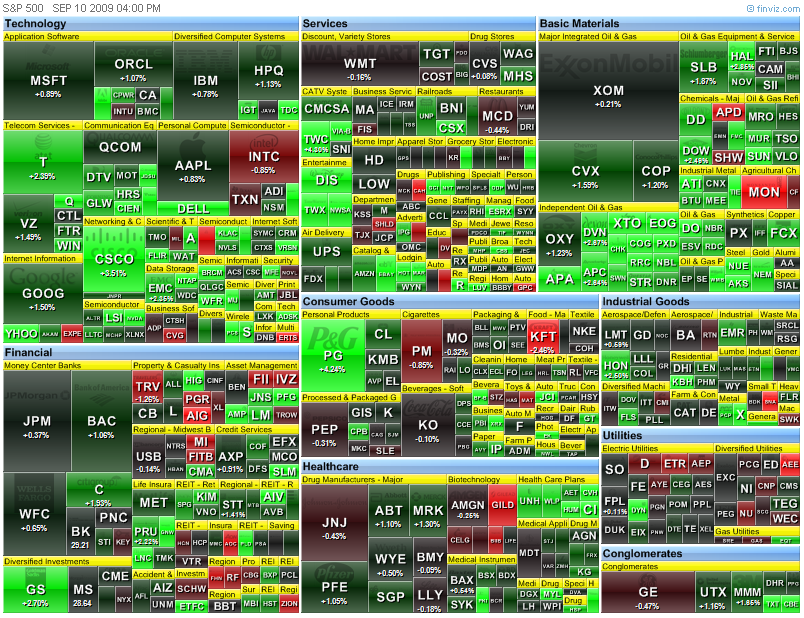
Today by sector:
 Today's heatmap:

Today's heatmap:
Wednesday, September 9, 2009
Pre-market - Wednesday, Sept 9, 2009
Futures down slightly as we wait on data this morning:
DJIA INDEX 9,488.00 -8.00
S&P 500 1,024.80 -0.30
NASDAQ 100 1,652.75 -2.50
Today's economic calendar:
MBA Purchase Applications 7:00 AM ET
ICSC-Goldman Store Sales 7:45 AM ET
Redbook 8:55 AM ET
Quarterly Services Survey 10:00 AM ET
4-Week Bill Auction 11:30 AM ET
10-Yr Note Auction 1:00 PM ET
Richard Fisher Speaks 1:30 PM ET
Beige Book 2:00 PM ET
Today's earnings reports:
Before open:
HITK Hi Tech Pharmacal Co. Inc. Healthcare Drugs - Generic
KFY Korn/Ferry International Services Staffing & Outsourcing Services
LAKE Lakeland Industries Inc. Healthcare Medical Appliances & Equipment
LRN K12, Inc. Services Education & Training Services
OHB Orleans Homebuilders Inc. Industrial Goods Residential Construction
RSC REX Stores Corp. Services Electronics Stores
RURL Rural/Metro Corp. Services Consumer Services
SIG Signet Jewelers Limited Services Jewelry Stores
TITN Titan Machinery, Inc. Services Specialty Retail, Other
TLB The Talbots Inc. Services Apparel Stores
UNFI United Natural Foods, Inc. Services Food Wholesale
ZLC Zale Corporation Services Jewelry Stores
After close:
GCOM Globecomm Systems Inc. Technology Processing Systems & Products
IRET Investors Real Estate Trust Financial REIT - Retail
MW Men's Wearhouse Inc. Services Apparel Stores
NAV Navistar International Corp. Consumer Goods Trucks & Other Vehicles
NCS NCI Building Systems Inc. Industrial Goods General Building Materials
SEH Spartech Corp. Consumer Goods Rubber & Plastics
SHFL Shuffle Master Inc. Industrial Goods Diversified Machinery
STEI Stewart Enterprises Inc. Services Personal Services
STRM Streamline Health Solutions, Inc. Technology Healthcare Information Services
SWHC Smith & Wesson Holding Corp. Industrial Goods Aerospace/Defense Products & Services
Market wrap - Tuesday, Sept 8, 2009
Dow 9,497.34 +56.07 (0.59%)
S&P 500 1,025.39 +8.99 (0.88%)
Nasdaq 2,037.77 +18.99 (0.94%)


Tuesday, September 8, 2009
Pre-market - September 8, 2009
Futures up this morning after a long weekend:
DJIA INDEX 9,502.00 85.00 9,416.00 07:01
S&P 500 1,023.80 9.90
NASDAQ 100 1,651.50 15.75
Today's economic calendar:
ICSC-Goldman Store Sales 7:45 AM ET
Redbook 8:55 AM ET
4-Week Bill Announcement 11:00 AM ET
3-Month Bill Auction 11:30 AM ET
6-Month Bill Auction 11:30 AM ET
3-Yr Note Auction 1:00 PM ET
Consumer Credit 3:00 PM ET
Todays's earnings reports:
Before market opens:
CHP C&D Technologies Inc. Technology Diversified Electronics
GIGM GigaMedia Ltd. Technology Internet Software & Services
RAIL FreightCar America Inc. Services Railroads
SFD Smithfield Foods Inc. Consumer Goods Meat Products
XIN Xinyuan Real Estate Company Ltd. Industrial Goods Residential Construction
After market closes:
ALOY Alloy Inc. Services Marketing Services
AVAV AeroVironment, Inc. Industrial Goods Aerospace/Defense Products & Services
CASY Casey's General Stores Inc. Services Grocery Stores
FCE-A Forest City Enterprises Inc. Financial Property Management
FCEL FuelCell Energy Inc. Industrial Goods Industrial Electrical Equipment
FLOW Flow International Corp. Industrial Goods Machine Tools & Accessories
MIND Mitcham Industries Inc. Services Rental & Leasing Services
NLCI Nobel Learning Communities Inc. Services Education & Training Services
PBY Pep Boys - Manny, Moe & Jack Services Auto Parts Stores
ROSG Rosetta Genomics, Ltd. Healthcare Diagnostic Substances
SB Safe Bulkers, Inc. Services Shipping
Subscribe to:
Comments (Atom)
