Friday, November 20, 2009
Pre-market - Friday, November 20, 2009
Futures down significantly on the big miss by Dell last night.
DJIA INDEX 10,256.00 -71.00
S&P 500 1,085.70 -8.60
NASDAQ 100 1,758.50 -11.75
Today's economic calendar: Nothing
Today's earnings reports.
Before open:
ANN AnnTaylor Stores Corp. Services Apparel Stores
CRMT America's Car-Mart Inc. Services Auto Dealerships
DHI DR Horton Inc. Industrial Goods Residential Construction
JOUT Johnson Outdoors Inc. Consumer Goods Sporting Goods
KIRK Kirkland's Inc. Services Home Furnishing Stores
MPR Met-Pro Corp. Industrial Goods Diversified Machinery
SJM The J. M. Smucker Company Consumer Goods Processed & Packaged Goods
After close:
None
Thursday, November 19, 2009
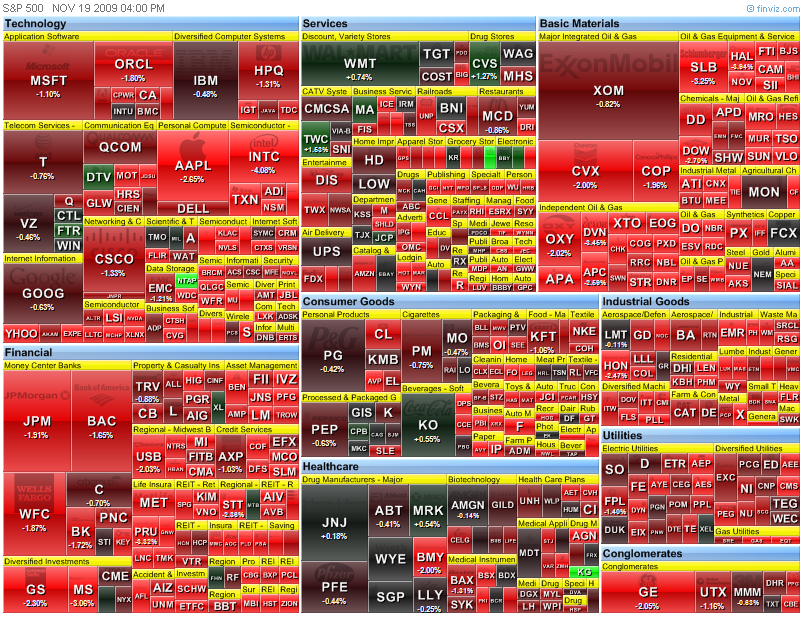
Market wrap - 4:20
The market opened lower and continued the slide through much of the morning. The best show was congress talking to Geithner, and then the Paul/Grayson bill in the Finance committee. The market rose in the afternoon as the dollar fell.
Dow 10,333 -93 -0.89%
Nasdaq 2,157 -36 -1.65%
S&P 500 1,095 -15 -1.34%
Gold 1,142 +1 +0.09%
Oil 77.67 -2.12 -2.65%
Mortgage delinquencies hit record-high in 3Q - 10:45
From Yahoo & AP
Mortgage delinquencies hit record-high in 3Q
Delinquencies and foreclosures set 9th straight record in 3rd quarter as layoffs keep rising
* By Alan Zibel, AP Real Estate Writer
* On 10:05 am EST, Thursday November 19, 2009
WASHINGTON (AP) -- More than 14 percent of American homeowners with a mortgage were either behind on their payments or in foreclosure at the end of September, a record-high for the ninth straight quarter and a problem that could threaten the economic recovery.
The Mortgage Bankers Association's report Thursday adds to fears that the housing market and broader recovery could be thwarted by the continuing surge in home loan defaults, especially as the unemployment rate keeps rising. Lost jobs, rather than the shady loans made during the housing boom, are now the main reason homeowners fall behind on their mortgages.
After three years of plunging prices, the housing market started to rebound this summer. While optimists hope the worst is over, pessimists say there are simply too many foreclosed properties that have yet to be dumped on the market and expect further price declines.
About 4 million homeowners were either in foreclosure or at least three months behind on their mortgage payments as of September, according to the mortgage bankers group. Even if a quarter of those borrowers are able to stay in their homes, "there's a lot of potential inventory coming into the market next year," said Jay Brinkmann, chief economist with the Mortgage Bankers Association.
Those foreclosures will push home prices downward, especially in the hardest-hit California and Florida cities, places that are also coping with soaring unemployment, he said.
The record-high foreclosure numbers are being driven by borrowers with traditional fixed-rate mortgages, rather than the shady subprime loans with adjustable rates that kicked off the mortgage crisis.
Fixed-rate loans made to so-called prime borrowers with good credit histories caused nearly 33 percent of new foreclosures in the July-September quarter, compared with 21 percent a year ago.
Subprime loans with adjustable rates have fallen to 16 percent of new foreclosures from 35 percent a year earlier.
Loans backed by the Federal Housing Administration also show increasing signs of trouble. More than 18 percent of FHA borrowers are at least one payment behind or in foreclosure.
Among states, the worst of the trouble is still concentrated in California, Nevada, Arizona and Florida, which accounted for 44 percent of new foreclosures in the country. Nearly 13 percent of all loans in Florida were in foreclosure, the highest in the U.S., followed by Nevada at more than 9 percent.
Philly Fed - 10:00
Full report here
November 2009 Business Outlook Survey
Activity in the region's manufacturing sector is picking up, according to firms polled for this month's Business Outlook Survey. Indexes for general activity, new orders, and shipments all improved this month. The overall level of employment was mostly steady this month, and the average work hours index was positive for the first time in more than two years. The region's manufacturing executives expect increasing activity over the next six months, although expectations have moderated somewhat in the last several months. Low rates of current capacity utilization are suppressing capital spending plans.
Indicators Suggest Activity Is Picking Up
The survey's broadest measure of manufacturing conditions, the diffusion index of current activity, increased from a reading of 11.5 in October to 16.7 this month. The index has now remained positive for four consecutive months (see Chart). The percentage of firms reporting increases in activity this month (29 percent) exceeded the percentage reporting decreases (12 percent). Other broad indicators suggest similar improvement this month. The current new orders index also remained positive for the fourth consecutive month and increased nine points. The current shipments index increased 12 points. The current inventory index, although still negative, increased 15 points, from -31.8 in October to -17.3 this month. Indexes for unfilled orders and delivery times remained negative.
Labor market conditions have been stabilizing in recent months. The current employment index increased six points, from -6.8 to near zero. The percentage of firms reporting employment increases and decreases were essentially the same this month (14 percent). The workweek index edged seven points higher in November to its first positive reading in 23 months.
Prices of Manufactured Goods Are Near Steady
Recently reported declines in prices for manufactured goods were not as widespread this month. The prices received index increased three points, to -1.5, suggesting nearly steady prices for manufactured goods this month. Still, firms continue to report higher prices for purchased inputs. The prices paid index, which had been increasing for three consecutive months, fell back six points this month, to 14.9.
Manufacturers Are Generally Optimistic
The future general activity index remained positive for the 11th consecutive month but decreased from 39.8 in September to 36.8, its lowest reading since April (see Chart). Despite lower readings in recent months, indicators of future activity remain near levels not seen since 2004. Indexes for future new orders and shipments declined this month, falling five points and nine points, respectively. For the seventh consecutive month, the percentage of firms expecting employment to increase over the next six months exceeded the percentage expecting declines (27 percent versus 19 percent).
In this month's special questions, firms were asked about their current capacity utilization and capital spending plans (see Special Questions). Over 58 percent of the firms indicated that their current capacity utilization rate was less than 70 percent; only 8 percent of firms reported utilization rates lower than 70 percent before the beginning of the recession. The percentage of firms that indicated capital spending on plant and equipment would be lower next year (41 percent) substantially exceeded the percentage that indicated capital spending would be higher (16 percent). Firms indicated, on average, that capacity utilization would need to increase to nearly 84 percent before they would be inclined to increase spending to increase capacity at their plant.
Summary
According to respondents to the November Business Outlook Survey, manufacturing conditions are improving. The survey's indicators for general activity, new orders, and shipments were higher this month. Employment was nearly flat this month, and more firms reported an increase in work hours. Firms still expect continued improvement over the next six months, although future indicators suggest that optimism has waned somewhat in recent months. Capital spending plans are being held back by low plant utilization rates.
More at link with formatted tables
Leading indicators - 10:00
Full report here
Released: Thursday, November 19, 2009
The Conference Board Leading Economic Index™ (LEI) for the U.S. increased 0.3 percent in October, following a 1.0 percent gain in September, and a 0.4 percent rise in August.
Download a PDF of the technical notes for underlying detail, diffusion indexes, components, contributions and graphs.
Download a PDF of the press release with graph and summary table.
Says Ataman Ozyildirim, Economist at The Conference Board: “After half a year of consecutive increases, the month-to-month growth of the LEI is stabilizing and the gains continue to be broad-based. Meanwhile, the coincident economic index has been essentially flat since June, after declining since November 2007. The composite indexes suggest the recovery is unfolding and economic activity should continue improving in the near term.”
Says Ken Goldstein, Economist at The Conference Board: “The data indicates that economic recovery is finally setting in. We can expect slow growth through the first half of 2010. The pace of growth, however, will depend critically on how much demand picks up, and how soon.”
The Conference Board Coincident Economic Index™ (CEI) for the U.S. was unchanged in October, following a 0.1 percent decline in September, and a 0.1 percent increase in August. The Conference Board Lagging Economic Index™ (LAG) declined 0.2 percent in October, following a 0.5 percent decline in September, and a 0.4 percent decline in August.
The next release is scheduled for December 17, 2009 at 10 A.M. ET.
Interview with Elizabeth Warren on CNBC - 9:30
Pretty good interview with Elizabeth Warren on CNBC about TARP and the economy.
Jobless claims - 8:30 am
Full report here
UNEMPLOYMENT INSURANCE WEEKLY CLAIMS REPORT
SEASONALLY ADJUSTED DATA
In the week ending Nov. 14, the advance figure for seasonally adjusted initial claims was 505,000, unchanged from the previous week's revised figure of 505,000. The 4-week moving average was 514,000, a decrease of 6,500 from the previous week's revised average of 520,500.
The advance seasonally adjusted insured unemployment rate was 4.3 percent for the week ending Nov. 7, unchanged from the prior week's unrevised rate of 4.3 percent.
The advance number for seasonally adjusted insured unemployment during the week ending Nov. 7 was 5,611,000, a decrease of 39,000 from the preceding week's revised level of 5,650,000. The 4-week moving average was 5,711,500, a decrease of 83,500 from the preceding week's revised average of 5,795,000.
The fiscal year-to-date average for seasonally adjusted insured unemployment for all programs is 5.992 million.
UNADJUSTED DATA
The advance number of actual initial claims under state programs, unadjusted, totaled 479,295 in the week ending Nov. 14, a decrease of 53,132 from the previous week. There were 513,000 initial claims in the comparable week in 2008.
The advance unadjusted insured unemployment rate was 3.7 percent during the week ending Nov. 7, a decrease of 0.1 percentage point from the prior week. The advance unadjusted number for persons claiming UI benefits in state programs totaled 4,881,874, a decrease of 79,243 from the preceding week. A year earlier, the rate was 2.6 percent and the volume was 3,521,971.
Extended benefits were available in Alabama, Alaska, Arizona, California, Colorado, Connecticut, Delaware, the District of Columbia, Florida, Georgia, Idaho, Illinois, Indiana, Kansas, Kentucky, Maine, Massachusetts, Michigan, Minnesota, Missouri, Nevada, New Hampshire, New Jersey, New Mexico, New York, North Carolina, Ohio, Oregon, Pennsylvania, Puerto Rico, Rhode Island, South Carolina, Tennessee, Texas, Vermont, Virginia, Washington, West Virginia, and Wisconsin during the week ending Oct. 31.
Initial claims for UI benefits by former Federal civilian employees totaled 2,331 in the week ending Nov. 7, a decrease of 62 from the prior week. There were 2,480 initial claims by newly discharged veterans, an increase of 199 from the preceding week.
There were 24,799 former Federal civilian employees claiming UI benefits for the week ending Oct. 31, an increase of 2,273 from the previous week. Newly discharged veterans claiming benefits totaled 34,919, an increase of 699 from the prior week.
States reported 3,622,091 persons claiming EUC (Emergency Unemployment Compensation) benefits for the week ending Oct. 31, an increase of 101,838 from the prior week. There were 772,645 claimants in the comparable week in 2008. EUC weekly claims include both first and second tier activity.
The highest insured unemployment rates in the week ending Oct. 31 were in Puerto Rico (6.1 percent), Oregon (5.5), Nevada (5.2), Alaska (5.0), California (5.0), Arkansas (4.9), Wisconsin (4.9), Michigan (4.8), Pennsylvania (4.8), and Washington (4.7).
The largest increases in initial claims for the week ending Nov. 7 were in Michigan (+6,001), New Jersey (+4,153), Pennsylvania (+3,552), New York (+3,508), and Ohio (+3,292), while the largest decreases were in Florida (-1,915), Arkansas (-734), Oregon (-274), South Carolina (-116), and West Virginia (-19).
More at link with formatted tables
Pre-market - Thursday - November 19, 2009
Futures down pretty good this morning. Important data to come out at 8:30.
DJIA INDEX 10,330.00 -74.00
S&P 500 1,098.10 -10.40
NASDAQ 100 1,785.75 -14.75
Today's economic reports:
Jobless Claims 8:30 AM ET
Leading Indicators 10:00 AM ET
Philadelphia Fed Survey 10:00 AM ET
EIA Natural Gas Report 10:30 AM ET
3-Month Bill Announcement 11:00 AM ET
6-Month Bill Announcement 11:00 AM ET
2-Yr Note Announcement 11:00 AM ET
5-Yr Note Announcement 11:00 AM ET
7-Yr Note Announcement 11:00 AM ET
Money Supply4:30 PM ET
Today's earnings reports.
Before open:
BKE Buckle Inc. Services Apparel Stores
BONT Bon-Ton Stores Inc. Services Department Stores
BRC Brady Corp. Services Business Services
CATO Cato Corp. Services Apparel Stores
CMED China Medical Technologies Inc. Healthcare Medical Instruments & Supplies
CMRG Casual Male Retail Group, Inc. Services Apparel Stores
DKS Dick's Sporting Goods Inc. Services Sporting Goods Stores
DWCH Datawatch Corp. Technology Business Software & Services
GME GameStop Corp. Services Electronics Stores
HP Helmerich & Payne Inc. Basic Materials Oil & Gas Drilling & Exploration
IGLD Internet Gold Golden Lines Ltd. Technology Diversified Communication Services
KLIC Kulicke & Soffa Industries Inc. Technology Semiconductor Equipment & Materials
NJR New Jersey Resources Corp. Utilities Gas Utilities
NWY New York & Company Inc. Services Apparel Stores
PDCO Patterson Companies Inc. Services Medical Equipment Wholesale
PLCE The Children's Place Retail Stores, Inc. Services Apparel Stores
RAVN Raven Industries Inc. Technology Printed Circuit Boards
ROST Ross Stores Inc. Services Apparel Stores
SBH Sally Beauty Holdings Inc. Services Specialty Retail, Other
SCHS School Specialty Inc. Services Wholesale, Other
SCMR Sycamore Networks Inc. Technology Networking & Communication Devices
SCVL Shoe Carnival Inc. Services Apparel Stores
SHLD Sears Holdings Corporation Services Department Stores
SI Siemens AG Technology Telecom Services - Foreign
SMRT Stein Mart Inc. Services Apparel Stores
SSI Stage Stores Inc. Services Apparel Stores
STP Suntech Power Holdings Co. Ltd. Technology Diversified Electronics
TDG TransDigm Group Incorporated Industrial Goods Aerospace/Defense Products & Services
TSL Trina Solar Ltd. Technology Semiconductor - Specialized
TWMC Trans World Entertainment Corporation Services Music & Video Stores
WSM Williams-Sonoma Inc. Services Home Furnishing Stores
After market closes:
ADCT ADC Telecommunications Inc. Technology Communication Equipment
APWR A-Power Energy Generation Systems, Ltd. Utilities Electric Utilities
ARUN Aruba Networks, Inc. Technology Computer Peripherals
BAMM Books-A-Million Inc. Services Specialty Retail, Other
CENT Central Garden & Pet Co. Services Wholesale, Other
CHRD Chordiant Software, Inc. Technology Technical & System Software
DBRN Dress Barn Inc. Services Apparel Stores
DELL Dell Inc. Technology Personal Computers
EFUT e-Future Information Technology Inc. Technology Business Software & Services
FL Foot Locker Inc. Services Apparel Stores
GFF Griffon Corporation Industrial Goods General Building Materials
GPS Gap Inc. Services Apparel Stores
HIBB Hibbett Sports, Inc. Services Sporting Goods Stores
INTU Intuit Inc. Technology Application Software
MTSC MTS Systems Corp. Technology Scientific & Technical Instruments
OHB Orleans Homebuilders Inc. Industrial Goods Residential Construction
OMER Omeros Corporation Healthcare Drug Manufacturers - Major
TSCM TheStreet.com, Inc. Technology Internet Information Providers
VRGY Verigy, Ltd. Technology Semiconductor Equipment & Materials
WTSLA Wet Seal Inc. Services Apparel Stores
ZUMZ Zumiez, Inc. Services Apparel Stores
Wednesday, November 18, 2009
Market wrap - 4:30
Just a slow no volume day - again.
Dow 10,426 -11 -0.11%
Nasdaq 2,193 -11 -0.48%
S&P 500 1,110 -1 -0.05%
Gold 1,141 +2 +0.17%
Oil 79.74 0.44 0.56%


Housing starts - 8:30
Full report here
NEW RESIDENTIAL CONSTRUCTION IN OCTOBER 2009
The U.S. Census Bureau and the Department of Housing and Urban Development jointly announced the following new residential construction statistics for October 2009:
BUILDING PERMITS
Privately-owned housing units authorized by building permits in October were at a seasonally adjusted annual rate of 552,000. This is 4.0 percent (±1.9%) below the revised September rate of 575,000 and is 24.3 percent (±1.9%) below the October 2008
estimate of 729,000. Single-family authorizations in October were at a rate of 451,000; this is 0.2 percent (±1.0%)* below the revised September figure of
452,000. Authorizations of units in buildings with five units or more were at a rate of 85,000 in October.
HOUSING STARTS
Privately-owned housing starts in October were at a seasonally adjusted annual rate of 529,000. This is 10.6 percent (±8.7%) below the revised September estimate of 592,000 and is 30.7 percent (±8.3%) below the October 2008 rate of 763,000. Single-family housing starts in October were at a rate of 476,000; this is 6.8 percent (±7.5%)* below the revised September figure of 511,000. The October rate for units in buildings with five units or more was 48,000.
HOUSING COMPLETIONS
Privately-owned housing completions in October were at a seasonally adjusted annual rate of 740,000. This is 1.9 percent (±12.4%)* above the revised September estimate of 726,000, but is 29.9 percent (±9.7%) below the October 2008 rate of 1,055,000.
Single-family housing completions in October were at a rate of 528,000; this is 10.7 percent (±14.5%)* above the revised September figure of 477,000. The October rate for units in buildings with five units or more was 200,000.
CPI - 8:30
Full report here
Consumer Price Index - October 2009
On a seasonally adjusted basis, the Consumer Price Index for All
Urban Consumers (CPI-U) rose 0.3 percent in October, the U.S. Bureau
of Labor Statistics reported today. The index has decreased 0.2
percent over the last 12 months on a not seasonally adjusted basis.
The seasonally adjusted all items increase largely reflected advances
in the indexes for energy and for new and used motor vehicles. The
energy index rose for the fifth time in the last six months,
advancing 1.5 percent as the indexes for gasoline, fuel oil, natural
gas, and electricity all increased. The index for all items less food
and energy rose 0.2 percent in October, the same increase as in
September. The indexes for used cars and trucks and for new vehicles
both rose sharply and together they accounted for over 90 percent of
the increase in the index for all items less food and energy. The
indexes for airline fares and medical care also increased, while the
shelter index was unchanged and the indexes for apparel and
recreation declined.
The food index also increased in October, rising 0.1 percent after
declining in two of the previous three months. The index for food
away from home increased slightly, while the food at home index was
unchanged. Within the food at home group, the index for dairy and
related products rose significantly, while the fruits and vegetables
index declined for the fourth straight month.
Consumer Price Index Data for October 2009
Food
The food index rose 0.1 percent in October after declining 0.1
percent in September. The index for food away from home increased 0.1
percent while the food at home index was unchanged. Within the food
at home group, the index for dairy and related products rose 1.0
percent in October after a 0.5 percent increase in September, and the
index for other food at home advanced 0.3 percent. These increases
were offset by a 0.7 percent decline in the fruits and vegetables
index and 0.2 percent decreases in the indexes for meats, poultry,
fish, and eggs and for nonalcoholic beverages. The index for cereals
and bakery products was unchanged in October. Over the past 12
months, the food index has declined 0.6 percent with the food at home
index down 2.8 percent.
Energy
The energy index rose 1.5 percent in October after increasing 0.6
percent in September. The index for energy commodities rose 1.9
percent, with the gasoline index increasing 1.6 percent. (Before
seasonal adjustment, gasoline prices fell 0.8 percent in October.)
The index for fuel oil rose 6.3 percent. The index for energy
services, which increased 0.1 percent in September, rose 0.9 percent
in October. The electricity index increased 0.6 percent while the
index for natural gas rose 1.9 percent in October after declining 1.7
percent in September. Over the past 12 months, the energy index has
fallen 14.0 percent with the gasoline index declining 17.9 percent.
All items less food and energy
The index for all items less food and energy rose 0.2 percent in
October, the same increase as in September. Most of the advance was
due to increases in transportation indexes. The new vehicles index
rose 1.6 percent and the index for used cars and trucks rose 3.4
percent, its third consecutive substantial increase. The index for
airline fares rose for the fourth straight month, increasing 1.7
percent in October. Outside of the transportation group, the changes
within all items less food and energy were largely modest. The
medical care index rose 0.2 percent in October after increasing 0.4
percent in September. The shelter index was unchanged in October, as
it was in September. The rent index decreased 0.1 percent, the index
for owners' equivalent rent was unchanged, and the index for lodging
away from home rose 0.4 percent. Posting declines in October were the
indexes for recreation and apparel, which both fell 0.4 percent. For
the past 12 months, the index for all items less food and energy has
risen 1.7 percent.
Not seasonally adjusted CPI measures
The Consumer Price Index for All Urban Consumers (CPI-U) decreased
0.2 percent over the last 12 months to an index level of 216.177
(1982-84=100). For the month, the index increased 0.1 percent prior
to seasonal adjustment.
The Consumer Price Index for Urban Wage Earners and Clerical Workers
(CPI-W) decreased 0.3 percent over the last 12 months to an index
level of 211.549 (1982-84=100). For the month, the index increased
0.1 percent prior to seasonal adjustment.
The Chained Consumer Price Index for All Urban Consumers (C-CPI-U)
decreased 0.5 percent over the last 12 months. For the month, the
index increased 0.1 percent on a not seasonally adjusted basis.
Please note that the indexes for the post-2007 period are subject to
revision.
More at link with formatted tables
Pre-market - 8:15
Futures up slightly this morning.
DJIA INDEX 10,409.00 11.00
S&P 500 1,108.80 1.40
NASDAQ 100 1,808.75 0.00
Today's economic reports:
MBA Purchase Applications 7:00 AM ET
Consumer Price Index 8:30 AM ET
Housing Starts 8:30 AM ET
EIA Petroleum Status Report 10:30 AM ET
Today's earnings reports:
Before open:
BJ BJ's Wholesale Club Inc. Services Discount, Variety Stores
CHS Chico's FAS Inc. Services Apparel Stores
CSUN China Sunergy Co. Ltd. Technology Semiconductor - Integrated Circuits
DHT DHT Maritime, Inc. Services Shipping
ESLT Elbit Systems Ltd. Industrial Goods Aerospace/Defense Products & Services
GU Gushan Environmental Energy Limited Basic Materials Specialty Chemicals
NM Navios Maritime Holdings Inc. Services Shipping
PERY Perry Ellis International Inc. Consumer Goods Textile - Apparel Clothing
SMLC 012 Smile.Communications Ltd. Technology Diversified Communication Services
SOLF Solarfun Power Holdings Co. Ltd. Technology Semiconductor - Specialized
VVTV ValueVision Media Inc. Services Catalog & Mail Order Houses
After close:
CYBX Cyberonics Inc. Healthcare Medical Appliances & Equipment
DCI Donaldson Company Inc. Industrial Goods Pollution & Treatment Controls
GYMB Gymboree Corp. Services Apparel Stores
HOTT Hot Topic Inc. Services Apparel Stores
JACK Jack in the Box Inc. Services Restaurants
LTD Limited Brands Inc. Services Apparel Stores
NTAP NetApp, Inc. Technology Data Storage Devices
NTES Netease.com Inc. Technology Internet Information Providers
PETM Petsmart Inc. Services Specialty Retail, Other
PNNT Pennantpark Investment Corp. Financial Diversified Investments
PVH Phillips-Van Heusen Corp. Consumer Goods Textile - Apparel Clothing
SMTC Semtech Corp. Technology Semiconductor - Integrated Circuits
WGOV Woodward Governor Co. Industrial Goods Industrial Electrical Equipment
Tuesday, November 17, 2009
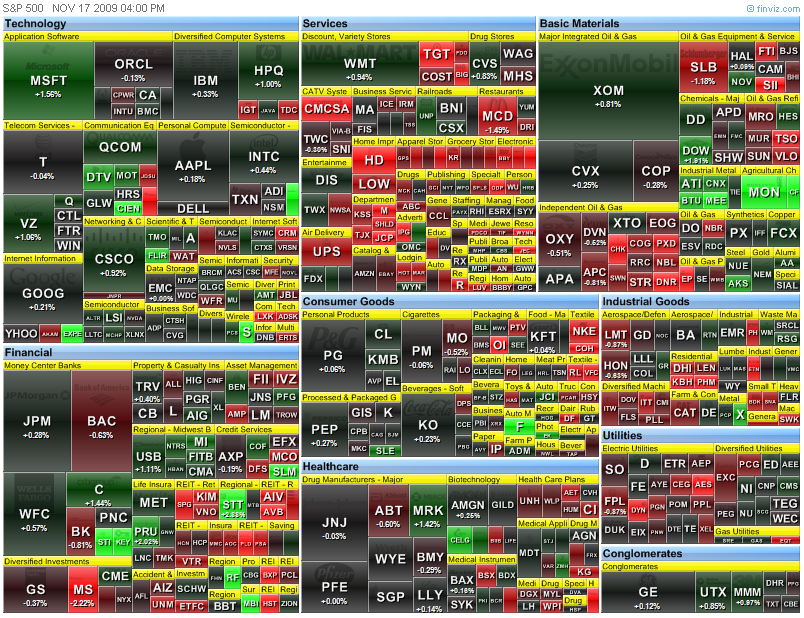
Market wrap - late - 6:40
Pretty much a draw today between the Bears and the Bulls. Volume very low.
Dow 10,437 30 0.29%
Nasdaq 2,204 6 0.27%
S&P 500 1,110 1 0.09%
Gold 1,139 0 0.00%
Oil 79.40 +0.23 +0.29%

Producer price index - 8:30
Full report here
The Producer Price Index for Finished Goods advanced 0.3 percent in October, easonally adjusted, the U.S. Bureau of Labor Statistics reported today. This increase followed a 0.6-percent decline in September and a 1.7-percent rise in August. In October, at the earlier stages of processing, prices received by manufacturers of intermediate goods moved up 0.3 percent and the crude goods index increased 5.4 percent. On an unadjusted basis, from October 2008 to October 2009, prices for finished goods fell 1.9 percent, the eleventh consecutive month of year-over-year declines. (See table A.)
See link for table A
Finished goods
The October increase in the index for finished goods can be attributed to higher prices for energy and food, both of which moved up 1.6 percent. By contrast, prices for finished goods other than foods and energy declined 0.6 percent.
Finished energy: The index for finished energy goods advanced 1.6 percent in October compared with a 2.4-percent drop in the previous month. Almost half of the increase can be traced to the gasoline index, which climbed 1.9 percent. Rising prices for residential electric power and liquefied petroleum gas also contributed to the advance in the finished energy goods index. (See table 2.)
Finished foods: Finished consumer food prices rose 1.6 percent in October after edging down 0.1 percent a month earlier. Accounting for about half of the increase, the index for fresh and dry vegetables jumped 24.2 percent. Higher prices for fresh fruits and melons also contributed to the advance in the finished consumer foods index.
Finished core: In October, the index for finished goods less foods and energy moved down 0.6 percent, its second consecutive decrease. Lower prices for light motor trucks and passenger cars led the October decline, falling 5.2 percent and 0.5 percent, respectively. In accordance with usual practice, most new-model-year passenger cars and light motor trucks were introduced into the PPI in October. (See Report on Quality Changes for 2010 Model Vehicles, USDL 09-1400.)
Intermediate goods
The Producer Price Index for Intermediate Materials, Supplies, and Components moved up 0.3 percent in October, its third straight monthly advance. The October rise can be traced to higher prices for intermediate energy goods, which climbed 2.3 percent. By contrast, the indexes for both intermediate goods less foods and energy and for intermediate foods and feeds decreased 0.2 percent. On a 12-month basis, prices for intermediate goods fell 7.5 percent in October. This is the third consecutive month of slowing year-over-year declines following a record 15.1-percent drop for the 12 months ended July 2009. (See table B.)
Intermediate energy: The index for intermediate energy goods advanced 2.3 percent in October after falling 2.1 percent in September. About one-fifth of this increase can be traced to a 5.5-percent rise in diesel fuel prices. Higher prices for natural gas to electric utilities and commercial electric power also contributed to the advance in the intermediate energy goods index. (See table 2.)
Crude goods
The Producer Price Index for Crude Materials for Further Processing increased 5.4 percent in October after falling 2.1 percent in September. For the 3-month period ending in October, crude material prices rose 7.1 percent after advancing 4.1 percent in the 3 months ending in July. The monthly October rise was broad based, with prices for crude energy materials jumping 8.3 percent, the index for crude foodstuffs and feedstuffs moving up 5.2 percent, and prices for crude nonfood materials less energy increasing 0.5 percent. (See table B.)
Crude energy: The index for crude energy materials increased 8.3 percent in October. From July to October, this index rose 9.5 percent, compared with an 11.8-percent rise in the 3 months ending in July. Accounting for about sixty percent of the monthly October increase, the natural gas index moved up 16.3 percent. Higher prices for both crude petroleum and coal also contributed to the advance in the crude energy materials index. (See table 2.)
Crude foods: The index for crude foodstuffs and feedstuffs increased 5.2 percent in October. This index moved up 2.4 percent in the most recent 3-month period compared with a 6.0-percent decline in the previous 3-month period. In October, a 9.0-percent rise in the grains index led the advance in the crude foodstuffs and feedstuffs index. Higher prices for slaughter poultry were also a factor in this increase.
Crude core: The index for crude nonfood materials less energy rose 0.5 percent in October, and 10.4 percent for the 3 months ending in October. Similarly, for the 3 months ending in July, prices climbed 10.8 percent. A major contributor to the monthly October increase was the gold ores index, which rose 5.4 percent.
See link for table B
Services Analysis
Trade industries: The Producer Price Index for the Net Output of Total Trade Industries was unchanged in October after falling in each of the previous three months. (Trade indexes measure changes in margins received by wholesalers and retailers.) In October, higher margins received by merchant wholesalers of nondurable goods and new car dealers were offset by lower margins received by merchant wholesalers of durable goods and gasoline stations with convenience
stores.
Transportation and warehousing industries: The Producer Price Index for the Net Output of Total Transportation and Warehousing Industries moved up 0.6 percent in October following a 0.7-percent decline in September. About two-thirds of this advance can be attributed to a 2.8-percent increase in prices received by the industry for scheduled passenger air transportation. The industry indexes for couriers and line-haul railroads also rose in October.
Traditional service industries: The Producer Price Index for the Net Output of Total
Traditional Service Industries advanced 0.5 percent in October after declining 0.2 percent in September. Leading this upturn, prices received by the commercial banking industry moved up 2.0 percent. The industry indexes for general medical and surgical hospitals and for investment banking and securities dealing also advanced in October.
Pre-market - Tuesday, November 17, 2009
Futures flat this morning on a rise in the dollar.
DJIA INDEX 10,363.00 -5.00
S&P 500 1,105.60 -0.70
NASDAQ 100 1,802.50 -1.00
ICSC-Goldman Store Sales 7:45 AM ET
Producer Price Index 8:30 AM ET
Redbook 8:55 AM ET
Treasury International Capital 9:00 AM ET
Industrial Production 9:15 AM ET
Jeffrey Lacker Speaks 10:00 AM ET
4-Week Bill Auction 11:30 AM ET
52-Week Bill Auction 11:30 AM ET
Housing Market Index 1:00 PM ET
Today's earnings reports:
ATV Acorn International, Inc. Services Catalog & Mail Order Houses
COV Covidien plc Healthcare Medical Instruments & Supplies
CPSL China Precision Steel, Inc. Basic Materials Steel & Iron
CSIQ Canadian Solar Inc. Technology Semiconductor - Specialized
DDS Dillard's Inc. Services Department Stores
EDAP EDAP TMS SA Healthcare Medical Appliances & Equipment
GASS StealthGas, Inc. Services Shipping
HD The Home Depot, Inc. Services Home Improvement Stores
ITRN Ituran Location & Control Ltd. Services Electronics Wholesale
JEC Jacobs Engineering Group Inc. Services Technical Services
JST Jinpan International Ltd. Technology Diversified Electronics
KEI Keithley Instruments Inc. Technology Scientific & Technical Instruments
MPEL Melco Crown Entertainment Ltd. Services Resorts & Casinos
SKS Saks Incorporated Services Department Stores
TGT Target Corp. Services Discount, Variety Stores
TJX The TJX Companies, Inc. Services Department Stores
WX WuXi PharmaTech (Cayman) Inc. Healthcare Drug Manufacturers - Major
After close:
ADSK Autodesk, Inc. Technology Technical & System Software
ALOT Astro-Med Inc. Technology Computer Peripherals
CNQR Concur Technologies, Inc. Technology Technical & System Software
CRM Salesforce.com Technology Application Software
DL China Distance Education Holdings Limited Services Education & Training Services
EJ E-House (China) Holdings Limited Financial Property Management
HNSN Hansen Medical, Inc. Healthcare Medical Appliances & Equipment
LZB La-Z-Boy Inc. Consumer Goods Home Furnishings & Fixtures
PCYO Pure Cycle Corp. Industrial Goods Heavy Construction
PLNR Planar Systems Inc. Technology Computer Peripherals
SNS Steak n Shake Co. Services Restaurants
VIT VanceInfo Technologies Inc. Technology Business Software & Services
Monday, November 16, 2009
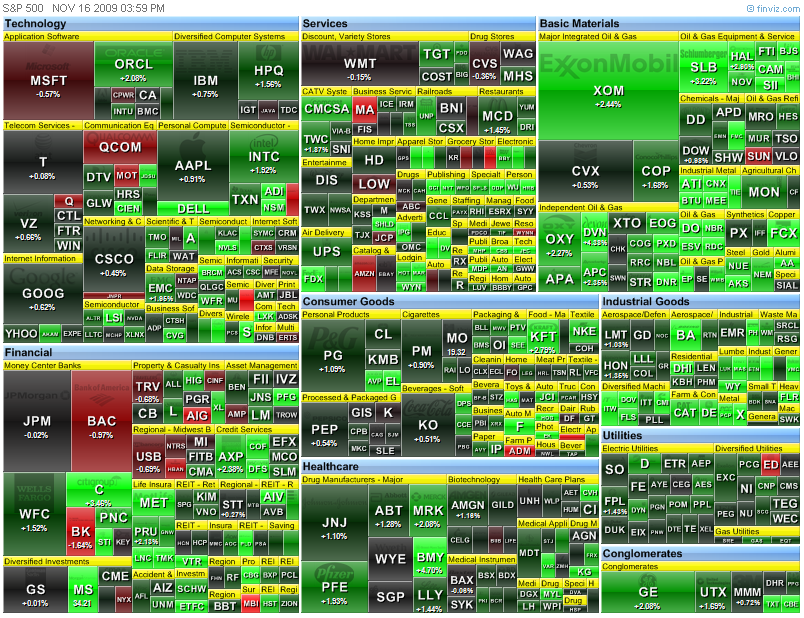
Market wrap - 4:10
The rally today started at the open and ran up all day. At the same time, the dollar was falling. Until late in the day, the dollar turned around a bit, but it finding the 75 level as resistance now, and not support. As the dollar goes, so goes the market. Trade accordingly.
Dow 10,406 +136 +1.32%
Nasdaq 2,198 30 1.38%
S&P 500 1,109 16 1.45%
Gold 1,139 +23 +2.03%
Oil 78.81 2.55 3.34%

I hope to have a Meredith Whitney and a Peter Shiff interview once they get posted on CNBC. The Whitney interview is a must see, but Shiff is on Fast Money so I'm confident they will screw it up. They are perma bull pump monkey's and Shiff is a perma bear. Fast Money does have the ability to shut you off, and they most certainly will on Shiff.
I hope to have a Meredith Whitney and a Peter Shiff interview once they get posted on CNBC. The Whitney interview is a must see, but Shiff is on Fast Money so I'm confident they will screw it up. They are perma bull pump monkey's and Shiff is a perma bear. Fast Money does have the ability to shut you off, and they most certainly will on Shiff.
Business inventories - 10:00
Full report here
 MANUFACTURING AND TRADE INVENTORIES AND SALES
September 2009
Sales. The U.S. Census Bureau announced today that the combined value of distributive trade sales and manufacturers’ shipments for September, adjusted for seasonal and trading-day differences but not for price changes, was estimated at $988.0 billion, down 0.3 percent (±0.3%)* from August 2009 and down 13.1 percent (±0.6%) from September 2008.
Inventories. Manufacturers’ and trade inventories, adjusted for seasonal variations but not for price changes, were estimated at an end-of-month level of $1,303.4 billion, down 0.4 percent (±0.1%) from August 2009 and down 13.4 percent (±0.3%) from September 2008.
Inventories/Sales Ratio. The total business inventories/sales ratio based on seasonally adjusted data at the end of September was 1.32. The September 2008 ratio was 1.32.
MANUFACTURING AND TRADE INVENTORIES AND SALES
September 2009
Sales. The U.S. Census Bureau announced today that the combined value of distributive trade sales and manufacturers’ shipments for September, adjusted for seasonal and trading-day differences but not for price changes, was estimated at $988.0 billion, down 0.3 percent (±0.3%)* from August 2009 and down 13.1 percent (±0.6%) from September 2008.
Inventories. Manufacturers’ and trade inventories, adjusted for seasonal variations but not for price changes, were estimated at an end-of-month level of $1,303.4 billion, down 0.4 percent (±0.1%) from August 2009 and down 13.4 percent (±0.3%) from September 2008.
Inventories/Sales Ratio. The total business inventories/sales ratio based on seasonally adjusted data at the end of September was 1.32. The September 2008 ratio was 1.32.
Retail Sales - 8:30
Full report here
The U.S. Census Bureau announced today that advance estimates of U.S. retail and food services sales for October, adjusted for seasonal variation and holiday and trading-day differences, but not for price changes, were $347.5 billion, an increase of 1.4 percent (±0.5%) from the previous month, but 1.7 percent (±0.5%) below October 2008. Total sales for the August through October 2009 period were up 1.5 percent (±0.3%) from the same period a year ago. The August to September 2009 percent change was revised from -1.5 percent (±0.5%) to -2.3 percent (±0.3%).
Retail trade sales were up 1.4 percent (±0.7%) from September 2009, but 2.1 percent (±0.5%) below last year. Gasoline stations sales were down 15.0 percent (±1.3%) from October 2008 and building material and garden equipment and supplies dealers were down 15.0 percent (±1.8%) from last year.
More info at link with formatted tables
Pre-market - Monday, November 16,2009
Futures up on good news out of Japan.
DJIA INDEX 10,310.00 68.00
S&P 500 1,100.60 9.20
NASDAQ 100 1,798.25 10.00
Today's economic calendar:
Retail Sales 8:30 AM ET
Empire State Mfg Survey 8:30 AM ET
Business Inventories 10:00 AM ET
4-Week Bill Announcement 11:00 AM ET
3-Month Bill Auction 11:30 AM ET
6-Month Bill Auction 11:30 AM ET
Ben Bernanke Speaks 12:00 PM ET
Today's earnings reports:
Before market opens:
ADES ADA-ES, Inc. Industrial Goods Pollution & Treatment Controls
ADY American Dairy Inc. Consumer Goods Dairy Products
CAEI China Architectural Engineering, Inc. Industrial Goods General Contractors
COWN Cowen Group Inc. Financial Investment Brokerage - National
CYPB Cypress Bioscience, Inc. Healthcare Biotechnology
ESEA Euroseas, Ltd. Services Shipping
FLML Flamel Technologies SA Healthcare Drug Delivery
FREE FreeSeas Inc. Services Shipping
FTK Flotek Industries Inc. Basic Materials Specialty Chemicals
HAST Hastings Entertainment Inc. Services Music & Video Stores
KHD KHD Humboldt Wedag International Ltd. Services Industrial Equipment Wholesale
LOW Lowe's Companies Inc. Services Home Improvement Stores
NSSC Napco Security Technologies, Inc. Services Security & Protection Services
ORBK Orbotech Ltd. Technology Scientific & Technical Instruments
PWRD Perfect World Co., Ltd. Technology Application Software
SCR Simcere Pharmaceutical Group. Healthcare Drug Manufacturers - Other
SIHI SinoHub, Inc. Services Electronics Wholesale
SOL ReneSola Ltd. Technology Semiconductor - Integrated Circuits
WX WuXi PharmaTech (Cayman) Inc. Healthcare Drug Manufacturers - Major
ZSTN ZST Digital Networks, Inc. Technology Communication Equipment
After market closes:
ADAT Authentidate Holding Corp. Technology Internet Software & Services
ADG Allied Defense Group Inc. Industrial Goods Aerospace/Defense Products & Services
AGO Assured Guaranty Ltd. Financial Life Insurance
AOB American Oriental Bioengineering Inc. Healthcare Biotechnology
CDCS CDC Software Corporation Technology Application Software
CHINA CDC Corp. Technology Internet Software & Services
DMC Document Security Systems Inc. Services Security & Protection Services
ERI Emrise Corp. Industrial Goods Aerospace/Defense Products & Services
FC Franklin Covey Co. Consumer Goods Office Supplies
FMCN Focus Media Holding Ltd. Services Advertising Agencies
LFT Longtop Financial Technologies Limited Technology Business Software & Services
NAK Northern Dynasty Minerals Ltd. Basic Materials Gold
PSUN Pacific Sunwear of California Inc. Services Apparel Stores
RGDX Response Genetics, Inc Healthcare Diagnostic Substances
SINA Sina Corp. Technology Internet Software & Services
SPRD Spreadtrum Communications Inc. Technology Semiconductor - Broad Line
ZOOM ZOOM Technologies Inc. Technology Communication Equipment
Subscribe to:
Comments (Atom)
