Friday, August 21, 2009
Strong Gain in Existing-Home Sales Maintains Uptrend -10:10am
Strong Gain in Existing-Home Sales Maintains Uptrend - Full report here
Washington, August 21, 2009
For the first time in five years, existing-home sales have increased for four months in a row, according to the National Association of Realtors®.
Existing-home sales – including single-family, townhomes, condominiums and co-ops – rose 7.2 percent to a seasonally adjusted annual rate1 of 5.24 million units in July from a level of 4.89 million in June, and are 5.0 percent above the 4.99 million-unit pace in July 2008. The last time sales rose for four consecutive months was in June 2004, and the last time sales were higher than a year earlier was November 2005.
Lawrence Yun, NAR chief economist, said he is encouraged. “The housing market has decisively turned for the better. A combination of first-time buyers taking advantage of the housing stimulus tax credit and greatly improved affordability conditions are contributing to higher sales,” he said.
The monthly sales gain was the largest on record for the total existing-home sales series dating back to 1999.
“Because price-to-income ratios have fallen below historical trends, there are more all-cash offers. In some recovering markets like San Diego, Las Vegas, Phoenix, and Orlando, the demand for foreclosed and lower priced homes has spiked, and a lack of inventory is becoming a common complaint,” Yun said.
According to Freddie Mac, the national average commitment rate for a 30-year, conventional, fixed-rate mortgage fell to 5.22 percent in July from 5.42 percent in June; the rate was 6.43 percent in July 2008.
An NAR practitioner survey showed first-time buyers purchased 30 percent of homes in July, and that distressed homes accounted for 31 percent of transactions.
NAR President Charles McMillan, a broker with Coldwell Banker Residential Brokerage in Dallas-Fort Worth, said the first-time buyer tax credit is working. “In addition to first-time buyers, we’re also seeing increased activity by repeat buyers. While many entry-level buyers are focused on the discounted prices of distressed homes, they’re also freeing some existing owners to sell and make a move,” he said.
“Realtors® are the best resource for consumers in these changing market conditions because the transaction process has become more complex. Since it’s now taking longer to complete a home sale, first-time buyers who want to take advantage of the $8,000 tax credit should try to make contract offers by the end of September,” McMillan said. “Otherwise, they may miss the November 30 closing deadline.”
Total housing inventory at the end of July rose 7.3 percent to 4.09 million existing homes available for sale, which represents a 9.4-month supply2 at the current sales pace, which was unchanged from June because of the strong sales gain. Raw inventory totals are 10.6 percent lower than a year ago when the number of unsold homes was at a record.
The national median existing-home price3 for all housing types was $178,400 in July, which is 15.1 percent lower than July 2008. Distressed properties continue to weigh down the median price because they typically sell for 15 to 20 percent less than traditional homes.
Single-family home sales increased 6.5 percent to a seasonally adjusted annual rate of 4.61 million in July from a pace of 4.33 million in June, and are 5.0 percent higher than the 4.39 million-unit level in July 2008. The median existing single-family home price was $178,300 in July, which is 14.6 percent below a year ago.
Existing condominium and co-op sales jumped 12.5 percent to a seasonally adjusted annual rate of 630,000 units in July from 560,000 in June, and are 5.9 percent above the 595,000-unit level a year ago. The median existing condo price4 was $178,800 in July, down 18.9 percent from July 2008.
Regionally, existing-home sales in the Northeast surged 13.4 percent to an annual pace of 930,000 in July, and are 3.3 percent higher than July 2008. The median price in the Northeast was $236,700, down 15.0 percent from a year ago.
Existing-home sales in the Midwest jumped 10.9 percent in July to a level of 1.22 million and are 8.0 percent above a year ago. The median price in the Midwest was $157,200, which is 5.9 percent less than July 2008.
In the South, existing-home sales rose 7.1 percent to an annual pace of 1.95 million in July and are 5.4 percent higher than July 2008. The median price in the South was $164,500, down 7.1 percent from a year ago.
Existing-home sales in the West slipped 1.7 percent to an annual rate of 1.13 million in July, but are 1.8 percent above a year ago. The median price in the West was $202,300, which is 28.0 percent below July 2008.
The National Association of Realtors®, “The Voice for Real Estate,” is America’s largest trade association, representing 1.2 million members involved in all aspects of the residential and commercial real estate industries.
Pre-market - August 21, 2009
Futures up this last day of the week and option expiration Friday:
DJIA INDEX 9,364.00 44.00
S&P 500 1,010.70 6.00 1,004.50
NASDAQ 100 1,619.75 5.75
Gold 942 -3 -0.33%
Oil 72.35 0.12 0.17%
Today's economic calendar:
Existing Home Sales 10:00 AM ET
Ben Bernanke Speaks 10:00 AM ET
Today's earnings reports:
Before open:
ANN AnnTaylor Stores Corp. Services Apparel Stores
MPR Met-Pro Corp. Industrial Goods Diversified Machinery
PCAP Patriot Capital Funding, Inc. Financial Closed-End Fund - Debt
SJM The J. M. Smucker Company Consumer Goods Processed & Packaged Goods
After close: None
Market wrap - a day late again - 8:00am
The market didn't get much good news this morning, but it shook that off and drove higher.
Dow 9,350.05 +70.89 (0.76%)
S&P 500 1,007.37 +10.91 (1.09%)
Nasdaq 1,989.22 +19.98 (1.01%)
Today by sector:
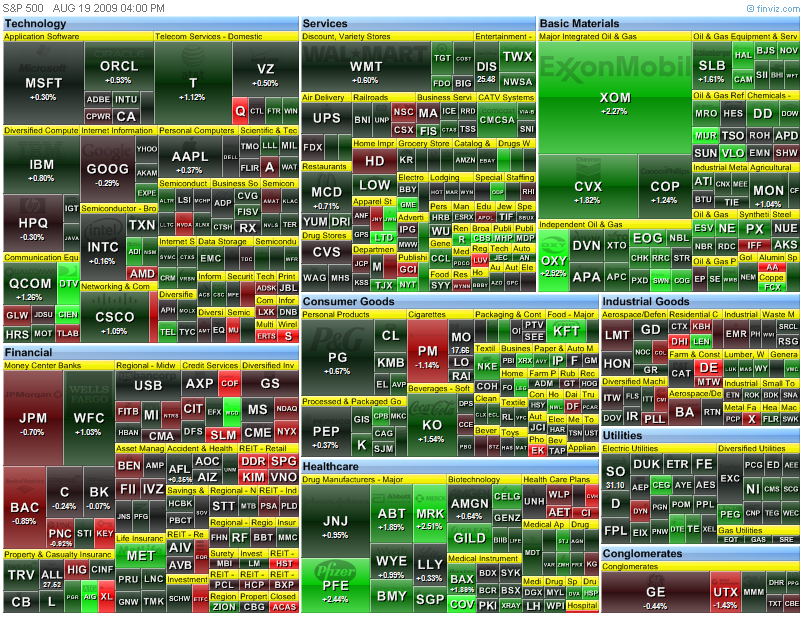
 Today's heatmap:
 Today's heatmap:
Today's heatmap:
Today's heatmap:
Thursday, August 20, 2009
Philadelphia Fed Survey
Full report here
August 2009 Business Outlook Survey
The region's manufacturing sector is showing some signs of stabilizing, according to firms polled for this month's Business Outlook Survey. Indexes for general activity, new orders, and shipments all registered slightly positive readings this month. Although firms reported continued declines in employment and work hours this month, losses were not as widespread. Most of the survey's broad indicators of future activity continued to suggest that the region's manufacturing executives expect business activity to increase over the next six months.
Current Indicators Suggest Improvement
The survey's broadest measure of manufacturing conditions, the diffusion index of current activity, increased from -7.5 in July to 4.2 this month. This is the highest reading of the index since November 2007 (see Chart). The percentage of firms reporting increases in activity (27 percent) was slightly higher than the percentage reporting decreases (23 percent). Other broad indicators also suggested improvement. The current new orders index edged six points higher, from -2.2 to 4.2, also its highest reading since November 2007. The current shipments index increased 10 points, to a slightly positive reading.
Labor market conditions remain weak. Firms continue to report declines in employment and work hours, but overall job losses were not as large this month. The current employment index increased from a weak reading of -25.3 to -12.9, its highest level in 11 months. Twenty-three percent of firms reported declines in employment this month, down from 30 percent in the previous month. Although the workweek index remained negative, the index increased nine points, to -6.3.
Price Indexes Rise, But Output Prices Remain Steady
For the first time in 10 months, more firms reported higher input prices than reported lower prices. The prices paid index rose 14 points, to a reading of 10.0, its first positive reading since last October. The same manufacturers, however, reported near-steady prices for their own final goods. Nearly 75 percent of the firms reported steady prices this month, while 13 percent reported price decreases and 12 percent reported increases. The prices received index increased 20 points, from -21.5 to -1.5, its highest reading since last October.
Outlook Remains Optimistic
Indicators of future activity improved slightly this month and continued to suggest that firms are expecting better conditions over the next six months. The future general activity index remained positive for the eighth consecutive month and increased from 51.9 in July to 56.8 (see Chart). Indexes for future new orders and shipments also edged slightly higher this month. For the fourth consecutive month, the percentage of firms expecting employment to increase over the next six months exceeded the percentage expecting declines (29 percent versus 16 percent). Firms' forecast for future capital spending remains subdued: The future capital spending index is at zero this month, very near its readings of the previous four months.
In special questions this month firms were asked about their current inventory expectations (see Special Questions). A little over 44 percent of firms indicated that their current inventories are about right for prevailing conditions. Nearly 34 percent expect declines over the next three months, while only 19 percent expect to increase inventories. About 15 percent of the firms indicated that their inventories had been reduced in the current downturn and that a rebuilding would occur in the third quarter. Only 4 percent indicated that a rebuilding would occur in the fourth quarter, but the largest percentage (27 percent) indicated that it would not occur until next year. Firms were also asked to characterize their likely inventory plans when demand picks up. The percentage of firms that think inventories will grow more slowly than in previous recoveries (34 percent) was higher than the percentage of firms (1 percent) that think inventories will grow faster. Over 23 percent think inventories will grow similar to previous recessions, while the largest percentage (40 percent) think inventories will remain at current levels.
Summary
According to respondents to the August Business Outlook Survey, manufacturing conditions improved slightly this month. For the first time since November 2007, all of the survey's broad indicators were positive. Although employment continued to decline among the reporting firms, losses were less widespread this month. Future indicators suggest that firms continue to expect conditions to improve over the next six months.
More info at link
Leading indicators - 10:30am
Full report here
Released: Thursday, August 20, 2009
The Conference Board Leading Economic Index™ (LEI) for the U.S. increased 0.6 percent, The Conference Board Coincident Economic Index™ (CEI) remained unchanged and The Conference Board Lagging Economic Index™ (LAG) decreased 0.3 percent in July.
Download a PDF of the technical notes for underlying detail, diffusion indexes, components, contributions and graphs.
Download a PDF of the press release with graph.
* The Conference Board LEI for the U.S. rose again in July, its fourth consecutive increase. The six-month change in the index has risen to 3.0 percent (a 6.2 percent annual rate) in the period through July, up substantially from -2.8 percent (a -5.4 percent annual rate) for the previous six months, and the strengths among the leading indicators have grown more widespread in recent months. The interest rate spread, initial unemployment claims and the average workweek made large positive contributions to the index this month, more than offsetting the negative contributions from consumer expectations, real money supply, and building permits.
* The Conference Board CEI for the U.S. was unchanged in July, after decreasing for the past consecutive eight months. Index levels were revised slightly lower in recent months as a result of downward revisions to personal income. Between January and July 2009, the index fell 2.7 percent (a -5.4 percent annual rate), slower than the decline of 3.5 percent (a -6.8 percent annual rate) for the previous six months. In July, the lagging economic index for the U.S. fell again, and with the coincident economic index remaining unchanged, the coincident-to-lagging ratio increased further. Meanwhile, real GDP fell at a 1.0 percent annual rate in the second quarter, following a contraction of 6.4 percent annual rate for the first quarter of the year.
* After having fallen steadily since reaching a peak in July 2007, The Conference Board LEI for the U.S. has increased sharply in the last four months, amid widespread strength among its components. As a result, the six-month growth rate in the index has accelerated to its highest rate since the middle of 2004. Meanwhile, the decline in The Conference Board CEI for the U.S. has gradually moderated in recent months. All in all, the behavior of the composite indexes suggests that the recession is bottoming out and that economic activity will likely begin to recover soon.
LEADING INDICATORS. Six of the ten indicators that make up The Conference Board LEI for the U.S. increased in July. The positive contributors – beginning with the largest positive contributor – were interest rate spread, average weekly initial claims for unemployment insurance (inverted), average weekly manufacturing hours, index of supplier deliveries (vendor performance), stock prices, and manufacturers' new orders for nondefense capital goods*. The negative contributors – beginning with the largest negative contributor – were index of consumer expectations, real money supply*, and building permits. The manufacturers' new orders for consumer goods and materials* held steady in July.
The Conference Board LEI for the U.S. now stands at 101.6 (2004=100). Based on revised data, this index increased 0.8 percent in June and increased 1.2 percent in May. During the six-month span through July, the leading economic index increased 3.0 percent, with eight out of ten components advancing (diffusion index, six-month span equals 85 percent).
COINCIDENT INDICATORS. Three of the four indicators that make up The Conference Board CEI for the U.S. increased in July. The positive contributors to the index – beginning with the largest positive contributor – were industrial production, personal income less transfer payments* and manufacturing and trade sales*. The negative contributor was employees on nonagricultural payrolls.
The Conference Board CEI for the U.S. now stands at 99.7 (2004=100). This index decreased 0.4 percent in June and decreased 0.4 percent in May. During the six-month period through July, the coincident economic index decreased 2.7 percent, with none of the four components advancing (diffusion index, six-month span equals 0.0 percent).
LAGGING INDICATORS. The Conference Board LAG for the U.S. stands at 110.8 (2004=100) in July, with one of the seven components advancing. The positive contributor to the index was the ratio of consumer installment credit to personal income*. The negative contributors – beginning with the largest negative contributor – were commercial and industrial loans outstanding*, average duration of unemployment (inverted), change in labor cost per unit of output*, change in CPI for services and the ratio of manufacturing and trade inventories to sales*. The average prime rate charged by banks held steady in July. Based on revised data, the lagging economic index decreased 0.7 percent in June and decreased 0.6 percent in May.
DATA AVAILABILITY AND NOTES. The data series used to compute The Conference Board Leading Economic Index™ (LEI) for the U.S., The Conference Board Coincident Economic Index™ (CEI) for the U.S. and The Conference Board Lagging Economic Index™ (LAG) for the U.S. and reported in the tables in this release are those available "as of" 12 Noon on August 19, 2009. Some series are estimated as noted below.
* Series in The Conference Board LEI for the U.S. based on our estimates are manufacturers' new orders for consumer goods and materials, manufacturers' new orders for nondefense capital goods, and the personal consumption expenditure used to deflate the money supply. Series in The Conference Board CEI for the U.S. that are based on our estimates are personal income less transfer payments and manufacturing and trade sales. Series in The Conference Board LAG for the U.S. that are based on our estimates are inventories to sales ratio, consumer installment credit to income ratio, change in labor cost per unit of output, and the personal consumption expenditure used to deflate commercial and industrial loans outstanding.
The procedure used to estimate the current month's personal consumption expenditure deflator (used in the calculation of real money supply and commercial and industrial loans outstanding) now incorporates the current month's consumer price index when it is available before the release of The Conference Board LEI for the U.S.
The next release is scheduled for Monday, September 21, 2009 at 10 A.M. ET.
Jobless claims - opps! - 8:38am
Full report here
UNEMPLOYMENT INSURANCE WEEKLY CLAIMS REPORT
SEASONALLY ADJUSTED DATA
In the week ending Aug. 15, the advance figure for seasonally adjusted initial claims was 576,000, an increase of 15,000 from the previous week's revised figure of 561,000. The 4-week moving average was 570,000, an increase of 4,250 from the previous week's revised average of 565,750.
The advance seasonally adjusted insured unemployment rate was 4.7 percent for the week ending Aug. 8, unchanged from the prior week's unrevised rate of 4.7 percent.
The advance number for seasonally adjusted insured unemployment during the week ending Aug. 8 was 6,241,000, an increase of 2,000 from the preceding week's revised level of 6,239,000. The 4-week moving average was 6,266,000, a decrease of 2,500 from the preceding week's revised average of 6,268,500.
The fiscal year-to-date average for seasonally adjusted insured unemployment for all programs is 5.565 million.
UNADJUSTED DATA
The advance number of actual initial claims under state programs, unadjusted, totaled 454,216 in the week ending Aug. 15, a decrease of 28,406 from the previous week. There were 343,169 initial claims in the comparable week in 2008.
The advance unadjusted insured unemployment rate was 4.4 percent during the week ending Aug. 8, unchanged from the prior week. The advance unadjusted number for persons claiming UI benefits in state programs totaled 5,798,001, a decrease of 97,650 from the preceding week. A year earlier, the rate was 2.4 percent and the volume was 3,160,610.
Extended benefits were available in Alaska, Arizona, Arkansas, California, Colorado, Connecticut, Delaware, the District of Columbia, Florida, Georgia, Idaho, Illinois, Indiana, Kansas, Kentucky, Maine, Massachusetts, Michigan, Minnesota, Missouri, Nevada, New Jersey, New York, North Carolina, Ohio, Oregon, Pennsylvania, Puerto Rico, Rhode Island, South Carolina, Tennessee, Texas, Vermont, Virginia, Washington, and Wisconsin during the week ending Aug. 1.
Initial claims for UI benefits by former Federal civilian employees totaled 1,639 in the week ending Aug. 8, an increase of 271 from the prior week. There were 2,252 initial claims by newly discharged veterans, an increase of 232 from the preceding week.
There were 20,577 former Federal civilian employees claiming UI benefits for the week ending Aug. 1, an increase of 1,009 from the previous week. Newly discharged veterans claiming benefits totaled 30,325, a decrease of 15 from the prior week.
States reported 2,877,756 persons claiming EUC (Emergency Unemployment Compensation) benefits for the week ending Aug. 1, an increase of 92,384 from the prior week. There were 1,406,779 claimants in the comparable week in 2008. EUC weekly claims include both first and second tier activity.
The highest insured unemployment rates in the week ending Aug. 1 were in Puerto Rico (7.3 percent), Oregon (6.2), Pennsylvania (6.1), Michigan (5.9), Nevada (5.9), Wisconsin (5.5), California (5.3), Connecticut (5.3), New Jersey (5.3), North Carolina (5.1), and South Carolina (5.1).
The largest increases in initial claims for the week ending Aug. 8 were in Tennessee (+2,525), North Carolina (+2,469), Wisconsin (+2,078), Georgia (+1,753), and Washington (+1,697), while the largest decreases were in California (-5,635), Michigan (-1,490), Ohio (-951), Kentucky (-690), and Delaware (-226).
More at link with formatted tables
Pre-market - August 20, 2009
Futures up a little after a good night in Asia
DJIA INDEX 9,294.00 18.00
S&P 500 999.90 2.80 996.70
NASDAQ 100 1,600.25 1.50
Today's economic calendar:
Jobless Claims 8:30 AM ET
Leading Indicators 10:00 AM ET
Philadelphia Fed Survey 10:00 AM ET
EIA Natural Gas Report 10:30 AM ET
3-Month Bill Announcement 11:00 AM ET
6-Month Bill Announcement 11:00 AM ET
52-Week Bill Announcement 11:00 AM ET
2-Yr Note Announcement 11:00 AM ET
5-Yr Note Announcement 11:00 AM ET
7-Yr Note Announcement 11:00 AM ET
Money Supply 4:30 PM ET
Today's earnings:
Before market opens:
ATV Acorn International, Inc. Services Catalog & Mail Order Houses
BKE Buckle Inc. Services Apparel Stores
BKS Barnes & Noble, Inc. Services Specialty Retail, Other
BLD Baldwin Technology Co. Inc. Industrial Goods Diversified Machinery
BONT Bon-Ton Stores Inc. Services Department Stores
CTR Cato Corp. Services Apparel Stores
DKS Dick's Sporting Goods Inc. Services Sporting Goods Stores
DROOY DRDGOLD Ltd. Basic Materials Gold
FLWS 1-800-Flowers.com Inc. Services Specialty Retail, Other
GASS StealthGas, Inc. Services Shipping
GME GameStop Corp. Services Electronics Stores
HNZ HJ Heinz Co. Consumer Goods Food - Major Diversified
HRL Hormel Foods Corp. Consumer Goods Meat Products
KNSY Kensey Nash Corp. Healthcare Medical Instruments & Supplies
LANC Lancaster Colony Corp. Consumer Goods Food - Major Diversified
LYTS LSI Industries Inc. Consumer Goods Business Equipment
NM Navios Maritime Holdings Inc. Services Shipping
NOVN Noven Pharmaceuticals Inc. Healthcare Drug Delivery
PDCO Patterson Companies Inc. Services Medical Equipment Wholesale
PLCE The Children's Place Retail Stores, Inc. Services Apparel Stores
QUIX Quixote Corp. Consumer Goods Rubber & Plastics
RGS Regis Corp. Services Personal Services
ROST Ross Stores Inc. Services Apparel Stores
SCHS School Specialty Inc. Services Wholesale, Other
SFL Ship Finance International Limited Services Shipping
SHLD Sears Holdings Corporation Services Department Stores
SMRT Stein Mart Inc. Services Apparel Stores
SSI Stage Stores Inc. Services Apparel Stores
STP Suntech Power Holdings Co. Ltd. Technology Diversified Electronics
SXI Standex International Corp. Industrial Goods Industrial Equipment & Components
TECD Tech Data Corp. Services Computers Wholesale
TK Teekay Corporation Services Shipping
TTC Toro Co. Industrial Goods Small Tools & Accessories
TWMC Trans World Entertainment Corporation Services Music & Video Stores
Today after close:
ARO Aeropostale Inc. Services Apparel Stores
BAMM Books-A-Million Inc. Services Specialty Retail, Other
BRCD Brocade Communications Systems, Inc. Technology Data Storage Devices
CRM Salesforce.com Technology Internet Software & Services
FL Foot Locker Inc. Services Apparel Stores
GPS Gap Inc. Services Apparel Stores
HIBB Hibbett Sports, Inc. Services Sporting Goods Stores
HSTX Harris Stratex Networks, Inc. Technology Communication Equipment
INTU Intuit Inc. Technology Application Software
JMBA Jamba, Inc. Consumer Goods Processed & Packaged Goods
JRJC China Finance Online Co. Ltd. Technology Internet Information Providers
MENT Mentor Graphics Corp. Technology Technical & System Software
NDSN Nordson Corp. Industrial Goods Diversified Machinery
NZT Telecom Corp. of New Zealand Ltd. Technology Telecom Services - Foreign
OTEX Open Text Corp. Technology Internet Software & Services
PSEM Pericom Semiconductor Corp. Technology Semiconductor - Integrated Circuits
PSUN Pacific Sunwear of California Inc. Services Apparel Stores
SB Safe Bulkers, Inc. Services Shipping
SCSC ScanSource, Inc. Services Computers Wholesale
SKIL SkillSoft plc Technology Multimedia & Graphics Software
TSCM TheStreet.com, Inc. Technology Internet Information Providers
VRGY Verigy, Ltd. Technology Semiconductor Equipment & Materials
WTSLA Wet Seal Inc. Services Apparel Stores
ZIGO Zygo Corp. Technology Scientific & Technical Instruments
ZUMZ Zumiez, Inc. Services Apparel Stores
Market wrap - a day late - Thursday - 7:50am
The market opened down but a burst upward around 11:45 gave the indexes an up day.
Dow 9,279.16 +61.22 (0.66%)
S&P 500 996.46 +6.79 (0.69%)
Nasdaq 1,969.24 +13.32 (0.68%)
Today by sector:
 Today's heatmap:
Today's heatmap:
Wednesday, August 19, 2009
Healthcare, CNBC, and the WSJ's Martin Feldstein
I'm not a big fan of CNBC, but sometimes Mark Haines is a treat to watch and listen to. After this article in the WSJ, Mark interviewed this guy.
More on UBS and taxes - 11:20am
Full article here - WSJ
UBS AG will hand over some 4,450 names of U.S. account holders as part of a U.S.-Swiss tax-evasion settlement and investigation that could produce in total 10,000 account identities, according to people familiar with the situation.
Details of the settlement, which was reached earlier this month, are expected to be provided over the next half-hour. Swiss and Internal Revenue Service officials plan to provide those details, these people said.
UBS is not expected to pay a monetary fine as part of the settlement, which was negotiated between U.S. and Swiss officials in recent weeks. The U.S. inquiry was led by the Justice Department and IRS.
Aside from the account identities being turned over by UBS, some 5,000 names are expected to be produced through a special IRS amnesty program where UBS clients acknowledge unpaid income tax.
The 10,000 identities in total also are expected to include the some 250 names produced by UBS as part of a $780 million criminal settlement reached with the Justice Department in February.
If the total identities do reach 10,000, it would represent a staggering number of Americans who banked with UBS and now are having to have their identities revealed.
It's not clear how UBS -- and the Swiss government -- have decided on the 4,450 names. Lawyers involved in representing UBS clients believe that violations of Swiss law would be a factor.
Lawyers also believe that those who are being turned over by UBS will have a chance to fight the turnover in a Swiss tribunal.
UBS tax deal with U.S. seen as soon as today
From Reuters
UBS tax deal with U.S. seen as soon as today
Wed Aug 19, 2009 8:38am EDT
By Jason Rhodes
BERNE (Reuters) - Details of a deal to settle a U.S. tax case against Swiss bank UBS AG could come as soon as Wednesday and could have far-reaching implications for other wealth managers.
The lawsuit against UBS, which alleges that it helped U.S. citizens dodge taxes, has strained relations between the U.S. and Switzerland because it challenges the secrecy laws that have long drawn clients to the Alpine nation's banking sector and poses a threat to its wealth management industry.
Sources have said UBS, the world's second-largest wealth manager, will hand over details of about 5,000 client accounts after the signing of a deal agreed last week to end a dispute in which U.S. tax authorities originally asked for details on 52,000 clients suspected of tax evasion.
"No one is expecting a fine or punitive damages, so the impact on UBS shouldn't be too severe," said Cheuvreux analyst Christian Stark. "The more important implications are for the Swiss banking industry."
The deal could be announced on Wednesday, after the first regular meeting of the Swiss cabinet following the summer recess, industry insiders said.
The Wall Street Journal reported on Wednesday that wealthy U.S. citizens using a government tax-evasion amnesty program had identified almost 10 European banks where they have accounts, citing people familiar with the situation.
The paper named Credit Suisse, Julius Baer, Zuercher Kantonalbank and Union Bancaire Privee (UBP) in the report, though it said the disclosures did not signal any wrongdoing by the banks.
Credit Suisse and Julius Baer declined to comment. UBP, Zuercher Kantonalbank and the U.S. Internal Revenue Service could not be immediately reached for comment by Reuters.
HERALDING UBS RECOVERY?
The U.S. is building criminal cases against more than 150 American clients of UBS as part of a crackdown on tax evasion now made easier by a deal over access to secret account information.
But analysts say the deal could clear the decks for a recovery at UBS, which has been battered by the financial crisis and uncertainty caused by the U.S. probe.
It could also remove an important obstacle to the Swiss government offloading its 9 percent investment in UBS held as mandatory convertible notes (MCNs).
UBS shares were down 2.8 percent at 16.42 Swiss francs at 5:54 a.m. EDT, just behind a 2.5 percent drop in the DJ Stoxx European banks index. Local Swiss rival Credit Suisse was down 2.5 percent and Baer had lost 3 percent.
(Additional reporting by Martin de Sa'Pinto and Katie Reid in Zurich; Writing by Sam Cage, editing by Will Waterman)
© Thomson Reuters 2009. All rights reserved. Users may download and print extracts of content from this website for their own personal and non-commercial use only. Republication or redistribution of Thomson Reuters content, including by framing or similar means, is expressly prohibited without the prior written consent of Thomson Reuters. Thomson Reuters and its logo are registered trademarks or trademarks of the Thomson Reuters group of companies around the world.
CNBC is reporting the Treasury will have a statement around 9:30. I will update if and when I find something
CNBC is reporting the Treasury will have a statement around 9:30. I will update if and when I find something
Pre-market - August 19, 2009
Futures down this morning after a bad overnight in Asia:
DJIA INDEX 9,144.00 -63.00
S&P 500 981.60 -8.00 989.10
NASDAQ 100 1,570.50 -16.50
Gold 939 3 0.36%
Oil 69.08 -0.11 -0.16%
Today's economic calendar:
MBA Purchase Applications 7:00 AM ET
EIA Petroleum Status Report 10:30 AM ET
Today's earning releases:
Before market opens
BJ BJ's Wholesale Club Inc. Services Discount, Variety Stores
DE Deere & Co. Industrial Goods Farm & Construction Machinery
EV Eaton Vance Corp. Financial Asset Management
FLO Flowers Foods, Inc. Consumer Goods Processed & Packaged Goods
PERY Perry Ellis International Inc. Consumer Goods Textile - Apparel Clothing
RAVN Raven Industries Inc. Technology Printed Circuit Boards
TWB Tween Brands, Inc. Services Apparel Stores
VVTV ValueVision Media Inc. Services Catalog & Mail Order Houses
YGE Yingli Green Energy Holding Co. Ltd. Technology Semiconductor
Today after close
AFCE AFC Enterprises Inc. Consumer Goods Food - Major Diversified
BFRM BioForm Medical, Inc. Healthcare Medical Appliances & Equipment
CEDU ChinaEdu Corporation Services Education & Training Services
CTRN Citi Trends Services Apparel Stores
CYBX Cyberonics Inc. Healthcare Medical Appliances & Equipment
FLXS Flexsteel Industries Inc. Consumer Goods Home Furnishings & Fixtures
GYMB Gymboree Corp. Services Apparel Stores
HAR Harman International Industries Inc. Consumer Goods Electronic Equipment
HOTT Hot Topic Inc. Services Apparel Stores
JDSU JDS Uniphase Corp. Technology Communication Equipment
LTD Limited Brands Inc. Services Apparel Stores
NAK Northern Dynasty Minerals Ltd. Basic Materials Gold
NTAP NetApp, Inc. Technology Data Storage Devices
PETM Petsmart Inc. Services Specialty Retail, Other
PVH Phillips-Van Heusen Corp. Consumer Goods Textile - Apparel Clothing
SINA Sina Corp. Technology Internet Software & Services
SMTC Semtech Corp. Technology Semiconductor - Integrated Circuits
SNPS Synopsys Inc. Technology Technical & System Software
Tuesday, August 18, 2009
Market wrap - 4:20pm
A nice rebound after a down day yesterday:
Dow 9,217.94 +82.60 (0.90%)
S&P 500 989.67 +9.94 (1.01%)
Nasdaq 1,955.92 +25.08 (1.30%)
Gold 939 +3 +0.36%
Oil 69.31 2.44 3.65%
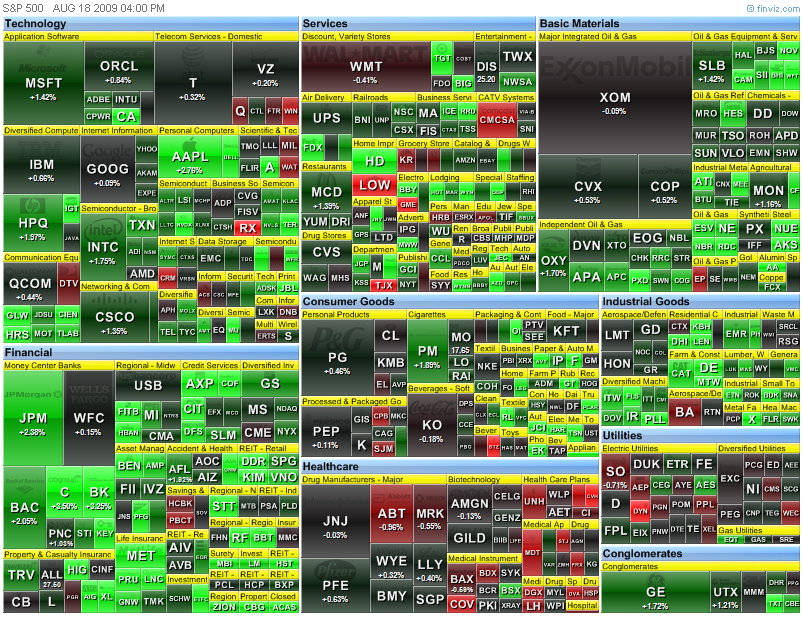
Today by sector:

Housing starts - 8:30am
Full report here
NEW RESIDENTIAL CONSTRUCTION IN JULY 2009
The U.S. Census Bureau and the Department of Housing and Urban Development jointly announced the following new residential construction statistics for July 2009:
BUILDING PERMITS
Privately-owned housing units authorized by building permits in July were at a seasonally adjusted annual rate of 560,000. This is 1.8 percent (±1.4%) below the revised June rate of 570,000 and is 39.4 percent (±1.8%) below the July 2008 estimate of 924,000.
Single-family authorizations in July were at a rate of 458,000; this is 5.8 percent (±1.1%) above the revised June figure of 433,000. Authorizations of units in buildings with five units or more were at a rate of 84,000 in July.
HOUSING STARTS
Privately-owned housing starts in July were at a seasonally adjusted annual rate of 581,000. This is 1.0 percent (±8.5%)* below the revised June estimate of 587,000 and is 37.7 percent (±5.1%) below the July 2008 rate of 933,000. Single-family housing starts in July were at a rate of 490,000; this is 1.7 percent (±7.1%)* above the revised June figure of 482,000. The July rate for units in buildings with five units or more was 80,000.
HOUSING COMPLETIONS
Privately-owned housing completions in July were at a seasonally adjusted annual rate of 802,000. This is 0.9 percent (±10.1%)* below the revised June estimate of 809,000 and is 26.4 percent (±6.9%) below the July 2008 rate of 1,089,000.
Single-family housing completions in July were at a rate of 491,000; this is 4.1 percent (±8.9%)* below the revised June figure of 512,000. The July rate for units in buildings with five units or more was 297,000.
More at link with formatted tables
PPI - 8:30am
Full report here
Producer Price Indexes - July 2009
The Producer Price Index for Finished Goods declined 0.9 percent in July, seasonally
adjusted, the Bureau of Labor Statistics of the U.S. Department of Labor reported today. This decrease followed advances of 1.8 percent in June and 0.2 percent in May. At the earlier stages of processing, prices received by manufacturers of intermediate goods moved down 0.2 percent in July after rising 1.9 percent in the prior month, and the crude goods index fell 4.5 percent following a 4.6-percent increase in June. (See table A.)
The downturn in finished goods prices was broad based. The index for energy goods fell 2.4 percent in July after climbing 6.6 percent a month earlier, prices for consumer foods decreased 1.5 percent following a 1.1-percent advance in the previous month, and the index for goods other than foods and energy edged down 0.1 percent compared with a 0.5-percent rise in June.
More at link with tables I cannot format
Pre-market - August 18, 2009
Futures up a little this morning.
DJIA INDEX 9,164.00 44.00
S&P 500 982.80 4.50 978.00
NASDAQ 100 1,576.00 9.75
Gold936 -13 -1.36%
Oil 67.57 +0.82 +1.23%
Today's economic calendar:
ICSC-Goldman Store Sales 7:45 AM ET
Housing Starts 8:30 AM ET
Producer Price Index 8:30 AM ET
Redbook 8:55 AM ET
4-Week Bill Auction 1:00 PM ET
Today's earnings report:
Before open
CAH Cardinal Health, Inc. Services Drugs Wholesale
CCUR Concurrent Computer Corporation Technology Computer Based Systems
FREE FreeSeas Inc. Services Shipping
GIGM GigaMedia Ltd. Technology Internet Software & Services
HD The Home Depot, Inc. Services Home Improvement Stores
PRGO Perrigo Co. Healthcare Drug Related Products
RAIL FreightCar America Inc. Services Railroads
SKS Saks Incorporated Services Department Stores
SOLF Solarfun Power Holdings Co. Ltd. Technology Semiconductor - Specialized
TGT Target Corp. Services Discount, Variety Stores
TJX The TJX Companies, Inc. Services Department Stores
After close:
ADI Analog Devices Inc. Technology Semiconductor - Broad Line
ALOT Astro-Med Inc. Technology Computer Peripherals
CLZR Candela Corp. Healthcare Medical Appliances & Equipment
GA Giant Interactive Group, Inc. Services Business Services
HPQ Hewlett-Packard Company Technology Diversified Computer Systems
HSTX Harris Stratex Networks, Inc. Technology Communication Equipment
JBSS John B Sanfilippo & Son Inc. Consumer Goods Processed & Packaged Goods
JKHY Jack Henry & Associates Inc. Technology Business Software & Services
KTCC Key Tronic Corp. Technology Computer Peripherals
LFT Longtop Financial Technologies Limited Technology Business Software
LZB La-Z-Boy Inc. Consumer Goods Home Furnishings & Fixtures
PLAB Photronics Inc. Technology Semiconductor - Integrated Circuits
Monday, August 17, 2009
Market wrap - 4:15pm
Huge gap down today, then sideways for the rest of the day. Is this the correction they have been talking about, or something larger?
Dow 9,135.34 -186.06 (-2.00%)
S&P 500 979.73 -24.36 (-2.43%)
Nasdaq 1,930.84 -54.68 (-2.75%)
Gold 936 -13 -1.36%
Oil 66.71 -0.76 -1.13%
Today by sector:

Builder Confidence Continues Upward In August - 2:00pm
Builder Confidence Continues Upward In August - Full report here
August 17, 2009 - Builder confidence in the market for newly built, single-family homes rose one point in August to its highest level in more than a year, according to the latest reading of the National Association of Home Builders/Wells Fargo Housing Market Index (HMI), released today. Building on a two-point gain in July, the HMI reached 18 this month, its highest point since June of 2008.
“Home builder expectations have been buoyed by the success of the first-time home buyer tax credit and its anticipated boost to buying activity leading up to the Nov. 30 expiration date,” said NAHB Chairman Joe Robson, a home builder from Tulsa, Okla. “The question is what happens after that – whether there will be enough momentum to keep us moving toward a recovery, particularly in light of significant headwinds such as the severe credit crunch for housing production loans and inappropriate appraisal practices that are scuttling a quarter of all new-home sales. Unless Congress and the Administration focus their attention on housing right now, this improvement may well be short-lived,” he said.
“One very positive aspect of today’s report is the big gain registered in the component gauging home builders’ expectations for the next six months,” noted NAHB Chief Economist David Crowe. “This reflects anticipated sales stemming from the tax credit as well as recent signs that an economic recovery has begun. There is definitely a sense of hope among builders that the worst of the downturn is over and that a turning point is near at hand. Meaningful action by Congress could ensure that this upward momentum continues and that housing can help push the economy back onto solid ground.”
NAHB is calling on Congress to extend the first-time home buyer tax credit for another year and to offer it to all income-eligible buyers. In addition, NAHB is urging Congress to help eliminate the credit crunch, correct faulty appraisal practices and expand Net Operating Loss tax provisions that can help avoid more layoffs. Each of these actions would generate thousands of new jobs and provide a much-needed boost to economic recovery.
Derived from a monthly survey that NAHB has been conducting for more than 20 years, the NAHB/Wells Fargo Housing Market Index gauges builder perceptions of current single-family home sales and sales expectations for the next six months as “good,” “fair” or “poor.” The survey also asks builders to rate traffic of prospective buyers as “high to very high,” “average” or “low to very low.” Scores for each component are then used to calculate a seasonally adjusted index where any number over 50 indicates that more builders view sales conditions as good than poor.
Two out of three of the HMI’s component indexes recorded substantial gains in August. The biggest boost, of 4 points, was registered by the index gauging sales expectations in the next six months, which rose to 30 this month. Meanwhile, the index gauging traffic of prospective buyers gained three points to 16 and the index gauging current sales conditions held unchanged at 16.
Regionally, all but the South recorded HMI gains in August. The Northeast posted an 8-point gain to 24, the Midwest posted a two-point gain to 16, the West posted a three-point gain to 17 and the South posted a one-point decline to 18.
EDITOR’S NOTE: The NAHB/Wells Fargo Housing Market Index is strictly the product of NAHB Economics, and is not seen or influenced by any outside party prior to being released to the public.
HMI tables can be accessed online at: www.nahb.org/hmi. More information on housing statistics is also available at: www.housingeconomics.com.
Empire State Manufacturing survey - 8:30am
Full report here
For the first time in considerably more than a year, the Empire State Manufacturing Survey indicates that conditions for New York manufacturers have improved. The general business conditions index increased 13 points, to 12.1, its highest level since November of 2007. Although the inventories index remained well below zero, the new orders and shipments indexes rose to their highest levels in many months. The prices paid index was positive, while the prices received index continued to be negative. Employment indexes were much improved from their recent low levels, although they remained below zero. Future indexes generally rose from last month and conveyed optimism about the six-month outlook; the capital expenditures index rose to its highest level in over a year.
In a series of supplementary questions (see Supplemental Report tab), manufacturers were asked to assess the degree to which certain business issues posed problems for their firms; the same questions had been asked in August 2008 and in earlier surveys. In the current survey, the cost of employee benefits was the issue most frequently identified as a major problem. A distant second was workers’ compensation, which was cited as a major problem somewhat more often than in last year’s survey, but less often than in 2007. Last year’s most widely cited concern, the cost of resources, emerged as much less of a problem in this year’s survey, ranking third.
Manufacturers See Improving Conditions
In August, after more than a year of negative readings, the general business conditions index rose into positive territory and reached its highest level since November 2007—a clear indication that, on balance, business conditions had improved for New York State manufacturers. Thirty percent of respondents said that conditions had improved over the month, while 18 percent said that conditions had deteriorated. The new orders index rose 8 points to 13.4, and the shipments index rose 3 points to 14.1. Both of these indexes were at their highest levels in more than a year. The unfilled orders index rose slightly, to -9.6. The delivery time index, at -10.6, hovered near last month’s level. The inventories index rose 14 points from a very low level in July, but remained well below zero at -22.3.
Employment Indexes, though Negative, Rise
After turning positive in July, the prices paid index rose a few points to 13.8. The prices received index remained below zero, falling 4 points from last month, to -12.8. Employment indexes were much improved, although they remained negative. Posting a sixth consecutive monthly increase, the index for number of employees rose 13 points to -7.5, its highest level since October of last year. Similarly, the average workweek index climbed 13 points to -6.4.
Conditions Expected to Improve Further
Future indexes rose significantly in August, conveying an expectation that conditions would continue to improve in the months ahead. The future general business conditions index advanced 14 points to 48.2, with 62 percent of respondents expecting conditions to be better in six months. The future new orders index rose 15 points to 46.0, and the future shipments index rose 4 points to 40.5. The future prices paid index climbed 6 points to 31.9, its highest level since late last year, while the future prices received index rose 11 points to enter positive territory for the first time since January. Future employment indexes were positive and higher than in July, suggesting that employment is expected to rise. The capital expenditures index advanced 16 points to 18.1, its highest level in over a year, and the technology spending index rose 14 points to 14.9.
More at link, including charts
Pre-market - August 17, 2009 - 7:50am
Opps! The foreign markets down big overnight, and ours not looking so good this morning. Futures down huge this morning:
DJIA INDEX 9,140.00 -181.00
S&P 500 983.90 -21.90 1,003.60
NASDAQ 100 1,584.75 -30.25
Gold 949 -8 -0.82%
Oil 66.04 -1.54 -2.28%
Has everyone finally figured out the green shoots are just weeds?
Today's economic calendar:
Empire State Mfg Survey 8:30 AM ET
Treasury International Capital 9:00 AM ET
4-Week Bill Announcement 11:00 AM ET
Housing Market Index 1:00 PM ET
3-Month Bill Auction 1:00 PM ET
6-Month Bill Auction 1:00 PM ET
Today's earnings reports:
Before market opens
CHBT China-Biotics, Inc. Basic Materials
CIT CIT Group, Inc. Financial
GSOL Global Sources Ltd. Technology
HAST Hastings Entertainment Inc. Services
HTWR Heartware International Inc. Healthcare
LOW Lowe's Companies Inc. Services
PCAP Patriot Capital Funding, Inc. Financial
VAL Valspar Corp. Industrial Goods
Today after close
A Agilent Technologies Inc. Technology
AMCN AirMedia Group Inc. Services
CHINA CDC Corp. Technology
CNTF China Techfaith Wireless Communication Technology Ltd. Technology
DL China Distance Education Holdings Limited Services
EMKR EMCORE Corporation Technology
FMCN Focus Media Holding Ltd. Services
FMD First Marblehead Corp. Financial
LIVE LiveDeal, Inc. Services
PEDH Peoples Educational Holdings, Inc. Services
SCR Simcere Pharmaceutical Group. Healthcare
TSL Trina Solar Ltd. Technology
Subscribe to:
Comments (Atom)
