 More at link with formatted tables
Friday, December 11, 2009
Retail sales- 8:30
ADVANCE MONTHLY SALES FOR RETAIL TRADE AND FOOD SERVICES
NOVEMBER 2009
The U.S. Census Bureau announced today that advance estimates of U.S. retail and food services sales for November, adjusted for seasonal variation and holiday and trading-day differences, but not for price changes, were $352.1 billion, an increase of 1.3 percent (±0.5%) from the previous month and 1.9 percent (±0.5%) above November 2008. Total sales for the September through November 2009 period were down 2.1 percent (±0.3%) from the same period a year ago. The September to October 2009 percent change was revised from +1.4 percent (±0.5%) to +1.1 percent (±0.2%).
Retail trade sales were up 1.4 percent (±0.5%) from October 2009 and 2.2 percent (±0.5%) above last year. Building material and garden equipment and supplies dealers were down 9.3 percent (±1.8%) from November 2008, but gasoline stations sales were up 8.9% (±1.3%) from last year.
The scheduled release dates for 2010 are as follows: January 14, February 11, March 12, April 14, May 14, June 11, July 14, August 13, September 14, October 15, November 15, December 14.
More at link with formatted tables
More at link with formatted tables


Pre-market - 7:45
Futures up a bit on news out of China - I guess.
DJIA INDEX 10,391.00 49.00
S&P 500 1,103.30 6.10
NASDAQ 100 1,807.75
Today's economic calendar
Retail Sales 8:30 AM ET
Import and Export Prices 8:30 AM ET
Consumer Sentiment 9:55 AM ET
Business Inventories 10:00 AM ET
Today's earnings reports: None
Thursday, December 10, 2009
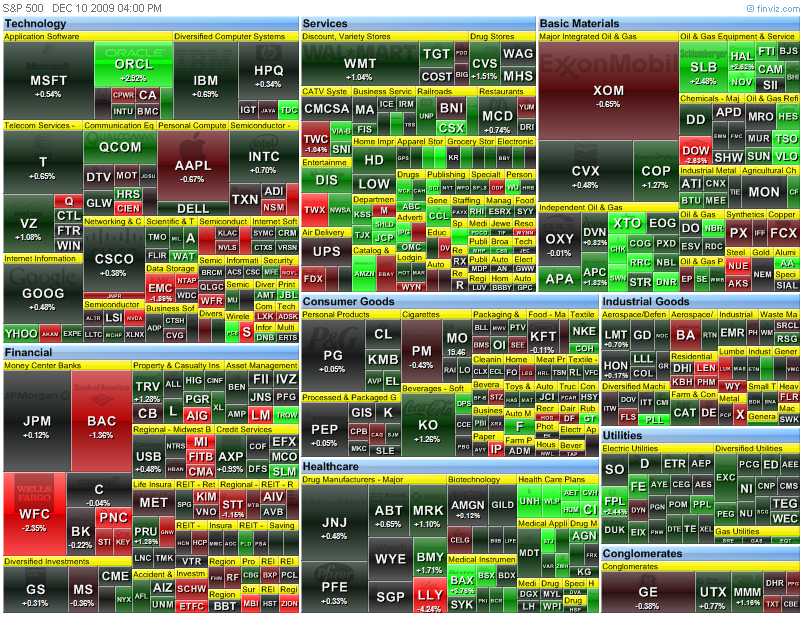
Market wrap - 4:20
Bad job numbers - the market didn't care. All is good in the world.
Dow 10,406 69 0.67%
Nasdaq 2,191 7 0.33%
S&P 500 1,102 6 0.58%
GlobalDow 1,957 +6 +0.29%
Gold 1,126 +6 +0.49%
Oil 70.48 -0.13 -0.18%


International trade - 8:30
Full report here
U.S. Census Bureau
U.S. Bureau of Economic Analysis
NEWS
U.S. Department of Commerce * Washington, DC 20230
U.S. INTERNATIONAL TRADE IN GOODS AND SERVICES
October 2009
Goods and Services
The U.S. Census Bureau and the U.S. Bureau of Economic Analysis, through the Department
of Commerce, announced today that total October exports of $136.8 billion and imports
of $169.8 billion resulted in a goods and services deficit of $32.9 billion, down
from $35.7 billion in September, revised. October exports were $3.5 billion more
than September exports of $133.4 billion. October imports were $0.7 billion more
than September imports of $169.0 billion.
In October, the goods deficit decreased $2.6 billion from September to $44.8 billion,
and the services surplus increased $0.2 billion to $11.9 billion. Exports of goods
increased $3.2 billion to $93.5 billion, and imports of goods increased $0.7 billion
to $138.4 billion. Exports of services increased $0.2 billion to $43.3 billion, and
imports of services increased $0.1 billion to $31.4 billion.
In October, the goods and services deficit decreased $26.5 billion from October 2008.
Exports were down $12.9 billion, or 8.6 percent, and imports were down $39.3 billion,
or 18.8 percent.
Goods (Census basis)
The September to October increase in exports of goods reflected increases in capital
goods ($1.2 billion); consumer goods ($1.0 billion); other goods ($0.6 billion);
industrial supplies and materials ($0.4 billion); automotive vehicles, parts, and
engines ($0.4 billion); and foods, feeds, and beverages ($0.2 billion).
The September to October increase in imports of goods reflected increases in capital
goods ($1.1 billion); consumer goods ($1.0 billion); automotive vehicles, parts, and
engines ($0.4 billion); and foods, feeds, and beverages ($0.2 billion). Decreases
occurred in industrial supplies and materials ($1.8 billion) and other goods ($0.4
billion).
The October 2008 to October 2009 decrease in exports of goods reflected decreases in
industrial supplies and materials ($3.9 billion); capital goods ($3.8 billion);
automotive vehicles, parts, and engines ($2.1 billion); and foods, feeds, and beverages
($0.7 billion). Increases occurred in consumer goods ($0.4 billion) and other goods
($0.1 billion).
The October 2008 to October 2009 decrease in imports of goods reflected decreases in
industrial supplies and materials ($25.0 billion); capital goods ($5.2 billion);
consumer goods ($3.7 billion); automotive vehicles, parts, and engines ($1.2 billion);
foods, feeds, and beverages ($0.7 billion); and other goods ($0.7 billion).
Services
Services exports increased $0.2 billion from September to October. The increase was
more than accounted for by increases in other private services (which includes items
such as business, professional, and technical services, insurance services, and
financial services), other transportation (which includes freight and port services),
and passenger fares. A decrease in transfers under U.S. military sales contracts was
partly offsetting.
Services imports increased $0.1 billion from September to October. The increase was
mostly accounted for by an increase in passenger fares. Changes in the other categories
of services imports were small.
The October 2008 to October 2009 decrease in exports of services was $2.6 billion.
The largest decreases were in travel ($1.1 billion), other transportation ($0.8 billion),
and royalties and license fees ($0.6 billion).
The October 2008 to October 2009 decrease in imports of services was $2.5 billion.
Decreases occurred in other transportation ($1.6 billion), passenger fares ($0.8
billion), and travel ($0.5 billion).
Goods and Services Moving Average
For the three months ending in October, exports of goods and services averaged $133.3
billion, while imports of goods and services averaged $166.3 billion, resulting in an
average trade deficit of $33.0 billion. For the three months ending in September, the
average trade deficit was $32.5 billion, reflecting average exports of $130.8 billion
and average imports of $163.3 billion.
Selected Not Seasonally Adjusted Goods Details
The October figures show surpluses, in billions of dollars, with Hong Kong $1.6 ($1.9
for September), Australia $1.3 ($0.9), Singapore $0.9 ($0.3), and Egypt $0.4 ($0.3).
Deficits were recorded, in billions of dollars, with China $22.7 ($22.1), OPEC $5.8
($7.9), European Union $4.9 ($5.5), Mexico $4.6 ($4.6), Japan $4.4 ($4.1), Canada $2.0
($1.5), Venezuela $1.7 ($2.0), Nigeria $1.4 ($1.9), Taiwan $0.7 ($0.7), and Korea $0.5
($0.8).
Advanced technology products exports were $23.7 billion in October and imports were
$29.3 billion, resulting in a deficit of $5.6 billion. October exports were $3.2
billion more than the $20.5 billion in September, while October imports were $2.8
billion more than the $26.5 billion in September.
Revisions
Goods exports for September were virtually unrevised. Goods imports for September
were revised down $0.3 billion. Goods carry-over in October was $0.1 billion (0.1
percent) for exports and $0.6 billion (0.4 percent) for imports. For September,
revised export carry-over was virtually zero. For September, revised import carry-over
was $0.2 billion (0.2 percent), revised down from $0.9 billion (0.7 percent).
Services exports and imports for April 2009 through September 2009 reflect the
incorporation of more comprehensive and revised quarterly and monthly data. For
services exports, the largest monthly revisions were in other private services,
transfers under U.S. military sales contracts, and royalties and license fees.
For services imports, the largest monthly revisions were in other private services.
Services exports for September were revised up $1.5 billion to $43.1 billion. The
revision was mostly accounted for by upward revisions in other private services,
transfers under U.S. military sales contracts, and royalties and license fees.
Services imports for September were revised up $0.9 billion to $31.4 billion.
The revision was mostly accounted for by an upward revision in other private services.
Jobless claims - 8:30
Full report here
SEASONALLY ADJUSTED DATA
In the week ending Dec. 5, the advance figure for seasonally adjusted initial claims was 474,000, an increase of 17,000 from the previous week's unrevised figure of 457,000. The 4-week moving average was 473,750, a decrease of 7,750 from the previous week's revised average of 481,500.
The advance seasonally adjusted insured unemployment rate was 3.9 percent for the week ending Nov. 28, a decrease of 0.2 percentage point from the prior week's unrevised rate of 4.1 percent.
The advance number for seasonally adjusted insured unemployment during the week ending Nov. 28 was 5,157,000, a decrease of 303,000 from the preceding week's revised level of 5,460,000. The 4-week moving average was 5,416,500, a decrease of 123,500 from the preceding week's revised average of 5,540,000.
The fiscal year-to-date average for seasonally adjusted insured unemployment for all programs is 5.767 million.
UNADJUSTED DATA
The advance number of actual initial claims under state programs, unadjusted, totaled 664,865 in the week ending Dec. 5, an increase of 204,703 from the previous week. There were 759,531 initial claims in the comparable week in 2008.
The advance unadjusted insured unemployment rate was 4.1 percent during the week ending Nov. 28, an increase of 0.5 percentage point from the prior week. The advance unadjusted number for persons claiming UI benefits in state programs totaled 5,373,871, an increase of 591,085 from the preceding week. A year earlier, the rate was 3.4 percent and the volume was 4,493,526.
Extended benefits were available in Alabama, Alaska, Arizona, California, Colorado, Connecticut, Delaware, the District of Columbia, Florida, Georgia, Idaho, Illinois, Indiana, Kansas, Kentucky, Maine, Massachusetts, Michigan, Minnesota, Missouri, Nevada, New Hampshire, New Jersey, New Mexico, New York, North Carolina, Ohio, Oregon, Pennsylvania, Puerto Rico, Rhode Island, South Carolina, Tennessee, Texas, Vermont, Virginia, Washington, West Virginia, and Wisconsin during the week ending Nov. 21.
Initial claims for UI benefits by former Federal civilian employees totaled 1,780 in the week ending Nov. 28, a decrease of 488 from the prior week. There were 1,372 initial claims by newly discharged veterans, a decrease of 963 from the preceding week.
There were 23,344 former Federal civilian employees claiming UI benefits for the week ending Nov. 21, a decrease of 1,177 from the previous week. Newly discharged veterans claiming benefits totaled 33,605, a decrease of 2,753 from the prior week.
States reported 4,178,780 persons claiming EUC (Emergency Unemployment Compensation) benefits for the week ending Nov. 21, an increase of 327,729 from the prior week. There were 729,256 claimants in the comparable week in 2008. EUC weekly claims include first, second, and third tier activity.
The highest insured unemployment rates in the week ending Nov. 21 were in Puerto Rico (6.1 percent), Oregon (5.6), Alaska (5.5), Nevada (5.1), Wisconsin (4.9), Washington (4.8), Michigan (4.7), Pennsylvania (4.7), Arkansas (4.5), Idaho (4.5), and North Carolina (4.5).
The largest increases in initial claims for the week ending Nov. 28 were in Wisconsin (+8,067), Kansas (+3,825), Missouri (+3,307), Iowa (+2,789), and Indiana (+2,162), while the largest decreases were in California (-28,672), Texas (-9,519), North Carolina (-8,873), Florida (-7,214), and Illinois (-6,610).
More at link with formatted tables
Pre-market - Thursday, December 10
Futures up slightly waiting on some important data at 8:30
DJIA INDEX 10,370.00 40.00
S&P 500 1,100.90 5.30
NASDAQ 100 1,800.75 8.25
BOE Announcement 7:00 AM ET
International Trade 8:30 AM ET
Jobless Claims 8:30 AM ET
RBC CASH Index 9:00 AM ET
Quarterly Services Survey 10:00 AM ET
EIA Natural Gas Report 10:30 AM ET
3-Month Bill Announcement 11:00 AM ET
6-Month Bill Announcement 11:00 AM ET
52-Week Bill Announcement 11:00 AM ET
Elizabeth Duke Speaks 12:45 PM ET
Tim Geithner Speaks 12:45 PM ET
30-Yr Bond Auction 1:00 PM ET
Treasury Budget 2:00 PM ET
Money Supply 4:30 PM ET
Today's earnings reports.
Before open:
CIEN CIENA Corp. Technology Communication Equipment
COST Costco Wholesale Corporation Services Discount, Variety Stores
CUB Cubic Corp. Technology Scientific & Technical Instruments
DG Dollar General Corp. Services Discount, Variety Stores
FSC Fifth Street Finance Corp. Financial Credit Services
GIL Gildan Activewear Inc. Consumer Goods Textile - Apparel Clothing
LAKE Lakeland Industries Inc. Healthcare Medical Appliances & Equipment
MEI Methode Electronics Inc. Technology Diversified Electronics
OPTT Ocean Power Technologies, Inc Utilities Electric Utilities
PPHM Peregrine Pharmaceuticals Inc. Healthcare Biotechnology
SFD Smithfield Foods Inc. Consumer Goods Meat Products
TITN Titan Machinery, Inc. Services Specialty Retail, Other
UNFI United Natural Foods, Inc. Services Food Wholesale
After close:
CPII CPI International, Inc. Technology Diversified Electronics
CRI Carter's, Inc. Consumer Goods Textile - Apparel Clothing
ESL Esterline Technologies Corp. Industrial Goods Aerospace/Defense Products & Services
HRLY Herley Industries Inc. Technology Scientific & Technical Instruments
IRET Investors Real Estate Trust Financial REIT - Retail
LTRE Learning Tree International Inc. Services Education & Training Services
NSM National Semiconductor Corporation Technology Semiconductor - Broad Line
WEDC White Electronic Designs Corp. Technology Semiconductor - Broad Line
Wednesday, December 9, 2009
Market wrap - 4:15
Another wild day in the market. Lot's of volatility, dollar strong, then weak, stocks followed the dollar all day. Getting old.
Dow 10,337 51 0.50%
Nasdaq 2,184 11 0.49%
S&P 500 1,096 4 0.37%
Gold 1,121 -22 -1.96%
Oil 70.85 -1.95 -2.68%


Pre-market - Wednesday - 7:50
Futures up slightly today on a weaker dollar overnight.
DJIA INDEX 10,310.00 39.00
S&P 500 1,095.40 5.40
NASDAQ 100 1,777.50 9.00
Today's economic calendar:
MBA Purchase Applications 7:00 AM ET
Wholesale Trade 10:00 AM ET
EIA Petroleum Status Report 10:30 AM ET
10-Yr Note Auction 1:00 PM ET
Today's earnings reports:
Before open:
HITK Hi Tech Pharmacal Co. Inc. Healthcare Drugs - Generic
JTX Jackson Hewitt Tax Service Inc. Services Personal Services
MOV Movado Group Inc. Consumer Goods Recreational Goods, Other
POWL Powell Industries, Inc. Industrial Goods Industrial Electrical Equipment
After close:
ALOG Analogic Corporation Technology Scientific & Technical Instruments
BWY BWAY Holding Company Consumer Goods Packaging & Containers
FCEL FuelCell Energy Inc. Industrial Goods Industrial Electrical Equipment
GEF Greif Inc. Consumer Goods Packaging & Containers
ISSC Innovative Solutions & Support Inc. Technology Business Software & Services
LULU Lululemon Athletica Inc. Consumer Goods Textile - Apparel Clothing
OHB Orleans Homebuilders Inc. Industrial Goods Residential Construction
OXM Oxford Industries Inc. Consumer Goods Textile - Apparel Clothing
PLL Pall Corp. Industrial Goods Diversified Machinery
SGU Star Gas Partners LP Services Specialty Retail, Other
STRM Streamline Health Solutions, Inc. Technology Healthcare Information Services
Tuesday, December 8, 2009
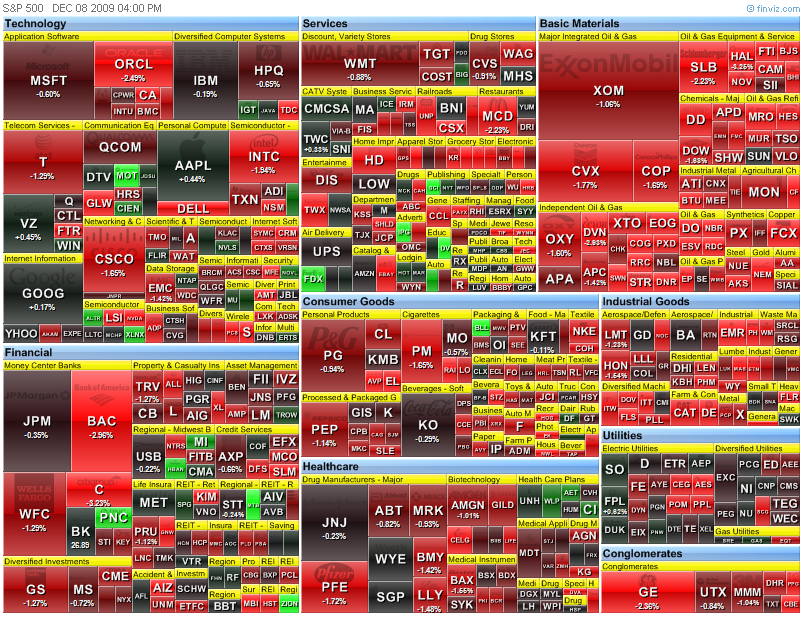
Market wrap - 4:15
The market had another rough day today. Dollar strong all day, bad earnings from Kroger and lower sales numbers from McDonalds.
Dow 10,286 -104 -1.00%
Nasdaq 2,173 -17 -0.76%
S&P 500 1,092 -11 -1.03%
GlobalDow 1,956 -21 -1.05%
Gold 1,143 -21 -1.77%
Oil 72.68 -1.31 -1.77%

Pre-market - Tuesday - December 8, 2009
Futures down pretty good this morning.
DJIA INDEX 10,325.00 -66.00
S&P 500 1,096.00 -7.70
NASDAQ 100 1,769.00 -15.00
Today's economic reports:
ICSC-Goldman Store Sales 7:45 AM ET
Redbook 8:55 AM ET
Bank of Canada Announcement 9:00 AM ET
4-Week Bill Auction 11:30 AM ET
3-Yr Note Auction 1:00 PM ET
Today's earnings reports.
Before open:
AZO AutoZone Inc. Services Auto Parts Stores
BF-B Brown-Forman Corporation Consumer Goods Beverages - Wineries & Distillers
BNS The Bank Of Nova Scotia Financial Money Center Banks
GIGM GigaMedia Ltd. Technology Internet Software & Services
HRB H&R Block, Inc. Services Personal Services
IPSU Imperial Sugar Co. Consumer Goods Confectioners
MGAM Multimedia Games Inc. Services Gaming Activities
MTN Vail Resorts Inc. Services Resorts & Casinos
SAFM Sanderson Farms Inc. Consumer Goods Meat Products
TLB The Talbots Inc. Services Apparel Stores
TTC Toro Co. Industrial Goods Small Tools & Accessories
After close:
AVAV AeroVironment, Inc. Industrial Goods Aerospace/Defense Products & Services
CHP C&D Technologies, Inc. Technology Diversified Electronics
CKR CKE Restaurants Inc. Services Restaurants
CMRO Comarco, Inc. Technology Communication Equipment
CMTL Comtech Telecommunications Corp. Technology Communication Equipment
COO The Cooper Companies Inc. Healthcare Medical Instruments & Supplies
FCE-A Forest City Enterprises Inc. Financial Property Management
MIND Mitcham Industries Inc. Services Rental & Leasing Services
MW The Men's Wearhouse, Inc. Services Apparel Stores
NCS NCI Building Systems Inc. Industrial Goods General Building Materials
ODC Oil-Dri Corp. of America Basic Materials Specialty Chemicals
PLAB Photronics Inc. Technology Semiconductor - Integrated Circuits
SAI SAIC, Inc. Industrial Goods Aerospace/Defense Products & Services
Monday, December 7, 2009
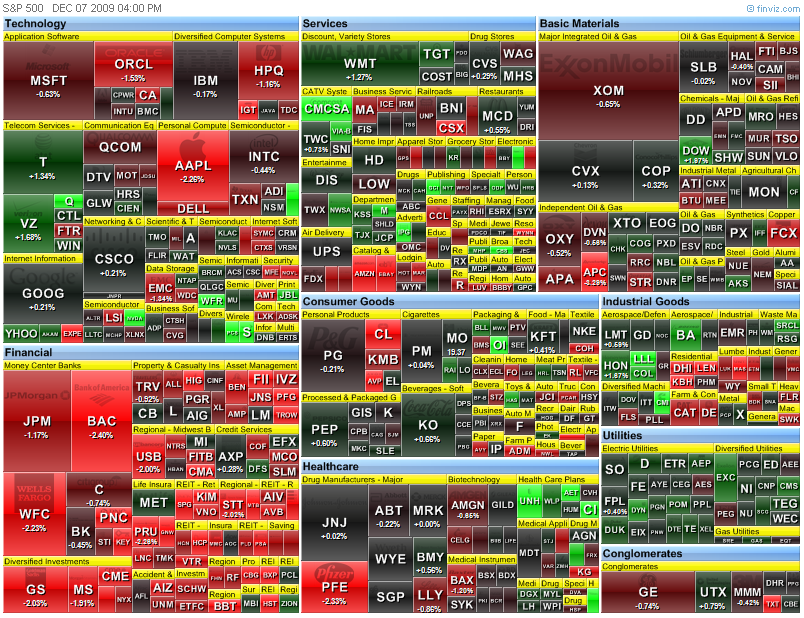
Market wrap - 5:15
Dow 10,390 1 0.01%
Nasdaq 2,190 -5 -0.22%
S&P 500 1,103 -3 -0.25%
GlobalDow 1,976 -2 -0.11%
Gold 1,164 -6 -0.47%
Oil 74.10 -1.54 -2.04%

Pre-market - Monday, December 7, 2009
Futures down a bit this morning, not sure why, perhaps the stronger dollar.
DJIA INDEX 10,364.00 -36.00
S&P 500 1,103.50 -4.60
NASDAQ 100 1,787.75 -7.25
Today's economic calendar:
4-Week Bill Announcement 11:00 AM ET
3-Month Bill Auction 11:30 AM ET
6-Month Bill Auction 11:30 AM ET
Ben Bernanke Speaks 12:00 PM ET
Consumer Credit 3:00 PM ET
Today's earnings reports:
Before open:
BTH Blyth, Inc. Consumer Goods Personal Products
CMM China Mass Media Corp. Services Advertising Agencies
GRB Gerber Scientific Inc. Industrial Goods Diversified Machinery
KMGB KMG Chemicals Inc. Basic Materials Specialty Chemicals
LAYN Layne Christensen Co. Industrial Goods Heavy Construction
After close:
CASY Casey's General Stores Inc. Services Grocery Stores
EFUT e-Future Information Technology Inc. Technology Business Software & Services
FMCN Focus Media Holding Ltd. Services Advertising Agencies
MLNK ModusLink Global Solutions, Inc. Technology Internet Software & Services
PBY Pep Boys - Manny, Moe & Jack Services Auto Parts Stores
REXI Resource America Inc. Financial Asset Management
Friday, December 4, 2009
Market wrap - 4:15
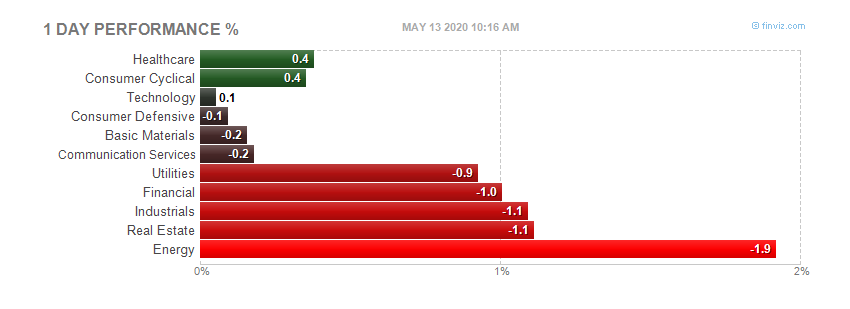
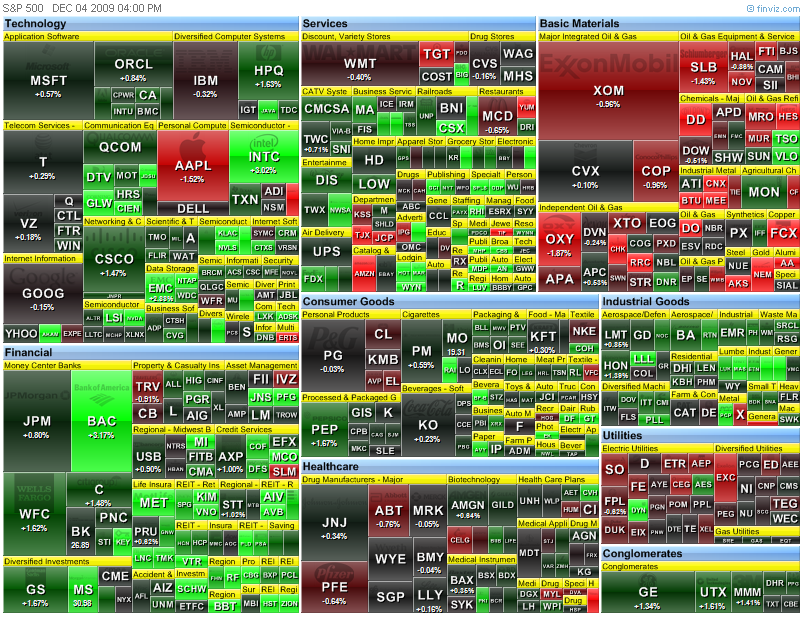
Market ramped up on the opening bell due to extraordinary employment report (the one seemingly nobody believes)to sell off during the day. The dollar was strong all day and Gold just got bitchslapped.
Dow 10,388 22 0.21%
Nasdaq 2,194 21 0.98%
S&P 500 1,106 6 0.54%
GlobalDow 1,975 -8 -0.38%
Gold 1,169 -49 -4.05%
Oil 75.60 -0.99 -1.29%
Pre-market - 8:00
Futures up a little waiting on the employment report.
DJIA INDEX 10,372.00 20.00
S&P 500 1,099.90 1.90
NASDAQ 100 1,782.00 1.75
Today's economic reports:
Employment Situation 8:30 AM ET
Charles Plosser Speaks 10:00 AM ET
Factory Orders 10:00 AM ET
James Bullard Speaks 1:15 PM ET
Treasury STRIPS 3:00 PM ET
Today's earnings reports:
Before open:
BIG Big Lots Inc. Services Discount, Variety Stores
RY Royal Bank of Canada Financial Money Center Banks
SIRO Sirona Dental Systems Inc. Healthcare Medical Appliances & Equipment
After close:
FMCN Focus Media Holding Ltd. Services Advertising Agencies
Thursday, December 3, 2009
Market wrap - 4:30
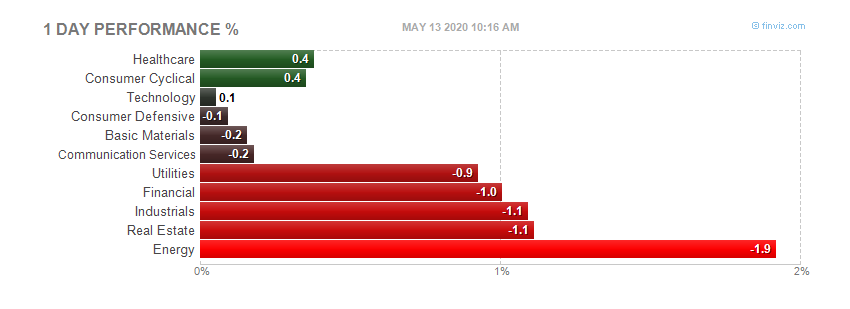
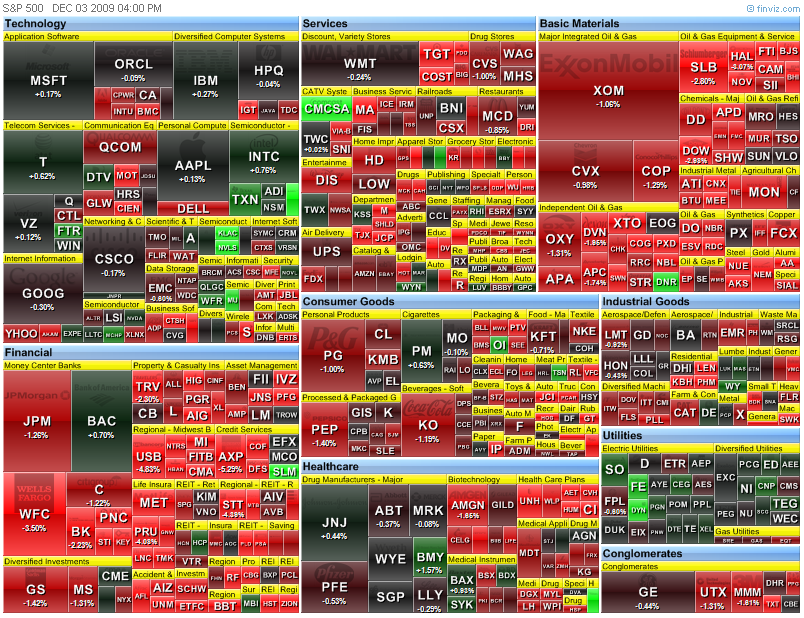
Pretty uneventful day until the last hour when the market decided to sell off. Not sure why, rising dollar, Bernanke testimony, or tomorrows employment report. But something spooked it.
Dow 10,366 -87 -0.83%
Nasdaq 2,173 -12 -0.54%
S&P 500 1,100 -9 -0.84%
Gold 1,218 +5 +0.43%
Oil 75.99 -0.14 -0.18%
ISM Non-manufacturing - 10:00
Full report here - late, link didn't work, and this did move the market.
November 2009 Non-Manufacturing ISM Report On Business®
NMI (Non-Manufacturing Index) at 48.7%
DO NOT CONFUSE THIS NATIONAL REPORT with the various regional purchasing reports released across the country. The national report's information reflects the entire United States, while the regional reports contain primarily regional data from their local vicinities. Also, the information in the regional reports is not used in calculating the results of the national report. The information compiled in this report is for the month of November 2009.
Business Activity Index at 49.6%
New Orders Index at 55.1%
Employment Index at 41.6%
(Tempe, Arizona) — Economic activity in the non-manufacturing sector contracted in November after two consecutive months of expansion, say the nation's purchasing and supply executives in the latest Non-Manufacturing ISM Report On Business®.
The report was issued today by Anthony Nieves, C.P.M., CFPM, chair of the Institute for Supply Management™ Non-Manufacturing Business Survey Committee; and senior vice president — supply management for Hilton Worldwide. "The NMI (Non-Manufacturing Index) registered 48.7 percent in November, 1.9 percentage points lower than the 50.6 percent registered in October, indicating contraction in the non-manufacturing sector after two consecutive months of expansion. The Non-Manufacturing Business Activity Index decreased 5.6 percentage points to 49.6 percent, reflecting contraction after three consecutive months of growth. The New Orders Index decreased 0.5 percentage point to 55.1 percent, and the Employment Index increased 0.5 percentage point to 41.6 percent. The Prices Index increased 4.8 percentage points to 57.8 percent in November, indicating an increase in prices paid from October. According to the NMI, six non-manufacturing industries reported growth in November. Respondents' comments remain cautious about business conditions and reflect concern over the length of time for economic recovery."
INDUSTRY PERFORMANCE (Based on the NMI)
The six industries reporting growth in November based on the NMI composite index — listed in order — are: Other Services; Health Care & Social Assistance; Construction; Finance & Insurance; Retail Trade; and Information. The 11 industries reporting contraction in November — listed in order — are: Real Estate, Rental & Leasing; Management of Companies & Support Services; Mining; Arts, Entertainment & Recreation; Public Administration; Accommodation & Food Services; Educational Services; Wholesale Trade; Transportation & Warehousing; Professional, Scientific & Technical Services; and Utilities.
WHAT RESPONDENTS ARE SAYING ...
* "Capital markets remain very tight; lenders are not releasing funds for development projects, limiting expansion." (Accommodation & Food Services)
* "Fourth quarter still looking grim, but potential upturn for Q1 2010." (Professional, Scientific & Technical Services)
* "No one trusts that the recovery is real. Seems everything and everyone is in a holding pattern." (Public Administration)
* "Business is still flat." (Wholesale Trade)
* "U.S. business remains better than 2007 levels, although it's been through personnel and cost reductions that we are now profitable. Business continues to be about 8 percent below 2008 levels." (Real Estate, Rental & Leasing)
 * Non-Manufacturing ISM Report On Business® data is seasonally adjusted for Business Activity, New Orders, Prices and Employment. Manufacturing ISM Report On Business® data is seasonally adjusted for New Orders, Production, Employment, Supplier Deliveries and Inventories.
** Number of months moving in current direction.
COMMODITIES REPORTED UP / DOWN IN PRICE, and IN SHORT SUPPLY
Commodities Up in Price
Beef; Cheese (4); Diesel Fuel; #1 Diesel Fuel; #2 Diesel Fuel; Fuel (2); Gasoline; Laboratory Equipment; Masks [for TB/H1N1 use] (2); and Pharmacy Supplies.
Commodities Down in Price
Alloys (2); and Carbon Pipe.
Commodities in Short Supply
Masks [for TB/H1N1 use] (2) is the only commodity reported in short supply.
Note: The number of consecutive months the commodity is listed is indicated after each item.
* Non-Manufacturing ISM Report On Business® data is seasonally adjusted for Business Activity, New Orders, Prices and Employment. Manufacturing ISM Report On Business® data is seasonally adjusted for New Orders, Production, Employment, Supplier Deliveries and Inventories.
** Number of months moving in current direction.
COMMODITIES REPORTED UP / DOWN IN PRICE, and IN SHORT SUPPLY
Commodities Up in Price
Beef; Cheese (4); Diesel Fuel; #1 Diesel Fuel; #2 Diesel Fuel; Fuel (2); Gasoline; Laboratory Equipment; Masks [for TB/H1N1 use] (2); and Pharmacy Supplies.
Commodities Down in Price
Alloys (2); and Carbon Pipe.
Commodities in Short Supply
Masks [for TB/H1N1 use] (2) is the only commodity reported in short supply.
Note: The number of consecutive months the commodity is listed is indicated after each item.
* Non-Manufacturing ISM Report On Business® data is seasonally adjusted for Business Activity, New Orders, Prices and Employment. Manufacturing ISM Report On Business® data is seasonally adjusted for New Orders, Production, Employment, Supplier Deliveries and Inventories.
** Number of months moving in current direction.
COMMODITIES REPORTED UP / DOWN IN PRICE, and IN SHORT SUPPLY
Commodities Up in Price
Beef; Cheese (4); Diesel Fuel; #1 Diesel Fuel; #2 Diesel Fuel; Fuel (2); Gasoline; Laboratory Equipment; Masks [for TB/H1N1 use] (2); and Pharmacy Supplies.
Commodities Down in Price
Alloys (2); and Carbon Pipe.
Commodities in Short Supply
Masks [for TB/H1N1 use] (2) is the only commodity reported in short supply.
Note: The number of consecutive months the commodity is listed is indicated after each item.
Elizibeth Warren - America with no middle class - 8:50
This is a pretty good article IMHO. A must read for anyone interested in what is going on. Forget the source, just read what Ms. Warren has to say, she is one of the good ones.
Full link here, which I suggest you use. There are many links to backup her claims, and charts I cannot replicate here.
America Without a Middle Class
Can you imagine an America without a strong middle class? If you can, would it still be America as we know it?
Today, one in five Americans is unemployed, underemployed or just plain out of work. One in nine families can't make the minimum payment on their credit cards. One in eight mortgages is in default or foreclosure. One in eight Americans is on food stamps. More than 120,000 families are filing for bankruptcy every month. The economic crisis has wiped more than $5 trillion from pensions and savings, has left family balance sheets upside down, and threatens to put ten million homeowners out on the street.
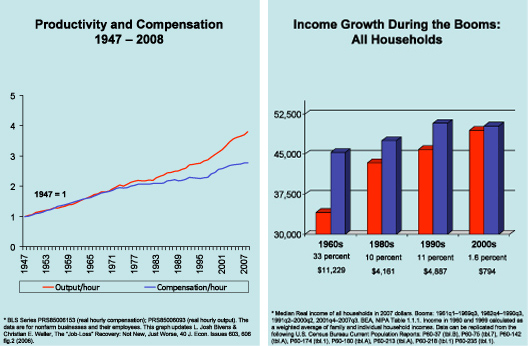
Families have survived the ups and downs of economic booms and busts for a long time, but the fall-behind during the busts has gotten worse while the surge-ahead during the booms has stalled out. In the boom of the 1960s, for example, median family income jumped by 33% (adjusted for inflation). But the boom of the 2000s resulted in an almost-imperceptible 1.6% increase for the typical family. While Wall Street executives and others who owned lots of stock celebrated how good the recovery was for them, middle class families were left empty-handed.
The crisis facing the middle class started more than a generation ago. Even as productivity rose, the wages of the average fully-employed male have been flat since the 1970s.
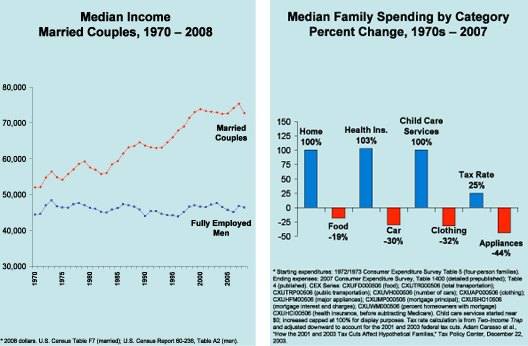
 But core expenses kept going up. By the early 2000s, families were spending twice as much (adjusted for inflation) on mortgages than they did a generation ago -- for a house that was, on average, only ten percent bigger and 25 years older. They also had to pay twice as much to hang on to their health insurance.
To cope, millions of families put a second parent into the workforce. But higher housing and medical costs combined with new expenses for child care, the costs of a second car to get to work and higher taxes combined to squeeze families even harder. Even with two incomes, they tightened their belts. Families today spend less than they did a generation ago on food, clothing, furniture, appliances, and other flexible purchases -- but it hasn't been enough to save them. Today's families have spent all their income, have spent all their savings, and have gone into debt to pay for college, to cover serious medical problems, and just to stay afloat a little while longer.
But core expenses kept going up. By the early 2000s, families were spending twice as much (adjusted for inflation) on mortgages than they did a generation ago -- for a house that was, on average, only ten percent bigger and 25 years older. They also had to pay twice as much to hang on to their health insurance.
To cope, millions of families put a second parent into the workforce. But higher housing and medical costs combined with new expenses for child care, the costs of a second car to get to work and higher taxes combined to squeeze families even harder. Even with two incomes, they tightened their belts. Families today spend less than they did a generation ago on food, clothing, furniture, appliances, and other flexible purchases -- but it hasn't been enough to save them. Today's families have spent all their income, have spent all their savings, and have gone into debt to pay for college, to cover serious medical problems, and just to stay afloat a little while longer.
 Through it all, families never asked for a handout from anyone, especially Washington. They were left to go on their own, working harder, squeezing nickels, and taking care of themselves. But their economic boats have been taking on water for years, and now the crisis has swamped millions of middle class families.
The contrast with the big banks could not be sharper. While the middle class has been caught in an economic vise, the financial industry that was supposed to serve them has prospered at their expense. Consumer banking -- selling debt to middle class families -- has been a gold mine. Boring banking has given way to creative banking, and the industry has generated tens of billions of dollars annually in fees made possible by deceptive and dangerous terms buried in the fine print of opaque, incomprehensible, and largely unregulated contracts.
And when various forms of this creative banking triggered economic crisis, the banks went to Washington for a handout. All the while, top executives kept their jobs and retained their bonuses. Even though the tax dollars that supported the bailout came largely from middle class families -- from people already working hard to make ends meet -- the beneficiaries of those tax dollars are now lobbying Congress to preserve the rules that had let those huge banks feast off the middle class.
Pundits talk about "populist rage" as a way to trivialize the anger and fear coursing through the middle class. But they have it wrong. Families understand with crystalline clarity that the rules they have played by are not the same rules that govern Wall Street. They understand that no American family is "too big to fail." They recognize that business models have shifted and that big banks are pulling out all the stops to squeeze families and boost revenues. They understand that their economic security is under assault and that leaving consumer debt effectively unregulated does not work.
Families are ready for change. According to polls, large majorities of Americans have welcomed the Obama Administration's proposal for a new Consumer Financial Protection Agency (CFPA). The CFPA would be answerable to consumers -- not to banks and not to Wall Street. The agency would have the power to end tricks-and-traps pricing and to start leveling the playing field so that consumers have the tools they need to compare prices and manage their money. The response of the big banks has been to swing into action against the Agency, fighting with all their lobbying might to keep business-as-usual. They are pulling out all the stops to kill the agency before it is born. And if those practices crush millions more families, who cares -- so long as the profits stay high and the bonuses keep coming.
America today has plenty of rich and super-rich. But it has far more families who did all the right things, but who still have no real security. Going to college and finding a good job no longer guarantee economic safety. Paying for a child's education and setting aside enough for a decent retirement have become distant dreams. Tens of millions of once-secure middle class families now live paycheck to paycheck, watching as their debts pile up and worrying about whether a pink slip or a bad diagnosis will send them hurtling over an economic cliff.
America without a strong middle class? Unthinkable, but the once-solid foundation is shaking.
Elizabeth Warren is the Leo Gottlieb Professor of Law at Harvard and is currently the Chair of the Congressional Oversight Panel.
Through it all, families never asked for a handout from anyone, especially Washington. They were left to go on their own, working harder, squeezing nickels, and taking care of themselves. But their economic boats have been taking on water for years, and now the crisis has swamped millions of middle class families.
The contrast with the big banks could not be sharper. While the middle class has been caught in an economic vise, the financial industry that was supposed to serve them has prospered at their expense. Consumer banking -- selling debt to middle class families -- has been a gold mine. Boring banking has given way to creative banking, and the industry has generated tens of billions of dollars annually in fees made possible by deceptive and dangerous terms buried in the fine print of opaque, incomprehensible, and largely unregulated contracts.
And when various forms of this creative banking triggered economic crisis, the banks went to Washington for a handout. All the while, top executives kept their jobs and retained their bonuses. Even though the tax dollars that supported the bailout came largely from middle class families -- from people already working hard to make ends meet -- the beneficiaries of those tax dollars are now lobbying Congress to preserve the rules that had let those huge banks feast off the middle class.
Pundits talk about "populist rage" as a way to trivialize the anger and fear coursing through the middle class. But they have it wrong. Families understand with crystalline clarity that the rules they have played by are not the same rules that govern Wall Street. They understand that no American family is "too big to fail." They recognize that business models have shifted and that big banks are pulling out all the stops to squeeze families and boost revenues. They understand that their economic security is under assault and that leaving consumer debt effectively unregulated does not work.
Families are ready for change. According to polls, large majorities of Americans have welcomed the Obama Administration's proposal for a new Consumer Financial Protection Agency (CFPA). The CFPA would be answerable to consumers -- not to banks and not to Wall Street. The agency would have the power to end tricks-and-traps pricing and to start leveling the playing field so that consumers have the tools they need to compare prices and manage their money. The response of the big banks has been to swing into action against the Agency, fighting with all their lobbying might to keep business-as-usual. They are pulling out all the stops to kill the agency before it is born. And if those practices crush millions more families, who cares -- so long as the profits stay high and the bonuses keep coming.
America today has plenty of rich and super-rich. But it has far more families who did all the right things, but who still have no real security. Going to college and finding a good job no longer guarantee economic safety. Paying for a child's education and setting aside enough for a decent retirement have become distant dreams. Tens of millions of once-secure middle class families now live paycheck to paycheck, watching as their debts pile up and worrying about whether a pink slip or a bad diagnosis will send them hurtling over an economic cliff.
America without a strong middle class? Unthinkable, but the once-solid foundation is shaking.
Elizabeth Warren is the Leo Gottlieb Professor of Law at Harvard and is currently the Chair of the Congressional Oversight Panel.
But core expenses kept going up. By the early 2000s, families were spending twice as much (adjusted for inflation) on mortgages than they did a generation ago -- for a house that was, on average, only ten percent bigger and 25 years older. They also had to pay twice as much to hang on to their health insurance.
To cope, millions of families put a second parent into the workforce. But higher housing and medical costs combined with new expenses for child care, the costs of a second car to get to work and higher taxes combined to squeeze families even harder. Even with two incomes, they tightened their belts. Families today spend less than they did a generation ago on food, clothing, furniture, appliances, and other flexible purchases -- but it hasn't been enough to save them. Today's families have spent all their income, have spent all their savings, and have gone into debt to pay for college, to cover serious medical problems, and just to stay afloat a little while longer.
Through it all, families never asked for a handout from anyone, especially Washington. They were left to go on their own, working harder, squeezing nickels, and taking care of themselves. But their economic boats have been taking on water for years, and now the crisis has swamped millions of middle class families.
The contrast with the big banks could not be sharper. While the middle class has been caught in an economic vise, the financial industry that was supposed to serve them has prospered at their expense. Consumer banking -- selling debt to middle class families -- has been a gold mine. Boring banking has given way to creative banking, and the industry has generated tens of billions of dollars annually in fees made possible by deceptive and dangerous terms buried in the fine print of opaque, incomprehensible, and largely unregulated contracts.
And when various forms of this creative banking triggered economic crisis, the banks went to Washington for a handout. All the while, top executives kept their jobs and retained their bonuses. Even though the tax dollars that supported the bailout came largely from middle class families -- from people already working hard to make ends meet -- the beneficiaries of those tax dollars are now lobbying Congress to preserve the rules that had let those huge banks feast off the middle class.
Pundits talk about "populist rage" as a way to trivialize the anger and fear coursing through the middle class. But they have it wrong. Families understand with crystalline clarity that the rules they have played by are not the same rules that govern Wall Street. They understand that no American family is "too big to fail." They recognize that business models have shifted and that big banks are pulling out all the stops to squeeze families and boost revenues. They understand that their economic security is under assault and that leaving consumer debt effectively unregulated does not work.
Families are ready for change. According to polls, large majorities of Americans have welcomed the Obama Administration's proposal for a new Consumer Financial Protection Agency (CFPA). The CFPA would be answerable to consumers -- not to banks and not to Wall Street. The agency would have the power to end tricks-and-traps pricing and to start leveling the playing field so that consumers have the tools they need to compare prices and manage their money. The response of the big banks has been to swing into action against the Agency, fighting with all their lobbying might to keep business-as-usual. They are pulling out all the stops to kill the agency before it is born. And if those practices crush millions more families, who cares -- so long as the profits stay high and the bonuses keep coming.
America today has plenty of rich and super-rich. But it has far more families who did all the right things, but who still have no real security. Going to college and finding a good job no longer guarantee economic safety. Paying for a child's education and setting aside enough for a decent retirement have become distant dreams. Tens of millions of once-secure middle class families now live paycheck to paycheck, watching as their debts pile up and worrying about whether a pink slip or a bad diagnosis will send them hurtling over an economic cliff.
America without a strong middle class? Unthinkable, but the once-solid foundation is shaking.
Elizabeth Warren is the Leo Gottlieb Professor of Law at Harvard and is currently the Chair of the Congressional Oversight Panel.
Productivity and Costs - 8:30
Full report here
PRODUCTIVITY AND COSTS
Third Quarter 2009, Revised
Nonfarm business sector labor productivity increased at an 8.1 percent
annual rate during the third quarter of 2009, the U.S. Bureau of Labor
Statistics reported today (tables A and 2). This was the largest gain in
productivity since the third quarter of 2003, and reflects a 2.9 percent
increase in output and a 4.8 percent decline in hours worked. (All
quarterly percent changes in this release are seasonally adjusted annual
rates.)
Labor productivity is calculated by dividing an index of real output by an
index of the combined hours worked of all persons, including employees,
proprietors, and unpaid family workers. The productivity measures released
today were based on more recent and more complete data than were available
for the preliminary report issued last month (see Revised measures).
Unit labor costs in nonfarm businesses fell 2.5 percent in the third
quarter of 2009, as productivity grew at a faster rate (8.1 percent) than
hourly compensation (5.4 percent). Unit labor costs declined 1.4 percent
over the last four quarters (tables A and 2). BLS defines unit labor costs
as the ratio of hourly compensation to labor productivity; increases in
hourly compensation tend to increase unit labor costs and increases in
output per hour tend to reduce them.
Manufacturing sector productivity grew 13.4 percent in the third quarter
of 2009, as output rose 8.4 percent and hours worked fell 4.4 percent
(tables A and 3). The third quarter gain in manufacturing productivity was
the largest in the series, which begins in the second quarter of 1987.
Over the last four quarters, manufacturing productivity grew 3.0 percent.
Manufacturing unit labor costs fell 6.1 percent in the third quarter of
2009, but rose 3.0 percent over the last four quarters.
The data sources and methods used in the preparation of the manufacturing
output series differ from those used in preparing the business and nonfarm
business output series, and these measures are not directly comparable.
See Technical Notes for more information on data sources.
Revised measures
Table B presents previous and revised productivity and related measures
for the major sectors: business, nonfarm business and manufacturing, for
the second and third quarters of 2009.
In the third quarter of 2009, nonfarm business productivity was revised
down from 9.5 percent to 8.1 percent, reflecting a downward revision to
output and an upward revision to hours. Unit labor costs declined 2.5
percent rather than falling 5.2 percent as previously reported; this
upward revision was due both to the downward revision to productivity and
the 1.6 percentage-point upward revision to hourly compensation. In the
manufacturing sector, upward revisions to both output and hours affected
productivity, which was revised slightly down by 0.2 percentage point.
In the second quarter of 2009, nonfarm business productivity was not
revised. However, unit labor costs were revised to show zero growth during
the second quarter rather than decreasing 6.1 percent as previously
reported. This upward revision to unit labor costs was due solely to the
large upward revision to hourly compensation. In the manufacturing sector,
second quarter productivity was not revised; unit labor costs were revised
upward by 1.3 percentage points.
More at link with formatted tables
Jobless claims - 8:30
Full report here
UNEMPLOYMENT INSURANCE WEEKLY CLAIMS REPORT
SEASONALLY ADJUSTED DATA
In the week ending Nov. 28, the advance figure for seasonally adjusted initial claims was 457,000, a decrease of 5,000 from the previous week's revised figure of 462,000. The 4-week moving average was 481,250, a decrease of 14,250 from the previous week's revised average of 495,500.
The advance seasonally adjusted insured unemployment rate was 4.1 percent for the week ending Nov. 21, unchanged from the prior week's unrevised rate of 4.1 percent.
The advance number for seasonally adjusted insured unemployment during the week ending Nov. 21 was 5,465,000, an increase of 28,000 from the preceding week's revised level of 5,437,000. The 4-week moving average was 5,541,500, a decrease of 75,750 from the preceding week's revised average of 5,617,250.
The fiscal year-to-date average for seasonally adjusted insured unemployment for all programs is 5.832 million.
UNADJUSTED DATA
The advance number of actual initial claims under state programs, unadjusted, totaled 460,989 in the week ending Nov. 28, a decrease of 78,263 from the previous week. There were 535,730 initial claims in the comparable week in 2008.
The advance unadjusted insured unemployment rate was 3.6 percent during the week ending Nov. 21, a decrease of 0.3 percentage point from the prior week. The advance unadjusted number for persons claiming UI benefits in state programs totaled 4,787,291, a decrease of 296,052 from the preceding week. A year earlier, the rate was 2.7 percent and the volume was 3,652,990.
Extended benefits were available in Alabama, Alaska, Arizona, California, Colorado, Connecticut, Delaware, the District of Columbia, Florida, Georgia, Idaho, Illinois, Indiana, Kansas, Kentucky, Maine, Massachusetts, Michigan, Minnesota, Missouri, Nevada, New Hampshire, New Jersey, New Mexico, New York, North Carolina, Ohio, Oregon, Pennsylvania, Puerto Rico, Rhode Island, South Carolina, Tennessee, Texas, Vermont, Virginia, Washington, West Virginia, and Wisconsin during the week ending Nov. 14.
Initial claims for UI benefits by former Federal civilian employees totaled 2,269 in the week ending Nov. 21, a decrease of 101 from the prior week. There were 2,330 initial claims by newly discharged veterans, an increase of 368 from the preceding week.
There were 24,523 former Federal civilian employees claiming UI benefits for the week ending Nov. 14, an increase of 1,389 from the previous week. Newly discharged veterans claiming benefits totaled 36,359, an increase of 1,752 from the prior week.
States reported 3,859,553 persons claiming EUC (Emergency Unemployment Compensation) benefits for the week ending Nov. 14, an increase of 265,300 from the prior week. There were 777,393 claimants in the comparable week in 2008. EUC weekly claims include first, second, and third tier activity.
The highest insured unemployment rates in the week ending Nov. 14 were in Puerto Rico (6.1 percent), Oregon (5.9), Alaska (5.5), California (5.2), Nevada (5.2), Michigan (5.1), Pennsylvania (5.0), Wisconsin (5.0), North Carolina (4.8), and Washington (4.7).
The largest increases in initial claims for the week ending Nov. 21 were in California (+14,796), Illinois (+6,168), North Carolina (+5,557), Pennsylvania (+5,285), and Texas (+3,500), while the largest decreases were in Michigan (-1,242), Indiana (-987), Hawaii (-195), Oregon (-167), and the Virgin Islands (-10).
Pre-market - 7:50
Futures up on last nights news about BAC paying back TARP money - an of course a weaker dollar overnight.
DJIA INDEX 10,467.00 28.00
S&P 500 1,111.10 3.20
NASDAQ 100 1,793.75 2.25
Today's economic reports:
Chain Store Sales
Monster Employment Index
ECB Announcement 7:45 AM ET - rate unchanged
Jobless Claims 8:30 AM ET
Productivity and Costs 8:30 AM ET
30-Yr Bond Announcement 9:00 AM ET
ISM Non-Mfg Index 10:00 AM ET
EIA Natural Gas Report 10:30 AM ET
3-Month Bill Announcement 11:00 AM ET
6-Month Bill Announcement 11:00 AM ET
3-Yr Note Announcement 11:00 AM ET
10-Yr Note Announcement 11:00 AM ET
Eric Rosengren Speaks 12:30 PM ET
Money Supply 4:30 PM ET
Today's earnings reports.
Before open:
APWR A-Power Energy Generation Systems, Ltd. Utilities Electric Utilities
CM Canadian Imperial Bank of Commerce Financial Money Center Banks
CUB Cubic Corp. Technology Scientific & Technical Instruments
DLM Del Monte Foods Co. Consumer Goods Processed & Packaged Goods
FLOW Flow International Corp. Industrial Goods Machine Tools & Accessories
MDNU Medical Nutrition USA, Inc. Healthcare Drug Related Products
RSC REX Stores Corp. Services Electronics Stores
STST Argon ST, Inc. Technology Scientific & Technical Instruments
TD Toronto-Dominion Bank Financial Money Center Banks
TOL Toll Brothers Inc. Industrial Goods Residential Construction
TUTR Plato Learning, Inc. Services Business Services
UTIW UTI Worldwide, Inc. Services Air Delivery & Freight Services
After close:
AMSWA American Software, Inc. Technology Application Software
ARST ArcSight, Inc. Technology Business Software & Services
AVAV AeroVironment, Inc. Industrial Goods Aerospace/Defense Products & Services
AVGO Avago Technologies Limited Technology Semiconductor - Broad Line
CMTL Comtech Telecommunications Corp. Technology Communication Equipment
CPWM Cost Plus Inc. Services Department Stores
CRI Carter's, Inc. Consumer Goods Textile - Apparel Clothing
DMND Diamond Foods, Inc. Consumer Goods Processed & Packaged Goods
LAVA Magma Design Automation Inc. Technology Business Software & Services
LQDT Liquidity Services, Inc. Technology Internet Software & Services
MENT Mentor Graphics Corp. Technology Technical & System Software
MRVL Marvell Technology Group Ltd. Technology Semiconductor - Integrated Circuits
NOVL Novell Inc. Technology Security Software & Services
OHB Orleans Homebuilders Inc. Industrial Goods Residential Construction
ULTA Ulta Salon, Cosmetics & Fragrance, Inc. Services Personal Services
XETA XETA Technologies Inc. Technology Communication Equipment
Wednesday, December 2, 2009
Market wrap - 4:15
Mixed day in the market, not much happening.
Dow 10,453 -19 -0.18%
Nasdaq 2,185 9 0.42%
S&P 500 1,109 0 0.03%
GlobalDow 1,984 +6 +0.29%
Gold 1,213 +13 +1.07%
Oil 76.62 -1.77 -2.26%

Beige Book - 2:00
Full report here
Prepared at the Federal Reserve Bank of New York and based on information collected on or before November 20, 2009. This document summarizes comments received from businesses and other contacts outside the Federal Reserve and is not a commentary on the views of Federal Reserve officials.
Reports from the twelve Federal Reserve Districts indicate that economic conditions have generally improved modestly since the last report. Eight Districts indicated some pickup in activity or improvement in conditions, while the remaining four--Philadelphia, Cleveland, Richmond, and Atlanta--reported that conditions were little changed and/or mixed.
Consumer spending was reported to have picked up moderately since the last report, for both general merchandise and vehicles; a number of Districts noted relatively robust sales of used autos. Most Districts indicated that non-auto retailers were holding lean inventories going into the holiday season. Tourism activity varied across Districts. Manufacturing conditions were said to be, on balance, steady to moderately improving across most of the country, while conditions in the nonfinancial service sector generally strengthened somewhat, though with some variation across Districts and across industries. Residential real estate conditions were somewhat improved from very low levels, on balance, led by the lower end of the market. Most Districts reported some pickup in home sales, though prices were generally said to be flat or declining modestly; residential construction was characterized as weak, but some Districts did note some pickup in activity. Commercial real estate markets and construction activity were depicted as very weak and, in many cases, deteriorating.
Financial institutions generally reported steady to weaker loan demand, continued tight credit standards, and steady or deteriorating loan quality. In the agricultural sector, the fall harvest was delayed in the eastern half of the nation due to excessively wet conditions during October and early November. Most energy-producing Districts noted a slight uptick in activity in the sector since the last report. Labor market conditions remained weak since the last report, though there were signs of stabilization and scattered signs of improvement. While some Districts reported upward pressure on commodity prices, they saw little or no indication of upward wage pressures or of any significant increase in prices of finished goods.
Consumer Spending and Tourism
Consumer spending strengthened since the last report, with sales of both general merchandise and autos improving across much of the country. Non-auto sales were reported to have picked up in the New York, Philadelphia, Cleveland, Richmond, Atlanta, Kansas City, and San Francisco Districts; sales were described as steady or mixed in the Boston, Chicago, Minneapolis, and Dallas Districts. St. Louis described retail sales as below expectations and down from a year earlier. Auto sales generally improved since the last report, in some cases rebounding from a brief dip after the "cash-for-clunkers" program ended. Increased vehicle sales were reported from New York, Philadelphia, Richmond, Chicago, St. Louis, and Dallas, while sales were described as flat or mixed in the Cleveland, Minneapolis, Kansas City, and San Francisco Districts. A number of Districts reported that used vehicles have been selling better than new ones.
Most Districts also noted that retailers were holding leaner inventories this holiday season, though some indicate that retailers have recently become more optimistic about the holiday-season outlook. Auto dealers' inventories, largely depleted during the cash-for-clunkers program, have been or are being rebuilt.
Tourism was mixed across those Districts reporting. Travel and tourism--especially leisure travel--was described as robust or improved in the New York, Dallas, and San Francisco Districts. Atlanta and Kansas City characterized tourism as sluggish, while Richmond and Minneapolis described it as mixed; Richmond noted that tourism has been adversely affected by severe and damaging coastal storms, while Kansas City characterized the outlook as "grim." New York indicated that business travel remained sluggish, but Minneapolis and Dallas note a slight pickup.
Nonfinancial Services
Activity in the service sector generally picked up since the last report, though results were mixed across Districts and across service industries. New York and Philadelphia reported that service-sector activity overall remained steady to up slightly, while St. Louis noted expanding activity. The information technology industry was reported to be showing improvement in the Boston, Minneapolis, and Kansas City Districts. A pickup in activity at staffing firms was reported by Boston and Dallas, whereas New York noted that activity remained sluggish. Strength in health services was noted in the Boston and Richmond Districts. Shipping activity was characterized as flat in the Cleveland, Atlanta, and Kansas City District, while Dallas reports some gain; however, Dallas and Atlanta both noted particular weakness in rail shipping activity. Professional and business support firms reportedly registered some improvement in the St. Louis and Minneapolis Districts but flat to declining activity in Richmond and San Francisco.
Manufacturing
Most Districts reported mixed to moderately improving manufacturing conditions since the last report. New York, Philadelphia, Cleveland, Minneapolis, Kansas City, and San Francisco all noted modest increases in manufacturing activity within their Districts. Manufacturing conditions in the Boston and Dallas Districts were characterized as mixed, with some improvement noted for biopharmaceuticals companies in Boston and high-tech manufacturing firms in Dallas. By contrast, Richmond and Chicago both reported that manufacturing activity had leveled off since the last report, while activity continued to decline in the Atlanta and St. Louis Districts, although at a somewhat slower pace than the last report. Tighter credit limited the ability of customers to place new orders in the Richmond District, while in the Chicago District, contacts noted a slowdown in the restocking of inventories. Increases in activity related to the transportation industry were cited in the Chicago, St. Louis, Cleveland, and Kansas City Districts, although such activity was mixed in the Dallas District and reported as declining in the San Francisco District. Several Districts noted an uptick in food-related production.
Many Districts reported that their contacts were optimistic about the near-term outlook. Manufacturers in the Boston, New York, Philadelphia, Atlanta, Minneapolis, and Kansas City Districts expected business conditions to improve in the coming months, while producers in the Cleveland District expressed uncertainty about near-term conditions. The outlook in the Dallas District was mixed, with most manufacturers expressing cautious optimism about the near term and construction-related manufacturers expressing pessimism about the future largely due to expectations of prolonged weakness in commercial real estate.
Real Estate and Construction
Home sales and construction activity improved across much of the nation, though prices were generally said to be flat or still declining somewhat. A majority of Districts reported that the lower-priced segment of the housing market has outperformed the high end. Increases in sales activity were reported in the Boston, Cleveland, Richmond, Atlanta, Chicago, Minneapolis, Kansas City, Dallas, and San Francisco Districts, whereas sales were described as steady or mixed in the New York and Philadelphia Districts. Multifamily housing markets deteriorated further in the New York and Chicago Districts. More broadly, a number of eastern Districts reported continued declines in home prices--specifically, Boston, New York, Philadelphia, and Richmond. In contrast, prices were said to have firmed somewhat in the Dallas and San Francisco Districts and stabilized in the Chicago and Kansas City Districts. Most reports maintained that the lower end of the market has outperformed the higher end: New York, Philadelphia, Richmond, Atlanta, Minneapolis, and Kansas City all noted relative weakness at the high end of the market, with relative strength at the lower end; in most cases, this strength was largely attributed to the homebuyer tax credit (which was recently reinstated and expanded to include existing owners).
Despite the firming in sales, the level of new residential construction activity was generally characterized as weak, though recent trends have been mixed--Atlanta, Kansas City, and Dallas noted some pickup in home construction, whereas the Chicago and St. Louis Districts reported declines. Residential construction was described as flat or stabilizing by Cleveland, Minneapolis, and San Francisco.
Commercial real estate conditions were widely characterized as weak and, in many cases, deteriorating further. Market conditions were reported to have weakened in virtually all Districts, with rising vacancy rates, downward pressure on rents, and little, if any, new development. Expectations for 2010 were also quite low. Boston characterized the commercial real estate outlook as "bleak," Dallas noted that construction was at "historically low levels," and Kansas City described the sector as "distressed." Still, some Districts noted scattered signs of encouragement: Cleveland and Chicago referenced public-works projects as a source of increased business, Richmond noted signs of increased leasing activity from the health and education sectors, Atlanta indicated a modest pickup in new development projects, Minneapolis noted some recently started hotel and retail development, and San Francisco cited slight improvement in availability of financing for new development.
Banking and Finance
Banks reported steady to softer conditions in most Districts. Loan demand was said to have weakened in the New York, Philadelphia, Cleveland, St. Louis, Kansas City, and Dallas Districts. New York noted particular weakness in demand for home mortgage loans, whereas Richmond and St. Louis reported this to be the strongest segment of late. For the most part, the weakness appears to have been concentrated in the commercial sector, though Boston and Chicago reported some pickup in commercial real estate lending--largely refinancing. Credit quality showed signs of deteriorating in the New York, Philadelphia, Dallas, and San Francisco Districts but was described as stable or mixed in Cleveland, Chicago, and Kansas City, with Chicago reporting some improvement outside of commercial real estate. Increasingly tight credit standards were reported in the New York, Richmond, Chicago, St. Louis, Dallas, and San Francisco--largely on commercial loans.
Agriculture and Natural Resources
Excessively wet conditions during October and early November were reported in a number of Districts. As a result, the fall harvest was delayed in many parts of the Richmond, Atlanta, Chicago, St. Louis, Minneapolis, and Kansas City Districts. Flooding from Tropical Storm Ida and a November "nor'easter" damaged crops and delayed planting throughout the Richmond District, and Virginia health officials closed fishing in all Chesapeake Bay tributaries and temporarily banned the harvesting of shellfish due to potential storm water contamination. By contrast, rainfall in the Dallas District helped alleviate drought conditions experienced in many parts of the region. Contacts in the Chicago, Minneapolis, and Kansas City Districts noted that corn and soybean prices rallied over the past month, although a wide variation in margins was expected for crop farms due to differences in input costs. Losses for livestock operations occurred in the Chicago and Kansas City Districts.
Most energy-producing Districts reported a slight uptick in activity in extraction industries since the last report. Contacts in the Cleveland, Atlanta, Dallas, Minneapolis, Kansas City, and San Francisco Districts noted steady to increasing oil and natural gas production within their regions, albeit from low levels of production observed earlier this year. Contacts in the Cleveland District also reported that a sharp decline in coal production had leveled out since the last report. In general, oil prices increased somewhat, while reports on the price of natural gas were mixed due in large part to differences in inventory levels across Districts. Mining activity in the Minneapolis District increased.
Employment, Wages, and Prices
Labor market conditions remained weak since the last report, with further layoffs, sluggish hiring, and high levels of unemployment in most Districts. However, contacts in the Atlanta, Cleveland, and Richmond Districts reported that the pace of job cuts generally slowed in their regions, and most contacts in the Dallas District reported stable employment levels. Despite generally weak employment conditions, some signs of improvement were noted. For example, contacts in Boston reported that they were beginning to hire and reverse pay cuts or freezes that were implemented earlier in the year, and contacts in the St. Louis District reported that the service sector had started to expand recently. Expectations for the holiday season were mixed across Districts, with contacts in the New York and Dallas Districts reporting lighter-than-normal seasonal hiring and/or increases in the hours of existing employees, as opposed to hiring temporary workers, to meet the seasonal demand. On the other hand, most retailers in the Richmond District have hired the usual number of seasonal workers this year.
Districts generally reported little or no upward wage pressures, while some Districts noted upward pressure in commodity prices, and most Districts reported stable selling prices. Wages were largely reported to be holding steady in the Boston, Cleveland, Richmond, Chicago, Minneapolis, Kansas City, Dallas, and San Francisco Districts. Most Districts reported stable prices overall, although some reported higher input prices, largely for energy and other commodities used in production, with a limited ability to raise selling prices. Prices were reported as moderately lower in the Kansas City District, and downward price pressures were cited for some professional services and intermodal transportation firms in the Dallas District. Some makers of food products and chemicals in the Philadelphia District reported raising prices, and the prices of computer memory chips continued to firm in the San Francisco District. Retailers in several Districts indicated that they have managed inventory levels in an effort to prevent the steep price discounting that occurred last year, however, some promotional price discounting is expected through the holiday season.
Pre-market - Wednesday, December 2
Futures just plain flat today. Not worth posting - just flat.
Today's economic news:
MBA Purchase Applications 7:00 AM ET
Challenger Job-Cut Report 7:30 AM ET
ADP Employment Report 8:15 AM ET
Tim Geithner Speaks 9:30 AM ET
EIA Petroleum Status Report 10:30 AM ET
Beige Book 2:00 PM ET
Before open:
CHRS Charming Shoppes Inc. Services Apparel Stores
DSGX Descartes Systems Group Inc. Technology Business Software & Services
GIII G-III Apparel Group, Ltd. Consumer Goods Textile - Apparel Clothing
JOSB Jos. A Bank Clothiers Inc. Services Apparel Stores
PTRY Pantry Inc. Services Grocery Stores
SYNO Synovis Life Technologies Inc. Healthcare Medical Appliances & Equipment
After close:
ARO Aeropostale Inc. Services Apparel Stores
ATCO American Technology Corp. Technology Diversified Electronics
CWST Casella Waste Systems Inc. Industrial Goods Waste Management
DDMX Dynamex Inc. Services Trucking
JAS Jo-Ann Stores, Inc. Services Specialty Retail, Other
PSS Collective Brands, Inc. Services Apparel Stores
SEAC SeaChange International Inc. Technology Processing Systems & Products
SIGM Sigma Designs, Inc. Technology Semiconductor - Specialized
SNPS Synopsys Inc. Technology Technical & System Software
Tuesday, December 1, 2009
Market wrap - 6:30
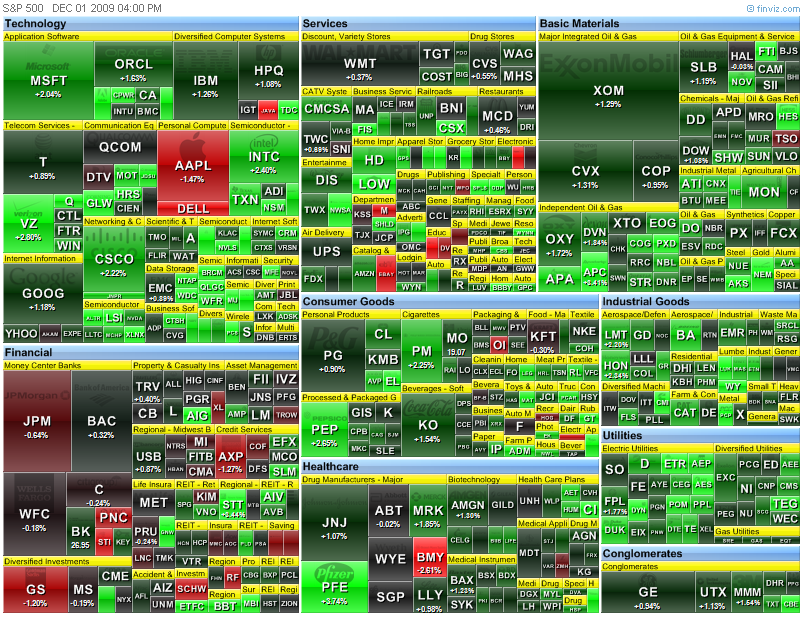
Just another day in the casino. Large gap up this morning, traded a bit higher during the day, only to sell off a bit in the last hour and a half. Notice GS & AAPL, the leaders since March.
Dow 10,472 127 1.23%
Nasdaq 2,176 31 1.46%
S&P 500 1,109 +13 +1.21%
Gold 1,200 +18 +1.51%
Oil 77.93 +1.09 +1.41%
ISM manufacturing - 10:00 - late because link did not work
Full report here
November 2009 Manufacturing ISM Report On Business®
PMI at 53.6%
DO NOT CONFUSE THIS NATIONAL REPORT with the various regional purchasing reports released across the country. The national report's information reflects the entire United States, while the regional reports contain primarily regional data from their local vicinities. Also, the information in the regional reports is not used in calculating the results of the national report. The information compiled in this report is for the month of November 2009.
New Orders, Production and Employment Growing
Inventories Contracting
Supplier Deliveries Slower
(Tempe, Arizona) — Economic activity in the manufacturing sector expanded in November for the fourth consecutive month, and the overall economy grew for the seventh consecutive month, say the nation's supply executives in the latest Manufacturing ISM Report On Business®.
The report was issued today by Norbert J. Ore, CPSM, C.P.M., chair of the Institute for Supply Management™ Manufacturing Business Survey Committee. "The manufacturing sector grew for the fourth consecutive month in November. While the rate of growth slowed when compared to October, the signs are still encouraging for continuing growth as both new orders and production are still at very positive levels, and the Prices Index fell 10 points, signaling less inflationary pressure on manufacturers' costs. Overall, the recovery in manufacturing is continuing, but many are still struggling based on their comments."
PERFORMANCE BY INDUSTRY
In November, 12 of the 18 manufacturing industries reported growth. The industries — listed in order — are: Apparel, Leather & Allied Products; Printing & Related Support Activities; Petroleum & Coal Products; Miscellaneous Manufacturing; Electrical Equipment, Appliances & Components; Transportation Equipment; Chemical Products; Computer & Electronic Products; Food, Beverage & Tobacco Products; Paper Products; Fabricated Metal Products; and Machinery. The five industries reporting contraction in November are: Wood Products; Furniture & Related Products; Nonmetallic Mineral Products; Primary Metals; and Plastics & Rubber Products.
WHAT RESPONDENTS ARE SAYING ...
* "Becoming concerned about the value of the U.S. dollar." (Apparel, Leather & Allied Products)
* "Low value of the dollar driving commodity costs higher." (Food, Beverage & Tobacco Products)
* "Demand from automotive manufacturers remains strong and building." (Fabricated Metal Products)
* "Capital construction seems to be picking up, and we are seeing more jobs that are bid out." (Electrical Equipment, Appliances & Components)
* "Steady increase in business." (Primary Metals)
 COMMODITIES REPORTED UP/DOWN IN PRICE and IN SHORT SUPPLY
Commodities Up in Price
Aluminum (5); Copper (6); Copper Based Products (5); Natural Gas (2); Oil; and Steel (5).
Commodities Down in Price
No commodities are reported down in price.
Commodities in Short Supply
Electronic Components is the only commodity reported in short supply.
Note: The number of consecutive months the commodity is listed is indicated after each item.
PMI
Manufacturing growth decelerated in November as the PMI registered 53.6 percent, a decrease of 2.1 percentage points when compared to October's reading of 55.7 percent. This continues the recovery in the sector, but at a slower rate of growth. A reading above 50 percent indicates that the manufacturing economy is generally expanding; below 50 percent indicates that it is generally contracting.
A PMI in excess of 41.2 percent, over a period of time, generally indicates an expansion of the overall economy. Therefore, the PMI indicates growth for the seventh consecutive month in the overall economy, as well as expansion in the manufacturing sector for the fourth consecutive month. Ore stated, "The past relationship between the PMI and the overall economy indicates that the average PMI for January through November (45.4 percent) corresponds to a 1.3 percent increase in real gross domestic product (GDP). However, if the PMI for November (53.6 percent) is annualized, it corresponds to a 3.9 percent increase in real GDP annually."
THE LAST 12 MONTHS
COMMODITIES REPORTED UP/DOWN IN PRICE and IN SHORT SUPPLY
Commodities Up in Price
Aluminum (5); Copper (6); Copper Based Products (5); Natural Gas (2); Oil; and Steel (5).
Commodities Down in Price
No commodities are reported down in price.
Commodities in Short Supply
Electronic Components is the only commodity reported in short supply.
Note: The number of consecutive months the commodity is listed is indicated after each item.
PMI
Manufacturing growth decelerated in November as the PMI registered 53.6 percent, a decrease of 2.1 percentage points when compared to October's reading of 55.7 percent. This continues the recovery in the sector, but at a slower rate of growth. A reading above 50 percent indicates that the manufacturing economy is generally expanding; below 50 percent indicates that it is generally contracting.
A PMI in excess of 41.2 percent, over a period of time, generally indicates an expansion of the overall economy. Therefore, the PMI indicates growth for the seventh consecutive month in the overall economy, as well as expansion in the manufacturing sector for the fourth consecutive month. Ore stated, "The past relationship between the PMI and the overall economy indicates that the average PMI for January through November (45.4 percent) corresponds to a 1.3 percent increase in real gross domestic product (GDP). However, if the PMI for November (53.6 percent) is annualized, it corresponds to a 3.9 percent increase in real GDP annually."
THE LAST 12 MONTHS

COMMODITIES REPORTED UP/DOWN IN PRICE and IN SHORT SUPPLY
Commodities Up in Price
Aluminum (5); Copper (6); Copper Based Products (5); Natural Gas (2); Oil; and Steel (5).
Commodities Down in Price
No commodities are reported down in price.
Commodities in Short Supply
Electronic Components is the only commodity reported in short supply.
Note: The number of consecutive months the commodity is listed is indicated after each item.
PMI
Manufacturing growth decelerated in November as the PMI registered 53.6 percent, a decrease of 2.1 percentage points when compared to October's reading of 55.7 percent. This continues the recovery in the sector, but at a slower rate of growth. A reading above 50 percent indicates that the manufacturing economy is generally expanding; below 50 percent indicates that it is generally contracting.
A PMI in excess of 41.2 percent, over a period of time, generally indicates an expansion of the overall economy. Therefore, the PMI indicates growth for the seventh consecutive month in the overall economy, as well as expansion in the manufacturing sector for the fourth consecutive month. Ore stated, "The past relationship between the PMI and the overall economy indicates that the average PMI for January through November (45.4 percent) corresponds to a 1.3 percent increase in real gross domestic product (GDP). However, if the PMI for November (53.6 percent) is annualized, it corresponds to a 3.9 percent increase in real GDP annually."
THE LAST 12 MONTHS
Pending home sales - 10:00
Full report here
Pending home sales have risen for nine months in a row, a first for the series of the index since its inception in 2001, according to the National Association of Realtors®.
The Pending Home Sales Index,* a forward-looking indicator based on contracts signed in October, increased 3.7 percent to 114.1 from 110.0 in September, and is 31.8 percent above October 2008 when it was 86.6. The rise from a year ago is the biggest annual increase ever recorded for the index, which is at the highest level since March 2006 when it was 115.2.
Lawrence Yun, NAR chief economist, said home sales are experiencing a pendulum swing. “Keep in mind that housing had been underperforming over most of the past year. Based on the demographics of our growing population, existing-home sales should be in the range of 5.5 million to 6.0 million annually, but we were well below the 5-million mark before the home buyer tax credit stimulus,” he said. “This means the tax credit is helping unleash a pent-up demand from a large pool of financially qualified renters, much more than borrowing sales from the future.
The PHSI in the Northeast surged 19.9 percent to 100.2 in October and is 44.2 percent above a year ago. In the Midwest the index rose 11.6 percent to 109.6 and is 36.6 percent higher than October 2008. Pending home sales in the South increased 5.4 percent to an index of 115.4, which is 31.6 percent above a year ago. In the West the index fell 11.2 percent to 127.7 but is 21.9 percent above October 2008.
Yun cautioned that home sales could dip in the months ahead. “The expanded tax credit has only been available for the past three weeks, but the time between when buyers start looking at homes until they close on a sale can take anywhere from three to five months. Given the lag time, we could see a temporary decline in closed existing-home sales from December until early spring when we get another surge, but the weak job market remains a major concern and could slow the recovery process.
“Still, as inventories continue to decline and balance is gradually restored between buyers and sellers, we should reach self-sustaining housing conditions and firming home prices in most areas around the middle of 2010. That would mean broad wealth stabilization for the vast number of middle-class families,” Yun said.
The National Association of Realtors®, “The Voice for Real Estate,” is America’s largest trade association, representing 1.2 million members involved in all aspects of the residential and commercial real estate industries.
Construction spending - 10:00
Full report here
OCTOBER 2009 CONSTRUCTION AT $910.8 BILLION ANNUAL RATE
The U.S. Census Bureau of the Department of Commerce announced today that construction spending during October 2009 was estimated at a seasonally adjusted annual rate of $910.8 billion, nearly the same as (±1.6%)* the revised September estimate of $910.4 billion. The October figure is 14.4 percent (±1.6%) below the October 2008 estimate of $1,064.1 billion. During the first 10 months of this year, construction spending amounted to $794.0 billion, 12.6 percent (±1.1%) below the $908.9 billion for the same period in 2008.
PRIVATE CONSTRUCTION
Spending on private construction was at a seasonally adjusted annual rate of $589.0 billion, 0.3 percent (±1.1%)* above the revised September estimate of $587.2 illion. Residential construction was at a seasonally adjusted annual rate of $250.3 billion in October, 4.4 percent (±1.3%) above the revised September estimate of $239.7 billion. Nonresidential construction was at a seasonally adjusted annual rate of $338.6 billion in October, 2.5 percent (±1.1%) below the revised September estimate of $347.5 billion.
PUBLIC CONSTRUCTION
In October, the estimated seasonally adjusted annual rate of public construction spending was $321.8 billion, 0.4 percent (±2.4%)* below the revised September estimate of $323.2 billion. Educational construction was at a seasonally adjusted
annual rate of $85.7 billion, 1.1 percent (±2.9%)* above the revised September estimate of $84.7 billion. Highway construction was at a seasonally adjusted annual rate of $87.2 billion, 0.3 percent (±6.6%)* below the revised September estimate of $87.4 billion.
Pre-market - Tuesday - December 1
Futures up on a falling dollar
DJIA INDEX 10,400.00 66.00
S&P 500 1,102.80 8.00
NASDAQ 100 1,781.00 13.50
Today's economic reports:
Motor Vehicle Sales
ICSC-Goldman Store Sales 7:45 AM ET
Redbook 8:55 AM ET
ISM Mfg Index 10:00 AM ET
Construction Spending 10:00 AM ET
Pending Home Sales Index 10:00 AM ET
4-Week Bill Auction 11:30 AM ET
Today's earnings reports:
Before open:
BECN Beacon Roofing Supply Inc. Services Building Materials Wholesale
GIGM GigaMedia Ltd. Technology Internet Software & Services
ISLE Isle of Capri Casinos Inc. Services Resorts & Casinos
LDR Landauer Inc. Services Research Services
NPD China Nepstar Chain Drugstore Ltd. Services Drug Stores
SPLS Staples, Inc. Services Specialty Retail, Other
THO Thor Industries Inc. Consumer Goods Recreational Vehicles
UTI Universal Technical Institute Inc. Services Education & Training Services
After close:
CFI Culp Inc. Industrial Goods Textile Industrial
CPRT Copart Inc. Services Auto Dealerships
GAME Shanda Games Limited Services Entertainment - Diversified
LTXC LTX-Credence Corporation Technology Semiconductor Equipment & Materials
SNDA Shanda Interactive Entertainment Ltd. Technology Internet Software & Services
Market wrap - a day late -
Dow 10,345 35 0.34%
Nasdaq 2,145 6 0.29%
S&P 500 1,096 4 0.38%
GlobalDow1,961 +21 +1.07%
Gold 1,183 8 0.64%
Oil 78.05 0.83 1.07%
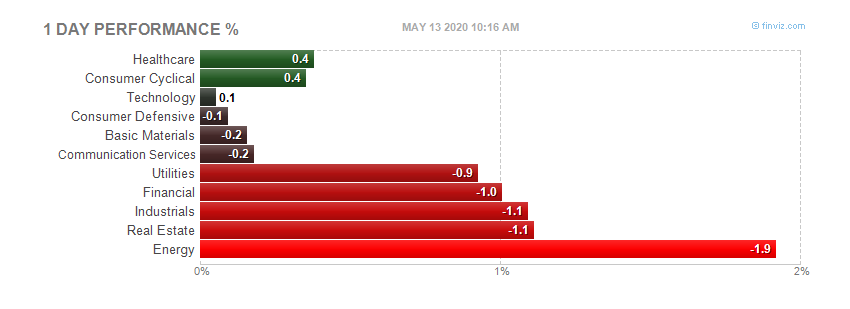
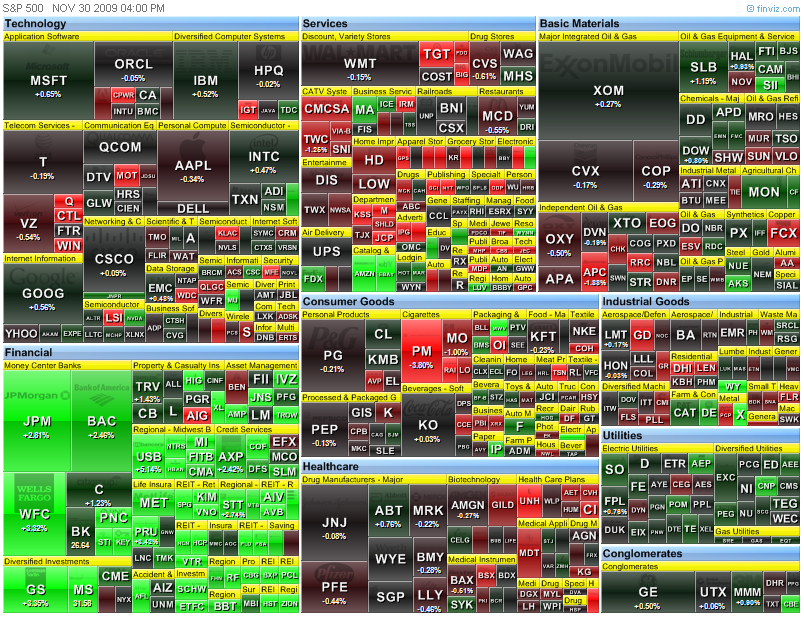
Monday, November 30, 2009
Chicago PMI - 9:45
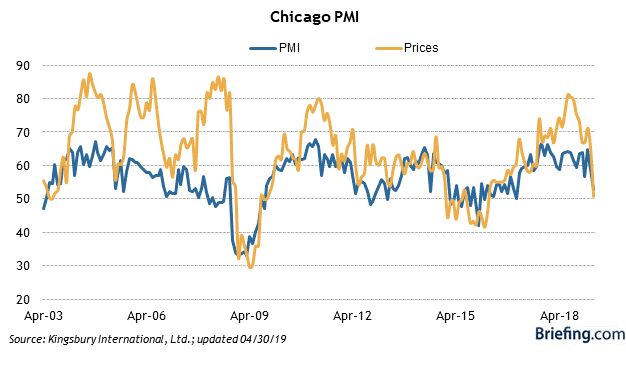 Highlights
* The Chicago PMI index jumped over the 50 point threshold for the first time since September 2008 as the index grew to 54.2 in October. The consensus expected the index to increase slightly to 49.0 from 46.1 and remain in the contraction phase.
* The production index increased to 63.9 from 47.2 and orders rose to 61.4 from 46.3.
* Inventories continued to contract and have gotten worse over the last month as the index declined to 32.2 from 38.9.
* The only other sector that continued to contract was employment, which declined to 38.3 from 38.8.
* Other components of the index showed the manufacturing sector strengthening including order backlogs, which increased to 41.9 from 36.7 and prices paid, which declined to 48.6 from 51.3.
Key Factors
* The entire index showed signs of a sustainable expansionary cycle.
* Unlike last month's national index, where production grew on the anticipation of new orders that never came in, production and new orders posted strong growth and entered an expansionary phase in the Chicago region.
Big Picture
* The Chicago PMI has little overall economic value, and is only watched by the financial markets because it is usually released one day in advance of the similar national ISM manufacturing survey. A significant move in this regional survey will therefore sometimes be seen as having predictive value for the ISM index.
Highlights
* The Chicago PMI index jumped over the 50 point threshold for the first time since September 2008 as the index grew to 54.2 in October. The consensus expected the index to increase slightly to 49.0 from 46.1 and remain in the contraction phase.
* The production index increased to 63.9 from 47.2 and orders rose to 61.4 from 46.3.
* Inventories continued to contract and have gotten worse over the last month as the index declined to 32.2 from 38.9.
* The only other sector that continued to contract was employment, which declined to 38.3 from 38.8.
* Other components of the index showed the manufacturing sector strengthening including order backlogs, which increased to 41.9 from 36.7 and prices paid, which declined to 48.6 from 51.3.
Key Factors
* The entire index showed signs of a sustainable expansionary cycle.
* Unlike last month's national index, where production grew on the anticipation of new orders that never came in, production and new orders posted strong growth and entered an expansionary phase in the Chicago region.
Big Picture
* The Chicago PMI has little overall economic value, and is only watched by the financial markets because it is usually released one day in advance of the similar national ISM manufacturing survey. A significant move in this regional survey will therefore sometimes be seen as having predictive value for the ISM index.
Pre-market - Monday, November 30, 2009
Futures down slightly on the Dubai worries.
DJIA INDEX 10,280.00 -12.00
S&P 500 1,087.70 -1.80
NASDAQ 100 1,757.25 -2.00
Today's economic reports:
Chicago PMI9:45 AM ET
4-Week Bill Announcement 11:00 AM ET
3-Month Bill Auction 11:30 AM ET
6-Month Bill Auction 11:30 AM ET
Farm Prices 3:00 PM ET
Today's earnings reports.
Before open:
NRGY Inergy, L.P. Services Specialty Retail, Other
PATR Patriot Transportation Holding Inc. Services Trucking
TLVT Telvent Git S.A. Technology Computer Based Systems
UNFY Unify Corp. Technology Business Software & Services
After close:
GES Guess? Inc. Services Apparel Stores
LTON Linktone Ltd. Technology Wireless Communications
OVTI OmniVision Technologies Inc. Technology Semiconductor - Integrated Circuits
SNS Steak n Shake Co. Services Restaurants
SOFOD Sonic Foundry Inc. Technology Application Software
ZOLT Zoltek Companies Inc. Industrial Goods Industrial Electrical Equipment
Friday, November 27, 2009
Market wrap - 1:15
Not as bad as it could have been, but are we out of the woods now? Let's see what happens Monday when everyone is back, and the exposure to Dubai has been digested.
Dow 10,310 -154 -1.48%
Nasdaq 2,138 -38 -1.73%
S&P 500 1,091 -19 -1.72%
Gold 1,176 -13 -1.10%
Oil 75.76 -2.19 -2.81%

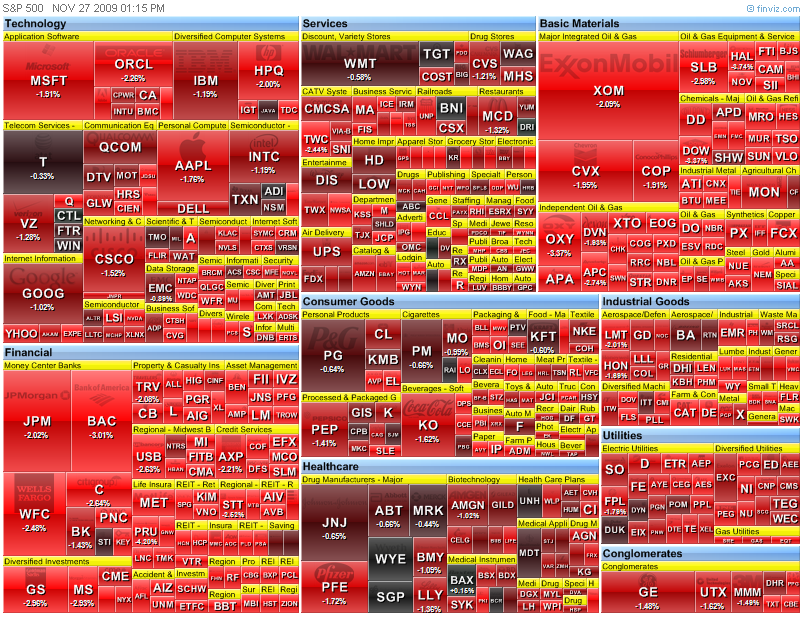
Pre-market - 8:15
Futures down big, but off the lows overnight on the news out of Dubai and their debt problem.
DJIA INDEX 10,222.00 -220.00
S&P 500 1,079.10 -29.80
NASDAQ 100 1,745.50 -48.75
Today's economic calendar:
None - Market closes at 1:00
Today's earnings reports:
Before open:
FRO Frontline Ltd. Services Shipping
SFL Ship Finance International Limited Services Shipping
After close = none
Wednesday, November 25, 2009
Jobless claims - 8:30
Full report here
UNEMPLOYMENT INSURANCE WEEKLY CLAIMS REPORT
SEASONALLY ADJUSTED DATA
In the week ending Nov. 21, the advance figure for seasonally adjusted initial claims was 466,000, a decrease of 35,000 from the previous week's revised figure of 501,000. The 4-week moving average was 496,500, a decrease of 16,500 from the previous week's revised average of 513,000.
The advance seasonally adjusted insured unemployment rate was 4.1 percent for the week ending Nov. 14, a decrease of 0.2 percentage point from the prior week's unrevised rate of 4.3 percent.
The advance number for seasonally adjusted insured unemployment during the week ending Nov. 14 was 5,423,000, a decrease of 190,000 from the preceding week's revised level of 5,613,000. The 4-week moving average was 5,613,750, a decrease of 98,500 from the preceding week's revised average of 5,712,250.
The fiscal year-to-date average for seasonally adjusted insured unemployment for all programs is 5.866 million.
UNADJUSTED DATA
The advance number of actual initial claims under state programs, unadjusted, totaled 543,926 in the week ending Nov. 21, an increase of 68,080 from the previous week. There were 609,138 initial claims in the comparable week in 2008.
The advance unadjusted insured unemployment rate was 3.8 percent during the week ending Nov. 14, an increase of 0.1 percentage point from the prior week. The advance unadjusted number for persons claiming UI benefits in state programs totaled 5,070,712, an increase of 187,642 from the preceding week. A year earlier, the rate was 2.8 percent and the volume was 3,782,040.
Extended benefits were available in Alabama, Alaska, Arizona, California, Colorado, Connecticut, Delaware, the District of Columbia, Florida, Georgia, Idaho, Illinois, Indiana, Kansas, Kentucky, Maine, Massachusetts, Michigan, Minnesota, Missouri, Nevada, New Hampshire, New Jersey, New Mexico, New York, North Carolina, Ohio, Oregon, Pennsylvania, Puerto Rico, Rhode Island, South Carolina, Tennessee, Texas, Vermont, Virginia, Washington, West Virginia, and Wisconsin during the week ending Nov. 7.
Initial claims for UI benefits by former Federal civilian employees totaled 2,346 in the week ending Nov. 14, an increase of 45 from the prior week. There were 2,026 initial claims by newly discharged veterans, a decrease of 408 from the preceding week.
There were 22,941 former Federal civilian employees claiming UI benefits for the week ending Nov. 7, a decrease of 1,962 from the previous week. Newly discharged veterans claiming benefits totaled 34,598, a decrease of 301 from the prior week.
States reported 3,639,036 persons claiming EUC (Emergency Unemployment Compensation) benefits for the week ending Nov. 7, an increase of 16,370 from the prior week. There were 766,565 claimants in the comparable week in 2008. EUC weekly claims include both first and second tier activity.
The highest insured unemployment rates in the week ending Nov. 7 were in Puerto Rico (6.2 percent), Oregon (5.5), Alaska (5.1), Nevada (5.1), Pennsylvania (4.9), Wisconsin (4.9), Arkansas (4.7), California (4.7), Michigan (4.6), North Carolina (4.6), and Washington (4.6).
The largest increases in initial claims for the week ending Nov. 14 were in Florida (+1,313), Indiana (+607), Hawaii (+278), and North Dakota (+81), while the largest decreases were in California (-7,987), Texas (-4,710), Pennsylvania (-4,321), Wisconsin (-2,716), and Ohio (-2,486).
More at link with formatted tables
Pre-market - late - 9:25
Futures higher after a good job number.
DJIA INDEX 10,437.00 32.00
S&P 500 1,106.90 3.80
NASDAQ 100 1,793.50
Today's economic calendar:
MBA Purchase Applications 7:00 AM ET
Durable Goods Orders 8:30 AM ET
Personal Income and Outlays 8:30 AM ET
Jobless Claims 8:30 AM ET
Consumer Sentiment 9:55 AM ET
New Home Sales 10:00 AM ET
EIA Petroleum Status Report 10:30 AM ET
3-Month Bill Announcement 11:00 AM ET
6-Month Bill Announcement 11:00 AM ET
EIA Natural Gas Report 12:00 PM ET
7-Yr Note Auction 1:00 PM ET
Today's earnings reports:
Before open:
CONN Conns Inc. Services Electronics Stores
DE Deere & Co. Industrial Goods Farm & Construction Machinery
JRJC China Finance Online Co. Ltd. Technology Internet Information Providers
TIF Tiffany & Co. Services Jewelry Stores
After close:
APWR A-Power Energy Generation Systems, Ltd. Utilities Electric Utilities
Tuesday, November 24, 2009
GDP - 8:30
Full report here
Real gross domestic product -- the output of goods and services produced by labor and property located in the United States -- increased at an annual rate of 2.8 percent in the third quarter of 2009, (that is, from the second quarter to the third quarter), according to the "second" estimate released by the Bureau of Economic Analysis. In the second quarter, real GDP decreased 0.7 percent.
The GDP estimate released today is based on more complete source data than were available for the "advance" estimate issued last month. In the advance estimate, the increase in real GDP was 3.5 percent (see "Revisions" on page 3).
The increase in real GDP in the third quarter primarily reflected positive contributions from personal consumption expenditures (PCE), exports, private inventory investment, federal government spending, and residential fixed investment that were partly offset by a negative contribution from nonresidential fixed investment. Imports, which are a subtraction in the calculation of GDP, increased.
The upturn in real GDP in the third quarter primarily reflected upturns in PCE, in private inventory investment, in exports, and in residential fixed investment and a smaller decrease in nonresidential fixed investment that were partly offset by an upturn in imports, a downturn in state and local government spending, and a deceleration in federal government spending.
Pre-market - Tuesday, November 24, 2009
Futures up a tad before GDP report.
DJIA INDEX 10,437.00 15.00
S&P 500 1,106.70 2.90
NASDAQ 100 1,792.75 1.50
Today's economic reports:
ICSC-Goldman Store Sales 7:45 AM ET
GDP 8:30 AM ET
Corporate Profits 8:30 AM ET
Redbook 8:55 AM ET
S&P Case-Shiller HP I9:00 AM ET
Consumer Confidence 10:00 AM ET
State Street Investor Confidence Index 10:00 AM ET
4-Week Bill Auction 11:30 AM ET
5-Yr Note Auction 1:00 PM ET
FOMC Minutes 2:00 PM ET
Today's earnings reports:
Before open:
AEO American Eagle Outfitters, Inc. Services Apparel Stores
AHCI Allied Healthcare International Inc. Healthcare Home Health Care
AMWD American Woodmark Corp. Industrial Goods Lumber, Wood Production
AVNR Avanir Pharmaceuticals Healthcare Drug Manufacturers - Other
BGP Borders Group, Inc. Services Specialty Retail, Other
BKS Barnes & Noble, Inc. Services Specialty Retail, Other
BWS Brown Shoe Co. Inc. Consumer Goods Textile - Apparel Footwear & Accessories
CBRL Cracker Barrel Old Country Store, Inc. Services Restaurants
DAKT Daktronics Inc. Industrial Goods Industrial Electrical Equipment
DHT DHT Maritime, Inc. Services Shipping
DLIA dELiA*s, Inc. Services Catalog & Mail Order Houses
DLTR Dollar Tree Inc. Services Discount, Variety Stores
DSW DSW Inc. Services Apparel Stores
EV Eaton Vance Corp. Financial Asset Management
FRED Fred's Inc. Services Discount, Variety Stores
GCO Genesco Inc. Services Apparel Stores
GIGM GigaMedia Ltd. Technology Internet Software & Services
HI Hillenbrand, Inc. Services Personal Services
HNZ HJ Heinz Co. Consumer Goods Food - Major Diversified
HRL Hormel Foods Corp. Consumer Goods Meat Products
MDT Medtronic, Inc. Healthcare Medical Appliances & Equipment
NTZ Natuzzi SpA Consumer Goods Home Furnishings & Fixtures
SIG Signet Jewelers Limited Services Jewelry Stores
VIP Vimpel-Communications Technology Wireless Communications
WH WSP Holdings Ltd. Basic Materials Oil & Gas Equipment & Services
WMG Warner Music Group Corp. Services Movie Production, Theaters
ZLC Zale Corporation Services Jewelry Stores
After close:
ASYS Amtech Systems Inc. Technology Semiconductor Equipment & Materials
BCSI Blue Coat Systems Inc. Technology Business Software & Services
CWTR Coldwater Creek Inc. Services Specialty Retail, Other
JCG J. Crew Group, Inc. Services Apparel Stores
JRJC China Finance Online Co. Ltd. Technology Internet Information Providers
NZ Netezza Corporation Technology Diversified Computer Systems
SNS Steak n Shake Co. Services Restaurants
TIVO TiVo Inc. Services CATV Systems
Monday, November 23, 2009
Market wrap - 4:10
Large gap up, only to slowly go a bit lower as the dollar rose throughout the day.
Dow 10,451 133 1.29%
Nasdaq 2,176 30 1.40%
S&P 500 1,106 15 1.36%
Gold 1,165 +18 +1.57%
Oil 77.69 0.09 0.12%

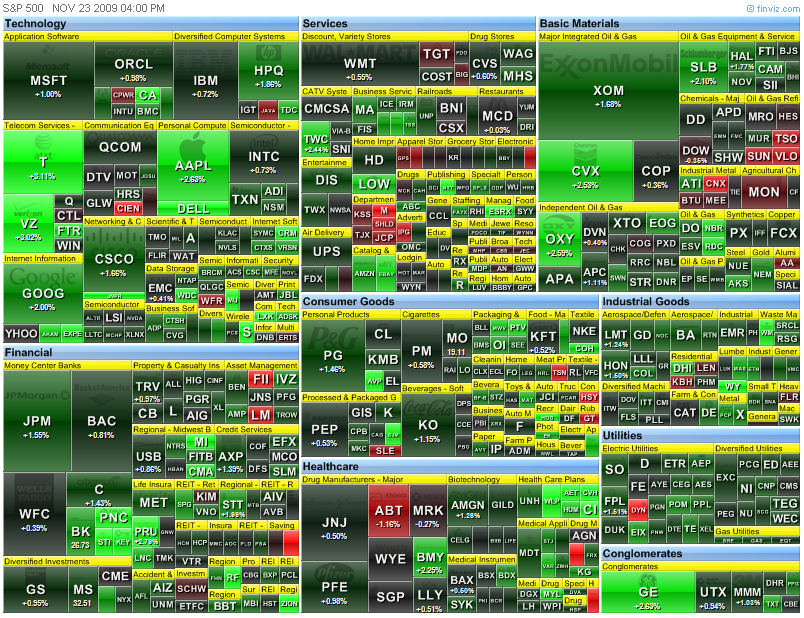
Existing home sales - 10:00
Full report here
Washington, November 23, 2009
Driven by the first-time buyer tax credit, existing-home sales showed another big gain in October with a strong uptrend established over the past seven months, while inventories continue to decline, according to the National Association of Realtors®.
Existing-home sales – including single-family, townhomes, condominiums and co-ops – surged 10.1 percent to a seasonally adjusted annual rate1 of 6.10 million units in October from a downwardly revised pace of 5.54 million in September, and are 23.5 percent above the 4.94 million-unit level in October 2008. Sales activity is at the highest pace since February 2007 when it hit 6.55 million.
Lawrence Yun, NAR chief economist, was surprised at the size of the gain. “Many buyers have been rushing to beat the deadline for the first-time buyer tax credit that was scheduled to expire at the end of this month, and similarly robust sales may be occurring in November,” he said. “With such a sale spike, a measurable decline should be anticipated in December and early next year before another surge in spring and early summer.”
Now that the tax credit has been extended and expanded, potential buyers have until April 30 to have a contract in place. “There is still a large pent-up demand that can be tapped before the tax credit expires. Our recent consumer survey further shows that 13 percent of successful first-time buyers had a previous contract that was cancelled or fell through – there likely are many more buyers who were attempting to purchase but simply ran out of time,” Yun said.
Historically low interest rates also are boosting the market. “Mortgage interest rates last month were the third lowest on record dating back to 1971,” Yun noted. According to Freddie Mac, the national average commitment rate for a 30-year, conventional, fixed-rate mortgage fell to 4.95 percent in October from 5.06 percent in September; the rate was 6.20 percent in October 2008. Last week, Freddie Mac reporter the 30-year rate dropped to 4.83 percent.
NAR President Vicki Cox Golder, owner of Vicki L. Cox & Associates in Tucson, Ariz., said strong demand by first-time buyers is creating some unusual conditions. “In parts of the country, especially in Southwestern states but also in Florida and suburban Washington, D.C., we’ve been getting many reports of multiple bids in the lower price ranges with foreclosed properties getting absorbed quickly,” she said.
“In fact, low-end inventory has become very tight in many areas and in some cases buyers are becoming more aggressive. In this kind of environment it’s important to work with a Realtor® who can walk you through the process and help you negotiate a satisfactory deal,” Golder said.
Total housing inventory at the end of October fell 3.7 percent to 3.57 million existing homes available for sale, which represents a 7.0-month supply2 at the current sales pace, down from an 8.0-month supply in September. Unsold inventory totals are 14.9 percent below a year ago.
“The supply of homes on the market is now at the lowest level in over two-and-a half years – we’re getting closer to a general balance between buyers and sellers,” Yun said. The last time the relative housing inventory was this low was in February 2007 when it also was at a 7.0-month supply.
The national median existing-home price3 for all housing types was $173,100 in October, down 7.1 percent from October 2008. Distressed properties, which accounted for 30 percent of sales in October, continue to downwardly distort the median price because they usually sell at a discount relative to traditional homes in the same area.
“In the second half of 2010, if home values show consistent stabilization or even a modest increase, then home sales could remain at normal healthy levels because consumers would no longer be worried about a price overcorrection,” Yun said.
He added that low home prices also are contributing to extremely favorable affordability conditions. “With the abnormal drop in home prices over the past few years, the price-to-income ratio has fallen below the historic trend line,” Yun said. “This is adding to the buying power of the typical family, with affordability conditions this year at the highest on record dating back to 1970, but prices are beginning to flatten and are poised to rise next year.”
Single-family home sales rose 9.7 percent to a seasonally adjusted annual rate of 5.33 million in October from a pace of 4.86 million in September, and are 21.4 percent above the 4.39 million-unit pace in October 2008. The median existing single-family home price was $173,100 in October, down 6.8 percent from a year ago.
Existing condominium and co-op sales surged 13.2 percent to a seasonally adjusted annual rate of 770,000 units in October from 680,000 in September, and are 40.8 percent above the 547,000-unit level a year ago. The median existing condo price4 was $172,900 in October, which is 10.4 percent below October 2008.
Regionally, existing-home sales in the Northeast rose 11.6 percent to an annual level of 1.06 million in October, and are 27.7 percent higher than October 2008. The median price in the Northeast was $235,400, down 2.6 percent from a year ago.
Existing-home sales in the Midwest surged 14.4 percent in October to a pace of 1.43 million and are 28.8 percent above a year ago. The median price in the Midwest was $146,600, a gain of 1.1 percent from October 2008.
In the South, existing-home sales rose 12.7 percent to an annual level of 2.30 million in October and are 25.7 percent higher than October 2008. The median price in the South was $151,100, down 6.3 percent from a year ago.
Existing-home sales in the West increased 1.6 percent to an annual rate of 1.31 million in October and are 12.0 percent above a year ago. The median price in the West was $220,200, which is 14.7 percent below October 2008.
The National Association of Realtors®, “The Voice for Real Estate,” is America’s largest trade association, representing 1.2 million members involved in all aspects of the residential and commercial real estate industries.
Pre-market - Monday, November 23, 2009
Futures up big on a declining dollar.
DJIA INDEX 10,395.00 92.00
S&P 500 1,100.70 10.60
NASDAQ 100 1,779.25 15.75
Today's economic calendar:
Existing Home Sales 10:00 AM ET
4-Week Bill Announcement 11:00 AM ET
3-Month Bill Auction 11:30 AM ET
6-Month Bill Auction 11:30 AM ET
2-Yr Note Auction 1:00 PM ET
Today's earnings reports.
Before open:
BJS BJ Services Company Basic Materials Oil & Gas Equipment & Services
CDCS CDC Software Corporation Technology Application Software
CPB Campbell Soup Co. Consumer Goods Processed & Packaged Goods
JOBS 51job Inc. Services Staffing & Outsourcing Services
LDK LDK Solar Co.Ltd. Technology Diversified Electronics
NED Noah Education Holdings, Ltd. Services Publishing - Books
TECD Tech Data Corp. Services Computers Wholesale
TSN Tyson Foods Inc. Consumer Goods Meat Products
VAL Valspar Corp. Industrial Goods General Building Materials
After close:
ADI Analog Devices Inc. Technology Semiconductor - Broad Line
ATW Atwood Oceanics Inc. Basic Materials Oil & Gas Drilling & Exploration
BRCD Brocade Communications Systems, Inc. Technology Data Storage Devices
CNTF China Techfaith Wireless Communication Technology Ltd. Technology Diversified Communication Services
CTRN Citi Trends Services Apparel Stores
DY Dycom Industries Inc. Industrial Goods Heavy Construction
FMCN Focus Media Holding Ltd. Services Advertising Agencies
GLAD Gladstone Capital Corporation Financial Diversified Investments
HAYN Haynes International Inc. Basic Materials Steel & Iron
HPQ Hewlett-Packard Company Technology Diversified Computer Systems
NBG National Bank of Greece SA Financial Foreign Money Center Banks
NCTY The9 Limited Services Gaming Activities
NUAN Nuance Communications, Inc. Technology Application Software
SBLK Star Bulk Carriers Corp. Services Shipping
VIMC Vimicro International Corp. Technology Semiconductor - Specialized
Subscribe to:
Posts (Atom)
