 Before market opens in BOLD
Tuesday, July 7, 2009
Pre-market - July 7, 2009
Futures up slightly this morning:
DJIA INDEX 8,291.00 14.00
S&P 500 897.30 1.80
NASDAQ 100 1,445.00 4.00
Gold 924 -7 -0.77%
Oil 64.79 0.70 1.09%
Today's economic calendar:
ICSC-Goldman Store Sales 7:45 AM ET
Redbook 8:55 AM ET
4-Week Bill Auction 11:30 AM ET
3-Yr Note Auction 1:00 PM ET
Treasury STRIPS 3:00 PM ET
Today's earnings reports:
 Before market opens in BOLD
Before market opens in BOLD
Monday, July 6, 2009
Market wrap - 4:15PM
Another boring day in the market. Nothing much except the all to familiar ram job at 3:30.
Dow 8,324.87 +44.13 (0.53%)
S&P 500 898.72 +2.30 (0.26%)
Nasdaq 1,787.40 -9.12 (-0.51%)
Gold 924 -7 -0.72%
Oil 64.16 -1.58 -2.40%
Today by sector: Today's heatmap:
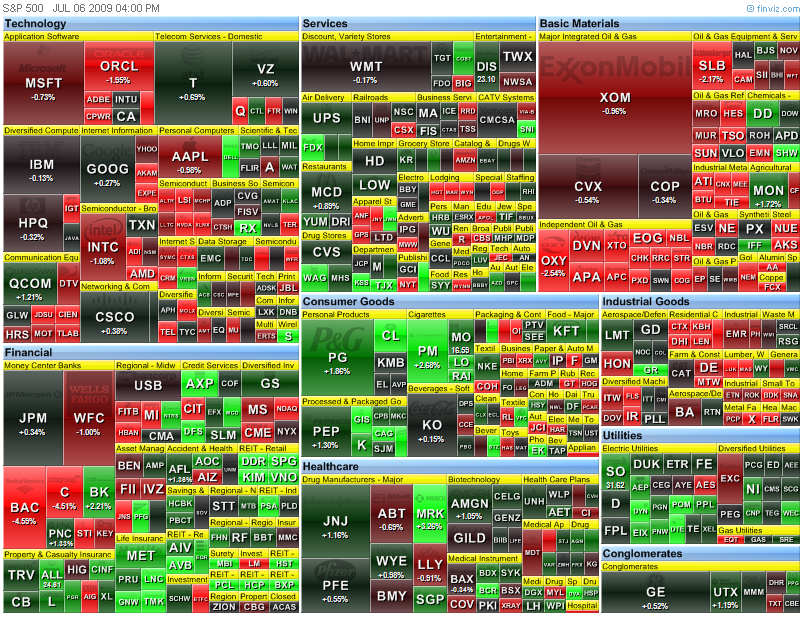
That heatmap doesn't tell the whole story. The REITs were good all day. Why I have no idea. Who would buy this crap is beyond me.
Today's heatmap:
That heatmap doesn't tell the whole story. The REITs were good all day. Why I have no idea. Who would buy this crap is beyond me.
Pre-market - Monday - July 6, 2009
Futures are down this morning:
DJIA INDEX 8,165.00 -76.00
S&P 500 884.80 -8.50
NASDAQ 100 1,434.75 -10.50
Gold 931 -10 -1.09%
Oil 63.56 -2.06 -3.14%
Today's economic calendar:
ISM Non-Mfg Index 10:00 AM ET
4-Week Bill Announcement 11:00 AM ET
3-Month Bill Auction 11:30 AM ET
6-Month Bill Auction 11:30 AM ET
10-Yr TIPS Auction 1:00 PM ET
Today's earnings calendar:
CMED China Medical Technologies Inc. Healthcare
VIMC Vimicro International Corp. Technology
CMED is before the market opens
Thursday, July 2, 2009
Market wrap - 5:00PM
The market hours were extended today by 15 minutes due to some electronic system problems at the NYSE. Closed at 4:15.
The job numbers didn't sit too well with traders today as we saw a pretty good sell off.
Dow 8,280.74 -223.32 (-2.63%)
S&P 500 896.42 -26.91 (-2.91%)
Nasdaq 1,796.52 -49.20 (-2.67%)
Gold 931 -10 -1.09%
Oil 66.31 -2.58 -3.75%
Today by sector:
 Today's heatmap:
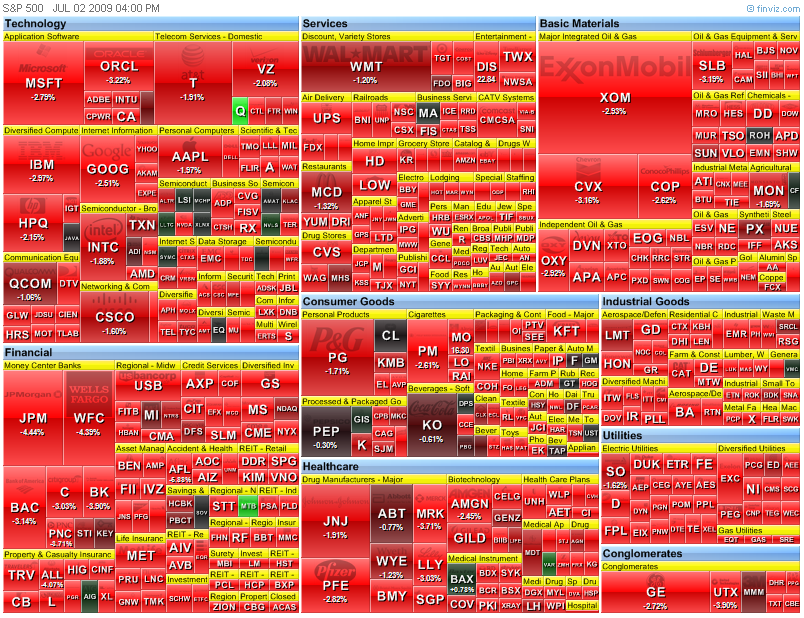
Lookie what we have here? I'm not a technician, but that looks like a pretty nice head and shoulders. We have yet to find out of course. Earnings season is right around the corner, and next week we have some bond auctions that might be interesting. The economic news is not very good with a few exceptions. Less bad, not as bad as expected, contracting slower, and green shoots have been the buzzwords. The chart is suggesting a bearish tone. I think we may want to watch that chart. Green shoots might turn into weeds.
Today's heatmap:
Lookie what we have here?
 I'm not a technician, but that looks like a pretty nice head and shoulders. We have yet to find out of course. Earnings season is right around the corner, and next week we have some bond auctions that might be interesting. The economic news is not very good with a few exceptions. Less bad, not as bad as expected, contracting slower, and green shoots have been the buzzwords. The chart is suggesting a bearish tone. I think we may want to watch that chart. Green shoots might turn into weeds.
Big Pay Packages Return to Wall Street - Update 1:22PM
I'm shocked, shocked I tell you:
Big Pay Packages Return to Wall Street - WSJ
Business is back on Wall Street. If the good times continue to roll, lofty pay packages may be set for a comeback as well.
Based on analysts' earnings forecasts for 2009, Goldman Sachs Group Inc. is on track to pay out as much as $20 billion this year, or about $700,000 per employee. That would be nearly double the firm's $363,000 average last year, and slightly higher than the $661,000 for the average Goldman employee in fiscal 2007, according to analyst estimates reviewed by The Wall Street Journal.
Morgan Stanley, the only other huge U.S. securities firm left as an independent company, will likely pay out $11 billion to $14 billion in compensation and benefits this year, analysts predict. On a per-employee basis, payouts are expected to exceed last year's average of $262,000. Howard Chen, an analyst at Credit Suisse, projects that the company's average pay will come close to the $340,000 paid out by Morgan Stanley in fiscal 2007.
More at link.
California ready to issue IOUs - 11:36AM
California ready to issue IOUs
Full link here
The controller's office is set to begin printing the scrip this afternoon, the first time in 17 years. Some 28,742 IOUs worth $53.3 million will be sent, mostly to residents awaiting tax refunds.
By Eric Bailey
7:03 AM PDT, July 2, 2009
Reporting from Sacramento — With budget negotiators at a loggerheads and California government facing a cash crisis, the state controller's office will start printing IOUs this afternoon for the first time in 17 years.
The presses are set to start at 2 p.m., churning out 28,742 IOUs worth $53.3 million that will be dispatched mostly to residents throughout the state still awaiting their income-tax refunds.
A panel of state finance officials will meet this morning to set the interest rate for banks and other financial institutions that decide to accept the IOUs. Some banks have agreed to honor them, including Bank of America, which will do so until July 10. Other banks have not made a decision.
The move comes little more than a day after Senate Republicans, with the support of Gov. Arnold Schwarzenegger, blocked an 11th-hour attempt by Democratic leaders to push through a slate of bills that would have staved off the IOUs.
With the California economy hobbled, tax receipts waning and the budget deficit continuing to swell, the governor Wednesday declared a fiscal emergency, and ordered state workers to take a third unpaid furlough day each month. He also issued a new list of cuts to schools and public universities to address a deficit that his finance team now says has swelled to $26.3 billion.
Schwarzenegger's latest cuts are designed to pare state spending by an additional $4.9 billion.
Green shoots!
Green shoots!
MANUFACTURERS' SHIPMENTS, INVENTORIES, AND ORDERS - 10:00AM
For May - full report here
Summary
New orders for manufactured goods in May, up three of the last four months, increased $4.1 billion or 1.2 percent to $347.9 billion, the U.S. Census Bureau reported today. This followed a 0.5 percent April increase. Excluding transportation, new orders increased 0.8 percent. Shipments, down ten consecutive months, decreased $3.1 billion or 0.9 percent to $353.3 billion. This was the longest streak of consecutive monthly decreases since the series was first published on a NAICS basis in 1992 and followed a 0.5 percent April decrease. Unfilled orders, down eight consecutive months, decreased $1.8 billion or 0.2 percent to $747.3 billion. This was the longest streak of consecutive monthly decreases since November 2001-July 2002. This followed a 1.1 percent April decrease. The unfilled orders-to-shipments ratio was 6.15, up from 6.04 in April. Inventories, down nine consecutive months, decreased $3.2 billion or 0.6 percent to $513.3 billion. This was the longest streak of consecutive monthly decreases since March 2003-January 2004 and followed a 1.2 percent April decrease. The inventories-to-shipments ratio was 1.45, unchanged from April.
New Orders
New orders for manufactured durable goods in May, up three of the last four months, increased $2.9 billion or 1.8 percent to $163.4 billion, unchanged from the previously published increase. This followed a 1.4 percent April increase.
New orders for manufactured nondurable goods increased $1.2 billion or 0.7 percent to $184.5 billion.
Shipments
Shipments of manufactured durable goods in May, down ten consecutive months, decreased $4.3 billion or 2.5 percent to $168.9 billion, revised from the previously published 2.1 percent decrease. This also was the longest streak of consecutive monthly decreases since the series was first published on a NAICS basis in 1992 and followed a 0.7 percent April decrease.
Shipments of manufactured nondurable goods, up following three consecutive monthly decreases, increased $1.2 billion or 0.7 percent to $184.5 billion. This followed a 0.2 percent April decrease. This increase was due to petroleum and coal products, which increased $2.5 billion or 8.3 percent to $32.3 billion.
Unfilled Orders
Unfilled orders for manufactured durable goods in May, down eight consecutive months, decreased $1.8 billion or 0.2 percent to $747.3 billion, revised from the previously published 0.3 percent decrease. This followed a 1.1 percent April decrease.
Inventories
Inventories of manufactured durable goods in May, down five consecutive months, decreased $3.3 billion or 1.0 percent to $322.1 billion, revised from the previously published 0.8 percent decrease. This followed a 1.2 percent April decrease.
Inventories of manufactured nondurable goods, up following eight consecutive monthly decreases, increased slightly to $191.2 billion. This followed a 1.1 percent April decrease. Petroleum and coal products drove the increase, up $0.7 billion or 3.0 percent to $25.2 billion.
By stage of fabrication, May materials and supplies decreased 1.7 percent in durable goods and increased 0.3 percent in nondurable goods. Work in process decreased 0.2 percent in durable goods and increased 0.2 percent in nondurable goods. Finished goods decreased 1.4 percent in durable goods and 0.3 percent in nondurable goods.
Jobs report - 8:31AM
 Opps! Did the green shoots get mowed down?
Full report here
THE EMPLOYMENT SITUATION: JUNE 2009
Nonfarm payroll employment continued to decline in June (-467,000),
and the unemployment rate was little changed at 9.5 percent, the Bureau of Labor Statistics of the U.S. Department of Labor reported today. Job losses were widespread across the major industry sectors, with
large declines occurring in manufacturing, professional and business
services, and construction.
Unemployment (Household Survey Data)
The number of unemployed persons (14.7 million) and the unemployment rate (9.5 percent) were little changed in June. Since the start of the recession in December 2007, the number of unemployed persons has increased by 7.2 million, and the unemployment rate has risen by 4.6 percentage
points.
If you got to the site you need to look at the U-6 number:
June 09 = 16.8 vs May = 15.9
U6 is Total unemployed, plus all marginally attached workers, plus total employed part time for economic reasons, as a percent of the civilian labor force plus all marginally attached workers.
Opps! Did the green shoots get mowed down?
Full report here
THE EMPLOYMENT SITUATION: JUNE 2009
Nonfarm payroll employment continued to decline in June (-467,000),
and the unemployment rate was little changed at 9.5 percent, the Bureau of Labor Statistics of the U.S. Department of Labor reported today. Job losses were widespread across the major industry sectors, with
large declines occurring in manufacturing, professional and business
services, and construction.
Unemployment (Household Survey Data)
The number of unemployed persons (14.7 million) and the unemployment rate (9.5 percent) were little changed in June. Since the start of the recession in December 2007, the number of unemployed persons has increased by 7.2 million, and the unemployment rate has risen by 4.6 percentage
points.
If you got to the site you need to look at the U-6 number:
June 09 = 16.8 vs May = 15.9
U6 is Total unemployed, plus all marginally attached workers, plus total employed part time for economic reasons, as a percent of the civilian labor force plus all marginally attached workers.
Pre-market - July 2, 2009
Futures down before the jobs report:
DJIA INDEX 8,398.00 -50.00
S&P 500 913.20 -6.00
NASDAQ 100 1,469.75 -9.00
Gold 941 14 1.50%
Oil 68.05 -1.41 -2.03%
Today's economic calendar:
ECB Announcement 7:45 AM ET (interest rate unchanged)
Employment Situation 8:30 AM ET
Jobless Claims 8:30 AM ET
30-Yr Bond Announcement 9:00 AM ET
Factory Orders 10:00 AM ET
EIA Natural Gas Report 10:30 AM ET
3-Month Bill Announcement 11:00 AM ET
6-Month Bill Announcement 11:00 AM ET
3-Yr Note Announcement 11:00 AM ET
10-Yr Note Announcement 11:00 AM ET
10-Yr TIPS Announcement 11:00 AM ET
Money Supply 4:30 PM ET
Today's earnings reports:
 After market closes in BOLD
 After market closes in BOLD
Wednesday, July 1, 2009
Construction spending - June - 10:10AM
Full report here
For Release at 10:00 A.M. EDT, Wednesday, July 1, 2009
Michael Davis, Linnet Holland, or John Tremblay CB09-100
(301) 763-1605
MAY 2009 CONSTRUCTION AT $964.0 BILLION ANNUAL RATE
The U.S. Census Bureau of the Department of Commerce announced today that construction spending during May 2009 was estimated at a seasonally adjusted annual rate of $964.0 billion, 0.9 percent (±1.1%)* below the revised April estimate of $972.5 billion. The May figure is 11.6 percent (±1.6%) below the May 2008 estimate of $1,090.7 billion.
During the first 5 months of this year, construction spending amounted to $368.8 billion, 11.7 percent (±1.4%) below the $417.5 billion for the same period in 2008.
PRIVATE CONSTRUCTION
Spending on private construction was at a seasonally adjusted annual rate of $649.2 billion, 1.0 percent (±1.1%)* below the revised April estimate of $655.6 billion. Residential construction was at a seasonally adjusted annual rate of $240.2
billion in May, 3.4 percent (±1.3%) below the revised April estimate of $248.8 billion. Nonresidential construction was at a seasonally adjusted annual rate of $409.0 billion in May, 0.5 percent (±1.1%)* above the revised April estimate of
$406.9 billion.
PUBLIC CONSTRUCTION
In May, the estimated seasonally adjusted annual rate of public construction spending was $314.9 billion, 0.6 percent (±1.9%)* below the revised April estimate of $316.9 billion. Educational construction was at a seasonally adjusted annual
rate of $91.3 billion, 0.5 percent (±2.7%)* above the revised April estimate of $90.8 billion. Highway construction was at a seasonally adjusted annual rate of $78.5 billion, 1.3 percent (±6.6%)* below the revised April estimate of $79.5 billion.
ISM Manufacturing report - 10:10AM
Full report here
June 2009 Manufacturing ISM Report On Business®
PMI at 44.8%
DO NOT CONFUSE THIS NATIONAL REPORT with the various regional purchasing reports released across the country. The national report's information reflects the entire United States, while the regional reports contain primarily regional data from their local vicinities. Also, the information in the regional reports is not used in calculating the results of the national report. The information compiled in this report is for the month of June 2009.
Production Growing
New Orders, Employment and Inventories Contracting
Prices Unchanged
Supplier Deliveries Slower
(Tempe, Arizona) — Economic activity in the manufacturing sector failed to grow in June for the 17th consecutive month, while the overall economy grew for the second consecutive month following seven months of decline, say the nation's supply executives in the latest Manufacturing ISM Report On Business®.
The report was issued today by Norbert J. Ore, CPSM, C.P.M., chair of the Institute for Supply Management™ Manufacturing Business Survey Committee. "Manufacturing continues to contract at a slower rate, but the trends in the indexes are encouraging as seven of 18 industries reported growth in June. Most encouraging is the gain in the Production Index, which is up 12.1 percentage points in the last two months to 52.5 percent. Aggressive inventory reduction continues and indications are that the de-stocking cycle is at or near the end in most industries, as the Customers' Inventories Index remained below 50 percent for the third consecutive month. The Prices Index was unchanged from May, indicating that the supply/demand balance is improving. Overall, a slow recovery for manufacturing is forming based on the current trends in the ISM data."
PERFORMANCE BY INDUSTRY
Seven of the 18 manufacturing industries reported growth in June. These industries — listed in order — are: Petroleum & Coal Products; Printing & Related Support Activities; Wood Products; Nonmetallic Mineral Products; Miscellaneous Manufacturing; Chemical Products; and Primary Metals. The industries reporting contraction in June — listed in order — are: Apparel, Leather & Allied Products; Furniture & Related Products; Machinery; Computer & Electronic Products; Electrical Equipment, Appliances & Components; Plastics & Rubber Products; Textile Mills; Transportation Equipment; Food, Beverage & Tobacco Products; and Fabricated Metal Products.
WHAT RESPONDENTS ARE SAYING ...
* "Customer inventory burn is complete and real demand has reappeared." (Machinery)
* "... a lot of people are requoting old business and using favorable pricing to negotiate with their current suppliers." (Computer & Electronic Products)
* "Banks are reluctant to lend to businesses, and until this changes the economy will continue to be weak." (Fabricated Metal Products)
* "Slow June, but firm large orders in July, August and September." (Food, Beverage & Tobacco Products)
* "Market appears to have bottomed out as aftermarket has picked up slightly over the past month." (Transportation Equipment)
ADP job report - 8:15AM
Not so good it seems:
Full link here
ROSELAND, N.J. – July 1, 2009 – According to today’s ADP National Employment
Report®, private sector employment decreased by 473,000 in June. The ADP National
Employment Report, created by ADP® Employer Services, a division of Automatic Data
Processing, Inc. (ADP), in partnership with Macroeconomic Advisers, LLC, is derived
from actual payroll data and measures the change in total nonfarm private employment
each month.
Nonfarm Private Employment Highlights – June Report:
• Total employment: -473,000
• Small businesses* -177,000
• Medium businesses** -205,000
• Large businesses*** -91,000
• Goods-producing sector: -250,000
• Service-providing sector: -223,000
Addendum:
• Manufacturing industry: -146,000
* Small businesses represent payrolls with 1-49 employees
** Medium businesses represent payrolls with 50-499 employees
*** Large businesses represent payrolls with more than 499 employees
Pre-market - July 1, 2009
Futures up slightly this morning before some important numbers come out later:
DJIA INDEX 8,433.00 39.00
S&P 500 920.70 5.20
NASDAQ 100 1,485.25 9.00
Gold 927 -13 -1.41%
Oil 71.11 +1.21 +1.73%
Economic calendar for today:
Monster Employment Index
Motor Vehicle Sales[djStar]
MBA Purchase Applications 7:00 AM ET
Challenger Job-Cut Report 7:30 AM ET
ADP Employment Report 8:15 AM ET
ISM Mfg Index 10:00 AM ET
Construction Spending 10:00 AM ET
Pending Home Sales Index 10:00 AM ET
EIA Petroleum Status Report 10:30 AM ET
Today's earnings reports:
 After market closed in BOLD
 After market closed in BOLD
Subscribe to:
Posts (Atom)
