Monday, December 28, 2009
Pre-market - 8:00
Futures pretty much flat this morning on a short, most likely boring week.
DJIA INDEX 10,470.00 4.00
S&P 500 1,123.10 1.10
NASDAQ 100 1,872.50 4.50
Today's economic calendar:
4-Week Bill Announcement 11:00 AM ET
3-Month Bill Auction 11:30 AM ET
6-Month Bill Auction 11:30 AM ET
2-Yr Note Auction 1:00 PM ET
Money Supply 4:30 PM ET
Today's earnings reports:
Before open:
CALM Cal-Maine Foods, Inc. Consumer Goods Farm Products
NWPX Northwest Pipe Co. Basic Materials Steel & Iron
After close:
BLSW Bridgeline Software, Inc. Technology Application Software


Thursday, December 24, 2009
NYT article on Goldman Sachs and the housing meltdown - how they bet against us - Bonus - Christmas Eve.
December 24, 2009
Banks Bundled Bad Debt, Bet Against It and Won
By GRETCHEN MORGENSON and LOUISE STORY
In late October 2007, as the financial markets were starting to come unglued, a Goldman Sachs trader, Jonathan M. Egol, received very good news. At 37, he was named a managing director at the firm.
Mr. Egol, a Princeton graduate, had risen to prominence inside the bank by creating mortgage-related securities, named Abacus, that were at first intended to protect Goldman from investment losses if the housing market collapsed. As the market soured, Goldman created even more of these securities, enabling it to pocket huge profits.
Goldman’s own clients who bought them, however, were less fortunate.
Pension funds and insurance companies lost billions of dollars on securities that they believed were solid investments, according to former Goldman employees with direct knowledge of the deals who asked not to be identified because they have confidentiality agreements with the firm.
Goldman was not the only firm that peddled these complex securities — known as synthetic collateralized debt obligations, or C.D.O.’s — and then made financial bets against them, called selling short in Wall Street parlance. Others that created similar securities and then bet they would fail, according to Wall Street traders, include Deutsche Bank and Morgan Stanley, as well as smaller firms like Tricadia Inc., an investment company whose parent firm was overseen by Lewis A. Sachs, who this year became a special counselor to Treasury Secretary Timothy F. Geithner.
How these disastrously performing securities were devised is now the subject of scrutiny by investigators in Congress, at the Securities and Exchange Commission and at the Financial Industry Regulatory Authority, Wall Street’s self-regulatory organization, according to people briefed on the investigations. Those involved with the inquiries declined to comment.
While the investigations are in the early phases, authorities appear to be looking at whether securities laws or rules of fair dealing were violated by firms that created and sold these mortgage-linked debt instruments and then bet against the clients who purchased them, people briefed on the matter say.
One focus of the inquiry is whether the firms creating the securities purposely helped to select especially risky mortgage-linked assets that would be most likely to crater, setting their clients up to lose billions of dollars if the housing market imploded.
Some securities packaged by Goldman and Tricadia ended up being so vulnerable that they soured within months of being created.
Goldman and other Wall Street firms maintain there is nothing improper about synthetic C.D.O.’s, saying that they typically employ many trading techniques to hedge investments and protect against losses. They add that many prudent investors often do the same. Goldman used these securities initially to offset any potential losses stemming from its positive bets on mortgage securities.
But Goldman and other firms eventually used the C.D.O.’s to place unusually large negative bets that were not mainly for hedging purposes, and investors and industry experts say that put the firms at odds with their own clients’ interests.
“The simultaneous selling of securities to customers and shorting them because they believed they were going to default is the most cynical use of credit information that I have ever seen,” said Sylvain R. Raynes, an expert in structured finance at R & R Consulting in New York. “When you buy protection against an event that you have a hand in causing, you are buying fire insurance on someone else’s house and then committing arson.”
Investment banks were not alone in reaping rich rewards by placing trades against synthetic C.D.O.’s. Some hedge funds also benefited, including Paulson & Company, according to former Goldman workers and people at other banks familiar with that firm’s trading.
Michael DuVally, a Goldman Sachs spokesman, declined to make Mr. Egol available for comment. But Mr. DuVally said many of the C.D.O.’s created by Wall Street were made to satisfy client demand for such products, which the clients thought would produce profits because they had an optimistic view of the housing market. In addition, he said that clients knew Goldman might be betting against mortgages linked to the securities, and that the buyers of synthetic mortgage C.D.O.’s were large, sophisticated investors, he said.
The creation and sale of synthetic C.D.O.’s helped make the financial crisis worse than it might otherwise have been, effectively multiplying losses by providing more securities to bet against. Some $8 billion in these securities remain on the books at American International Group, the giant insurer rescued by the government in September 2008.
From 2005 through 2007, at least $108 billion in these securities was issued, according to Dealogic, a financial data firm. And the actual volume was much higher because synthetic C.D.O.’s and other customized trades are unregulated and often not reported to any financial exchange or market.
Goldman Saw It Coming
Before the financial crisis, many investors — large American and European banks, pension funds, insurance companies and even some hedge funds — failed to recognize that overextended borrowers would default on their mortgages, and they kept increasing their investments in mortgage-related securities. As the mortgage market collapsed, they suffered steep losses.
A handful of investors and Wall Street traders, however, anticipated the crisis. In 2006, Wall Street had introduced a new index, called the ABX, that became a way to invest in the direction of mortgage securities. The index allowed traders to bet on or against pools of mortgages with different risk characteristics, just as stock indexes enable traders to bet on whether the overall stock market, or technology stocks or bank stocks, will go up or down.
Goldman, among others on Wall Street, has said since the collapse that it made big money by using the ABX to bet against the housing market. Worried about a housing bubble, top Goldman executives decided in December 2006 to change the firm’s overall stance on the mortgage market, from positive to negative, though it did not disclose that publicly.
Even before then, however, pockets of the investment bank had also started using C.D.O.’s to place bets against mortgage securities, in some cases to hedge the firm’s mortgage investments, as protection against a fall in housing prices and an increase in defaults.
Mr. Egol was a prime mover behind these securities. Beginning in 2004, with housing prices soaring and the mortgage mania in full swing, Mr. Egol began creating the deals known as Abacus. From 2004 to 2008, Goldman issued 25 Abacus deals, according to Bloomberg, with a total value of $10.9 billion.
Abacus allowed investors to bet for or against the mortgage securities that were linked to the deal. The C.D.O.’s didn’t contain actual mortgages. Instead, they consisted of credit-default swaps, a type of insurance that pays out when a borrower defaults. These swaps made it much easier to place large bets on mortgage failures.
Rather than persuading his customers to make negative bets on Abacus, Mr. Egol kept most of these wagers for his firm, said five former Goldman employees who spoke on the condition of anonymity. On occasion, he allowed some hedge funds to take some of the short trades.
Mr. Egol and Fabrice Tourre, a French trader at Goldman, were aggressive from the start in trying to make the assets in Abacus deals look better than they were, according to notes taken by a Wall Street investor during a phone call with Mr. Tourre and another Goldman employee in May 2005.
On the call, the two traders noted that they were trying to persuade analysts at Moody’s Investors Service, a credit rating agency, to assign a higher rating to one part of an Abacus C.D.O. but were having trouble, according to the investor’s notes, which were provided by a colleague who asked for anonymity because he was not authorized to release them. Goldman declined to discuss the selection of the assets in the C.D.O.’s, but a spokesman said investors could have rejected the C.D.O. if they did not like the assets.
Goldman’s bets against the performances of the Abacus C.D.O.’s were not worth much in 2005 and 2006, but they soared in value in 2007 and 2008 when the mortgage market collapsed. The trades gave Mr. Egol a higher profile at the bank, and he was among a group promoted to managing director on Oct. 24, 2007.
“Egol and Fabrice were way ahead of their time,” said one of the former Goldman workers. “They saw the writing on the wall in this market as early as 2005.” By creating the Abacus C.D.O.’s, they helped protect Goldman against losses that others would suffer.
As early as the summer of 2006, Goldman’s sales desk began marketing short bets using the ABX index to hedge funds like Paulson & Company, Magnetar and Soros Fund Management, which invests for the billionaire George Soros. John Paulson, the founder of Paulson & Company, also would later take some of the shorts from the Abacus deals, helping him profit when mortgage bonds collapsed. He declined to comment.
A Deal Gone Bad, for Some
The woeful performance of some C.D.O.’s issued by Goldman made them ideal for betting against. As of September 2007, for example, just five months after Goldman had sold a new Abacus C.D.O., the ratings on 84 percent of the mortgages underlying it had been downgraded, indicating growing concerns about borrowers’ ability to repay the loans, according to research from UBS, the big Swiss bank. Of more than 500 C.D.O.’s analyzed by UBS, only two were worse than the Abacus deal.
Goldman created other mortgage-linked C.D.O.’s that performed poorly, too. One, in October 2006, was a $800 million C.D.O. known as Hudson Mezzanine. It included credit insurance on mortgage and subprime mortgage bonds that were in the ABX index; Hudson buyers would make money if the housing market stayed healthy — but lose money if it collapsed. Goldman kept a significant amount of the financial bets against securities in Hudson, so it would profit if they failed, according to three of the former Goldman employees.
A Goldman salesman involved in Hudson said the deal was one of the earliest in which outside investors raised questions about Goldman’s incentives. “Here we are selling this, but we think the market is going the other way,” he said.
A hedge fund investor in Hudson, who spoke on the condition of anonymity, said that because Goldman was betting against the deal, he wondered whether the bank built Hudson with “bonds they really think are going to get into trouble.”
Indeed, Hudson investors suffered large losses. In March 2008, just 18 months after Goldman created that C.D.O., so many borrowers had defaulted that holders of the security paid out about $310 million to Goldman and others who had bet against it, according to correspondence sent to Hudson investors.
The Goldman salesman said that C.D.O. buyers were not misled because they were advised that Goldman was placing large bets against the securities. “We were very open with all the risks that we thought we sold. When you’re facing a tidal wave of people who want to invest, it’s hard to stop them,” he said. The salesman added that investors could have placed bets against Abacus and similar C.D.O.’s if they had wanted to.
A Goldman spokesman said the firm’s negative bets didn’t keep it from suffering losses on its mortgage assets, taking $1.7 billion in write-downs on them in 2008; but he would not say how much the bank had since earned on its short positions, which former Goldman workers say will be far more lucrative over time. For instance, Goldman profited to the tune of $1.5 billion from one series of mortgage-related trades by Mr. Egol with Wall Street rival Morgan Stanley, which had to book a steep loss, according to people at both firms.
Tetsuya Ishikawa, a salesman on several Abacus and Hudson deals, left Goldman and later published a novel, “How I Caused the Credit Crunch.” In it, he wrote that bankers deserted their clients who had bought mortgage bonds when that market collapsed: “We had moved on to hurting others in our quest for self-preservation.” Mr. Ishikawa, who now works for another financial firm in London, declined to comment on his work at Goldman.
Profits From a Collapse
Just as synthetic C.D.O.’s began growing rapidly, some Wall Street banks pushed for technical modifications governing how they worked in ways that made it possible for C.D.O.’s to expand even faster, and also tilted the playing field in favor of banks and hedge funds that bet against C.D.O.’s, according to investors.
In early 2005, a group of prominent traders met at Deutsche Bank’s office in New York and drew up a new system, called Pay as You Go. This meant the insurance for those betting against mortgages would pay out more quickly. The traders then went to the International Swaps and Derivatives Association, the group that governs trading in derivatives like C.D.O.’s. The new system was presented as a fait accompli, and adopted.
Other changes also increased the likelihood that investors would suffer losses if the mortgage market tanked. Previously, investors took losses only in certain dire “credit events,” as when the mortgages associated with the C.D.O. defaulted or their issuers went bankrupt.
But the new rules meant that C.D.O. holders would have to make payments to short sellers under less onerous outcomes, or “triggers,” like a ratings downgrade on a bond. This meant that anyone who bet against a C.D.O. could collect on the bet more easily.
“In the early deals you see none of these triggers,” said one investor who asked for anonymity to preserve relationships. “These things were built in to provide the dealers with a big payoff when something bad happened.”
Banks also set up ever more complex deals that favored those betting against C.D.O.’s. Morgan Stanley established a series of C.D.O.’s named after United States presidents (Buchanan and Jackson) with an unusual feature: short-sellers could lock in very cheap bets against mortgages, even beyond the life of the mortgage bonds. It was akin to allowing someone paying a low insurance premium for coverage on one automobile to pay the same on another one even if premiums over all had increased because of high accident rates.
At Goldman, Mr. Egol structured some Abacus deals in a way that enabled those betting on a mortgage-market collapse to multiply the value of their bets, to as much as six or seven times the face value of those C.D.O.’s. When the mortgage market tumbled, this meant bigger profits for Goldman and other short sellers — and bigger losses for other investors.
Selling Bad Debt
Other Wall Street firms also created risky mortgage-related securities that they bet against.
At Deutsche Bank, the point man on betting against the mortgage market was Greg Lippmann, a trader. Mr. Lippmann made his pitch to select hedge fund clients, arguing they should short the mortgage market. He sometimes distributed a T-shirt that read “I’m Short Your House!!!” in black and red letters.
Deutsche, which declined to comment, at the same time was selling synthetic C.D.O.’s to its clients, and those deals created more short-selling opportunities for traders like Mr. Lippmann.
Among the most aggressive C.D.O. creators was Tricadia, a management company that was a unit of Mariner Investment Group. Until he became a senior adviser to the Treasury secretary early this year, Lewis Sachs was Mariner’s vice chairman. Mr. Sachs oversaw about 20 portfolios there, including Tricadia, and its documents also show that Mr. Sachs sat atop the firm’s C.D.O. management committee.
From 2003 to 2007, Tricadia issued 14 mortgage-linked C.D.O.’s, which it called TABS. Even when the market was starting to implode, Tricadia continued to create TABS deals in early 2007 to sell to investors. The deal documents referring to conflicts of interest stated that affiliates and clients of Tricadia might place bets against the types of securities in the TABS deal.
Even so, the sales material also boasted that the mortgages linked to C.D.O.’s had historically low default rates, citing a “recently completed” study by Standard & Poor’s ratings agency — though fine print indicated that the date of the study was September 2002, almost five years earlier.
At a financial symposium in New York in September 2006, Michael Barnes, the co-head of Tricadia, described how a hedge fund could put on a negative mortgage bet by shorting assets to C.D.O. investors, according to his presentation, which was reviewed by The New York Times.
Mr. Barnes declined to comment. James E. McKee, general counsel at Tricadia, said, “Tricadia has never shorted assets into the TABS deals, and Tricadia has always acted in the best interests of its clients and investors.”
Mr. Sachs, through a spokesman at the Treasury Department, declined to comment.
Like investors in some of Goldman’s Abacus deals, buyers of some TABS experienced heavy losses. By the end of 2007, UBS research showed that two TABS deals were the eighth- and ninth-worst performing C.D.O.’s. Both had been downgraded on at least 75 percent of their associated assets within a year of being issued.
Tricadia’s hedge fund did far better, earning roughly a 50 percent return in 2007 and similar profits in 2008, in part from the short bets.


Market wrap - 2:40
Gap up, ramp up at open - day over for the most part. Yearly highs on the indexes - imagine that.
Dow 10,521 +54 +0.52%
Nasdaq 2,286 16 0.71%
S&P 500 1,126 6 0.53%
Gold 1,105 +11 +0.99%
Oil 77.75 1.08 1.41%


Jobless claims - 8:30
Full report here
UNEMPLOYMENT INSURANCE WEEKLY CLAIMS REPORT
SEASONALLY ADJUSTED DATA
In the week ending Dec. 19, the advance figure for seasonally adjusted initial claims was 452,000, a decrease of 28,000 from the previous week's unrevised figure of 480,000. The 4-week moving average was 465,250, a decrease of 2,750 from the previous week's revised average of 468,000.
The advance seasonally adjusted insured unemployment rate was 3.9 percent for the week ending Dec. 12, unchanged from the prior week's unrevised rate of 3.9 percent.
The advance number for seasonally adjusted insured unemployment during the week ending Dec. 12 was 5,076,000, a decrease of 127,000 from the preceding week's revised level of 5,203,000. The 4-week moving average was 5,233,000, a decrease of 90,000 from the preceding week's revised average of 5,323,000.
The fiscal year-to-date average for seasonally adjusted insured unemployment for all programs is 5.673 million.
UNADJUSTED DATA
The advance number of actual initial claims under state programs, unadjusted, totaled 561,902 in the week ending Dec. 19, an increase of 6,492 from the previous week. There were 719,615 initial claims in the comparable week in 2008.
The advance unadjusted insured unemployment rate was 4.1 percent during the week ending Dec. 12, an increase of 0.2 percentage point from the prior week. The advance unadjusted number for persons claiming UI benefits in state programs totaled 5,385,774, an increase of 193,030 from the preceding week. A year earlier, the rate was 3.4 percent and the volume was 4,594,820.
Extended benefits were available in Alabama, Alaska, Arizona, California, Colorado, Connecticut, Delaware, the District of Columbia, Florida, Georgia, Idaho, Illinois, Indiana, Kansas, Kentucky, Maine, Massachusetts, Michigan, Minnesota, Missouri, Nevada, New Hampshire, New Jersey, New Mexico, New York, North Carolina, Ohio, Oregon, Pennsylvania, Puerto Rico, Rhode Island, South Carolina, Tennessee, Texas, Vermont, Virginia, Washington, West Virginia, and Wisconsin during the week ending Dec. 5.
Initial claims for UI benefits by former Federal civilian employees totaled 2,117 in the week ending Dec. 12, an increase of 26 from the prior week. There were 2,150 initial claims by newly discharged veterans, a decrease of 261 from the preceding week.
There were 26,320 former Federal civilian employees claiming UI benefits for the week ending Dec. 5, an increase of 142 from the previous week. Newly discharged veterans claiming benefits totaled 36,224, a decrease of 784 from the prior week.
States reported 4,368,107 persons claiming EUC (Emergency Unemployment Compensation) benefits for the week ending Dec. 5, an increase of 141,807 from the prior week. There were 1,482,317 claimants in the comparable week in 2008. EUC weekly claims include first, second, and third tier activity.
The highest insured unemployment rates in the week ending Dec. 5 were in Puerto Rico (6.4 percent), Oregon (5.9), Pennsylvania (5.6), Wisconsin (5.6), Alaska (5.4), Washington (5.2), Idaho (5.1), Nevada (5.1), California (4.9), Michigan (4.9), and North Carolina (4.9).
The largest increases in initial claims for the week ending Dec. 12 were in Puerto Rico (+1,260), Louisiana (+1,123), Nebraska (+941), Maine (+728), and the District of Columbia (+696), while the largest decreases were in North Carolina (-14,374), Pennsylvania (-14,302), New York (-13,432), Georgia (-11,142), and Wisconsin (-10,650).
Durable goods - 8:30
Full report here
Advance Report on Durable Goods Manufacturers’ Shipments, Inventories and Orders
November 2009
New Orders
New orders for manufactured durable goods in November increased $0.3 billion or 0.2 percent to $166.9 billion, the U.S. Census Bureau announced today. This was the second monthly increase in the last three months. This followed a 0.6 percent October
decrease. Excluding transportation, new orders increased 2.0 percent. Excluding defense, new orders decreased slightly. Computers and electronic products, also up two of the last three months, had the largest increase, $0.9 billion or 3.7 percent to $25.7 billion.
Shipments
Shipments of manufactured durable goods in November, up three consecutive months, increased $0.5 billion or 0.3 percent to $175.9 billion. This followed a 0.7 percent October increase. Machinery, up two of the last three months, had the largest increase, $0.4 billion or 2.0 percent to $22.6 billion.
Unfilled Orders
Unfilled orders for manufactured durable goods in November, down fourteen consecutive months, decreased $4.9 billion or 0.7 percent to $724.5 billion.
This was the longest streak of consecutive monthly decreases since the series was first published on a NAICS basis in 1992 and followed a 0.6 percent October
decrease. Transportation equipment, down thirteen of the last fourteen months, had the largest decrease, $5.2 billion or 1.2 percent to $418.1 billion.
Inventories
Inventories of manufactured durable goods in November, down ten of the last eleven months, decreased $0.5 billion or 0.2 percent to $303.6 billion. This followed a slight increase in October. Computers and electronic products, down eleven
consecutive months, had the largest decrease, $0.2 billion or 0.4 percent to $42.8 billion.
Capital Goods
Nondefense new orders for capital goods in November decreased $1.0 billion or 1.9 percent to $53.5 billion. Shipments increased $0.2 billion or 0.3 percent to $57.0
billion. Unfilled orders decreased $3.5 billion or 0.8 percent to $413.9 billion. Inventories decreased $0.1 billion or 0.1 percent to $132.4 billion. Defense new orders for capital goods in November increased $0.7 billion or 8.5 percent to $9.2 billion. Shipments decreased $0.2 billion or 1.4 percent to $10.8 billion. Unfilled orders decreased $1.7 billion or 1.2 percent to $135.6 billion. Inventories decreased $0.1 billion or 0.5 percent to $20.2 billion.
Revised October Data
Revised seasonally adjusted October figures for all manufacturing industries were: new orders, $360.7 billion (revised from $360.5 billion); shipments, $369.5
billion (revised from $368.0 billion); unfilled orders, $729.4 billion (revised from $730.8 billion); and total inventories, $494.2 billion (revised from $493.0 billion).
Pre-market - 7:45
Futures up slightly waiting on jobs data.
DJIA INDEX 10,425.00 21.00
S&P 500 1,118.00 2.40
NASDAQ 100 1,855.25
Today's economic calendar:
Durable Goods Orders 8:30 AM ET
Jobless Claims 8:30 AM ET
EIA Natural Gas Report 10:30 AM ET
3-Month Bill Announcement 11:00 AM ET
6-Month Bill Announcement 11:00 AM ET
NYSE Early Close - 1:00 ET
SIFMA Rec. Early Close 2:00 ET
Money Supply[Bullet4:30 PM ET
Today's earnings reports: NONE
Wednesday, December 23, 2009
Market wrap - 4:15
Another up day on light volume. Junker stock the best performers.
Dow 10,466 2 0.01%
Nasdaq 2,270 17 0.75%
S&P 500 1,121 3 0.23%
GlobalDow 1,974 +13 +0.64%
Gold 1,095 +8 +0.72%
Oil 76.47 2.07 2.78%



New home sales - 10:00
New home sales
NEW RESIDENTIAL SALES IN NOVEMBER 2009
Sales of new one-family houses in November 2009 were at a seasonally adjusted annual rate of 355,000, according to estimates released jointly today by the U.S. Census Bureau and the Department of Housing and Urban Development. This is 11.3 percent (±11.0%) below the revised October rate of 400,000 and is 9.0 percent (±15.3%)* below the November 2008 estimate of 390,000.
The median sales price of new houses sold in November 2009 was $217,400; the average sales price was $280,300. The seasonally adjusted estimate of new houses for sale at the end of November was 235,000. This represents a supply of 7.9 months at the current sales rate.
This was a horrible number. They reported on TV this missed estimates by 11 percent. Market pretty much yawned.
This was a horrible number. They reported on TV this missed estimates by 11 percent. Market pretty much yawned.
S&P 50% Fib retracment - Today - 9:40
 Key area here just before Christmas. Where do we go from here?
Personal Income and Outlays - 8:30
Full report here
PERSONAL INCOME AND OUTLAYS: NOVEMBER 2009
Personal income increased $49.7 billion, or 0.4 percent, and disposable personal income (DPI)increased $54.1 billion, or 0.5 percent, in November, according to the Bureau of Economic Analysis. Personal consumption expenditures (PCE) increased $47.9 billion, or 0.5 percent. In October, personal income increased $33.6 billion, or 0.3 percent, DPI increased $50.2 billion, or 0.5 percent, and PCE increased $63.5 billion, or 0.6 percent, based on revised estimates.
Real disposable income increased 0.2 percent in November, the same increase as in October. Real PCE increased 0.2 percent in November, compared with an increase of 0.4 percent in October.
More at link with formatted tables
Pre-market - 7:45
Futures up today because it's Wednesday and we must rally into Christmas - I guess.
DJIA INDEX 10,433.00 25.00
S&P 500 1,117.80 4.20
NASDAQ 100 1,846.50 5.50
Today's economic calendar:
MBA Purchase Applications 7:00 AM ET
Personal Income and Outlays 8:30 AM ET
Consumer Sentiment 9:55 AM ET
New Home Sales 10:00 AM ET
EIA Petroleum Status Report 10:30 AM ET
2-Yr Note Announcement 11:00 AM ET
5-Yr Note Announcement 11:00 AM ET
7-Yr Note Announcement 11:00 AM ET
Today's earnings reports;
Before open:
AM American Greetings Corp. Services Business Services
After close:
OHB Orleans Homebuilders Inc. Industrial Goods Residential Construction
Tuesday, December 22, 2009
Existing home sales - 10:00
Full report here
Another Big Gain in Existing-Home Sales as Buyers Respond to Tax Credit
Washington, December 22, 2009
Existing-home sales rose again in November as first-time buyers rushed to close sales before the original November 30 deadline for the recently extended and expanded tax credit, according to the National Association of Realtors®.
Existing-home sales – including single-family, townhomes, condominiums and co-ops – rose 7.4 percent to a seasonally adjusted annual rate1 of 6.54 million units in November from 6.09 million in October, and are 44.1 percent higher than the 4.54 million-unit pace in November 2008. Current sales remain at the highest level since February 2007 when they hit 6.55 million.
Lawrence Yun, NAR chief economist, said the rise was expected. “This clearly is a rush of first-time buyers not wanting to miss out on the tax credit, but there are many more potential buyers who can enter the market in the months ahead,” he said. “We expect a temporary sales drop while buying activity ramps up for another surge in the spring when buyers take advantage of the expanded tax credit, which hopefully will take us into a self-sustaining market in the second half of 2010. In all, 4.4 million households are expected to claim the tax credit before it expires and balance should be restored to the housing sector with inventories continuing to decline.”
An NAR practitioner survey2 shows first-time buyers purchased 51 percent of homes in November, compared with an upwardly revised 50 percent of transactions in October.
According to Freddie Mac, the national average commitment rate for a 30-year, conventional, fixed-rate mortgage fell to 4.88 percent in November from 4.95 percent in October; the rate was 6.09 percent in November 2008. Last month’s mortgage interest rate was the second lowest on record after bottoming at 4.81 percent in April 2009.
NAR President Vicki Cox Golder, owner of Vicki L. Cox & Associates in Tucson, Ariz., said conditions are optimal for buyers in the current market. “Inventories have steadily declined and are closer to balanced levels, which indicate home prices in many areas are either stabilizing or could soon stabilize and return to normal appreciation patterns,” she said. “This means buyers still have good choices but are purchasing near the bottom of the price cycle with historically low mortgage interest rates. Throw a tax credit on top and it really doesn’t get any better for buyers with secure jobs and long-term ownership plans.”
Total housing inventory at the end of November declined 1.3 percent to 3.52 million existing homes available for sale, which represents a 6.5-month supply3 at the current sales pace, down from an 7.0-month supply in October.
Raw unsold inventory figures are 15.5 percent below a year ago. The last time there was a lower supply of homes on the market was April 2006 when it was at a 6.1-month supply.
“Nearly all markets experienced a solid sales gain from one year ago,” Yun said. “The only markets with measurably lower sales were in San Diego, Riverside, and Sacramento, where inventory shortages for lower priced homes are limiting sales.”
For the second month in a row, sales have risen in all price classes from a year earlier. Prior to October, the only consistent gains were in the lower price ranges.
The national median existing-home price4 for all housing types was $172,600 in November, which is 4.3 percent below November 2008. Distressed properties, which accounted for 33 percent of sales in November, continue to downwardly distort the median price because they generally sell at a discount relative to traditional homes in the same area.
Single-family home sales jumped 8.5 percent to a seasonally adjusted annual rate of 5.77 million in November from a level of 5.32 million in October, and are 42.1 percent above the pace of 4.06 million in November 2008. The median existing single-family home price was $171,900 in November, down 4.4 percent from a year ago.
Existing condominium and co-op sales in November were unchanged from a seasonally adjusted annual rate of 770,000 in October, but are 60.1 percent above the 481,000-unit pace a year ago. The median existing condo price5 was $178,000 in November, which is 3.1 percent below November 2008.
Regionally, existing-home sales in the Northeast rose 6.6 percent to an annual level of 1.13 million in November, and are 52.7 percent higher than November 2008. The median price in the Northeast was $223,400, down 13.1 percent from a year ago.
Existing-home sales in the Midwest increased 8.4 percent in November to a pace of 1.55 million and are 53.5 percent above a year ago. The median price in the Midwest was $140,800, a decline of 0.4 percent from November 2008.
In the South, existing-home sales rose 4.8 percent to an annual level of 2.39 million in November and are 44.8 percent higher than a year ago. The median price in the South was $151,400, down 1.4 percent from November 2008.
Existing-home sales in the West increased 10.6 percent to an annual rate of 1.46 million in November and are 28.1 percent above November 2008. The median price in the West was $231,100, which is 4.1 percent below a year ago.
The National Association of Realtors®, “The Voice for Real Estate,” is America’s largest trade association, representing 1.2 million members involved in all aspects of the residential and commercial real estate industries.
GDP & Corporate profits - 8:30
Full report here
EMBARGOED UNTIL RELEASE AT 8:30 A.M. EST, TUESDAY, DECEMBER 22, 2009
BEA 09-57
* See the navigation bar at the right side of the news release text for links to data tables,contact personnel and their telephone numbers, and supplementary materials.
GROSS DOMESTIC PRODUCT: THIRD QUARTER 2009 (THIRD ESTIMATE)
CORPORATE PROFITS: THIRD QUARTER 2009 (REVISED ESTIMATE)
Real gross domestic product -- the output of goods and services produced by labor and property located in the United States -- increased at an annual rate of 2.2 percent in the third quarter of 2009, (that is, from the second quarter to the third quarter), according to the "third" estimate released by the Bureau of Economic Analysis. In the second quarter, real GDP decreased 0.7 percent.
The GDP estimate released today is based on more complete source data than were available for the "second" estimate issued last month. In the second estimate, the increase in real GDP was 2.8 percent (see "Revisions" on page 3).
The increase in real GDP in the third quarter primarily reflected positive contributions from personal consumption expenditures (PCE), exports, private inventory investment, federal government spending, and residential fixed investment that were partly offset by a negative contribution from nonresidential fixed investment. Imports, which are a subtraction in the calculation of GDP, increased.
The upturn in real GDP in the third quarter primarily reflected upturns in PCE, in exports, in private inventory investment, and in residential fixed investment and a smaller decrease in nonresidential fixed investment that were partly offset by an upturn in imports, a downturn in state and local government spending, and a deceleration in federal government spending.
_______________
FOOTNOTE.--Quarterly estimates are expressed at seasonally adjusted annual rates, unless otherwise specified. Quarter-to-quarter dollar changes are differences between these published estimates. Percent changes are calculated from unrounded data and are annualized. “Real” estimates are in chained (2005)dollars. Price indexes are chain-type measures.
This news release is available on BEA’s Web site along with the Technical Note and Highlights related to this release.
_______________
Motor vehicle output added 1.45 percentage points to the third-quarter change in real GDP after adding 0.19 percentage point to the second-quarter change. Final sales of computers subtracted 0.08 percentage point from the third-quarter change in real GDP after subtracting 0.04 percentage point from the second-quarter change.
The price index for gross domestic purchases, which measures prices paid by U.S. residents, increased 1.3 percent in the third quarter, 0.1 percentage point less than the second estimate; this index increased 0.5 percent in the second quarter. Excluding food and energy prices, the price index for gross domestic purchases increased 0.3 percent in the third quarter, compared with an increase of 0.8 percent
in the second.
Real personal consumption expenditures increased 2.8 percent in the third quarter, in contrast to a decrease of 0.9 percent in the second. Real nonresidential fixed investment decreased 5.9 percent,compared with a decrease of 9.6 percent. Nonresidential structures decreased 18.4 percent, compared with a decrease of 17.3 percent. Equipment and software increased 1.5 percent, in contrast to a decrease
of 4.9 percent. Real residential fixed investment increased 18.9 percent, in contrast to a decrease of 23.3 percent.
Real exports of goods and services increased 17.8 percent in the third quarter, in contrast to a decrease of 4.1 percent in the second. Real imports of goods and services increased 21.3 percent, in contrast to a decrease of 14.7 percent.
Real federal government consumption expenditures and gross investment increased 8.0 percent in the third quarter, compared with an increase of 11.4 percent in the second. National defense increased 8.4 percent, compared with an increase of 14.0 percent. Nondefense increased 7.0 percent, compared with an increase of 6.1 percent. Real state and local government consumption expenditures and gross
investment decreased 0.6 percent, in contrast to an increase of 3.9 percent.
The change in real private inventories added 0.69 percentage point to the third-quarter change in real GDP, after subtracting 1.42 percentage points from the second-quarter change. Private businesses decreased inventories $139.2 billion in the third quarter, following decreases of $160.2 billion in the second quarter and $113.9 billion in the first.
Real final sales of domestic product -- GDP less change in private inventories -- increased 1.5 percent in the third quarter, compared with an increase of 0.7 percent in the second.
Gross domestic purchases
Real gross domestic purchases -- purchases by U.S. residents of goods and services wherever produced -- increased 3.0 percent in the third quarter, in contrast to a decrease of 2.3 percent in the second.
Gross national product
Real gross national product -- the goods and services produced by the labor and property supplied by U.S. residents -- increased 3.0 percent in the third quarter, in contrast to a decrease of 1.0 percent in the second. GNP includes, and GDP excludes, net receipts of income from the rest of the world, which increased $25.7 billion in the third quarter after decreasing $7.4 billion in the second; in
the third quarter, receipts increased $15.7 billion, and payments decreased $10.0 billion.
Current-dollar GDP
Current-dollar GDP -- the market value of the nation's output of goods and services -- increased 2.6 percent, or $90.9 billion, in the third quarter to a level of $14,242.1 billion. In the second quarter, current-dollar GDP decreased 0.8 percent, or $26.8 billion.
Revisions
The "third" estimate of the third-quarter increase in real GDP is 0.6 percentage point, or $17.3 billion, lower than the second estimate issued last month, primarily reflecting downward revisions to nonresidential fixed investment, to private inventory investment, and to personal consumption expenditures.
Advance Estimate Second Estimate Third Estimate
(Percent change from preceding quarter)
Real GDP................... 3.5 2.8 2.2
Current-dollar GDP......... 4.3 3.3 2.6
Gross domestic purchases price index. 1.6 1.4 1.3
Corporate Profits
Profits from current production (corporate profits with inventory valuation and capital consumption adjustments) increased $132.4 billion in the third quarter, compared with an increase of $43.8 billion in the second quarter. Current-production cash flow (net cash flow with inventory valuation adjustment) -- the internal funds available to corporations for investment -- increased $28.4
billion in the third quarter, in contrast to a decrease of $30.5 billion in the second.
Taxes on corporate income increased $15.1 billion in the third quarter, compared with an increase of $35.6 billion in the second. Profits after tax with inventory valuation and capital consumption adjustments increased $117.3 billion in the third quarter, compared with an increase of $8.2 billion in the second. Dividends decreased $6.1 billion, compared with a decrease of $62.1 billion; current-
production undistributed profits increased $123.5 billion, compared with an increase of $70.3 billion.
Domestic profits of financial corporations increased $82.8 billion in the third quarter, compared with an increase of $28.5 billion in the second. Domestic profits of nonfinancial corporations increased $27.6 billion in the third quarter, compared with an increase of $29.8 billion in the second. In the third quarter, real gross value added of nonfinancial corporations increased, and profits per unit of real value added increased. The increase in unit profits reflected decreases in both unit nonlabor and labor costs that more than offset a decrease in unit prices.
The rest-of-the-world component of profits increased $22.0 billion in the third quarter, in contrast to a decrease of $14.6 billion in the second. This measure is calculated as (1) receipts by U.S. residents of earnings from their foreign affiliates plus dividends received by U.S. residents from unaffiliated foreign corporations minus (2) payments by U.S. affiliates of earnings to their foreign parents plus dividends paid by U.S. corporations to unaffiliated foreign residents. The third-quarter increase was accounted for by a larger increase in receipts than in payments.
Profits before tax with inventory valuation adjustment is the best available measure of industry profits because estimates of the capital consumption adjustment by industry do not exist. This measure reflects depreciation-accounting practices used for federal income tax returns. According to this measure, domestic profits of both financial and nonfinancial corporations increased in the third quarter. The increase in nonfinancial corporations reflected increases in utilities, information, "other"
nonfinancial, retail trade, and transportation and warehousing that were partly offset by decreases in wholesale trade and manufacturing. Within manufacturing, the largest decrease was in “other” durable goods, and the largest increase was in motor vehicles.
Profits before tax increased $157.9 billion in the third quarter, compared with an increase of $90.6 billion in the second. The before-tax measure of profits does not reflect, as does profits from current production, the capital consumption and inventory valuation adjustments. These adjustments convert depreciation of fixed assets and inventory withdrawals reported on a tax-return, historical-cost basis to
the current-cost measures used in the national income and product accounts. The capital consumption adjustment increased $9.7 billion in the third quarter (from -$128.6 billion to -$118.9 billion), compared with an increase of $16.3 billion in the second. The inventory valuation adjustment decreased $35.2 billion (from $18.1 billion to -$17.1 billion), compared with a decrease of $63.0 billion.
* * *
BEA’s national, international, regional, and industry estimates; the Survey of Current Business;and BEA news releases are available without charge on BEA’s Web site at www.bea.gov. By visiting the site, you can also subscribe to receive free e-mail summaries of BEA releases and announcements.
* * *
Next release -- January 29, 2010, at 8:30 A.M. EST for:
Gross Domestic Product: Fourth Quarter 2009 (Advance Estimate)
Pre-market - Tuesday, December 22, 2009
Futures up a bit this morning, not sure why, maybe because it's Tuesday.
DJIA INDEX 10,380.00 38.00
S&P 500 1,112.40 4.20
NASDAQ 100 1,835.50 10.00
Today's economic calendar:
ICSC-Goldman Store Sales 7:45 AM ET
GDP 8:30 AM ET
Corporate Profits 8:30 AM ET
Redbook 8:55 AM ET
Existing Home Sales 10:00 AM ET
4-Week Bill Auction 11:30 AM ET
Today's earnings reports;
Before open:
CMC Commercial Metals Company Basic Materials Steel & Iron
CPY CPI Corp. Services Personal Services
LNN Lindsay Corporation Industrial Goods Farm & Construction Machinery
PKE Park Electrochemical Corp. Technology Printed Circuit Boards
PRGS Progress Software Corp. Technology Application Software
XNN Xenonics Holdings, Inc. Consumer Goods Home Furnishings & Fixtures
After close:
CTAS Cintas Corp. Services Business Services
FINL Finish Line Inc. Services Apparel Stores
FSII FSI International Inc. Technology Semiconductor Equipment & Materials
MU Micron Technology Inc. Technology Semiconductor- Memory Chips
RHT Red Hat Inc. Technology Application Software
TIBX Tibco Software Inc. Technology Business Software & Services
Monday, December 21, 2009
Market wrap - 4:15
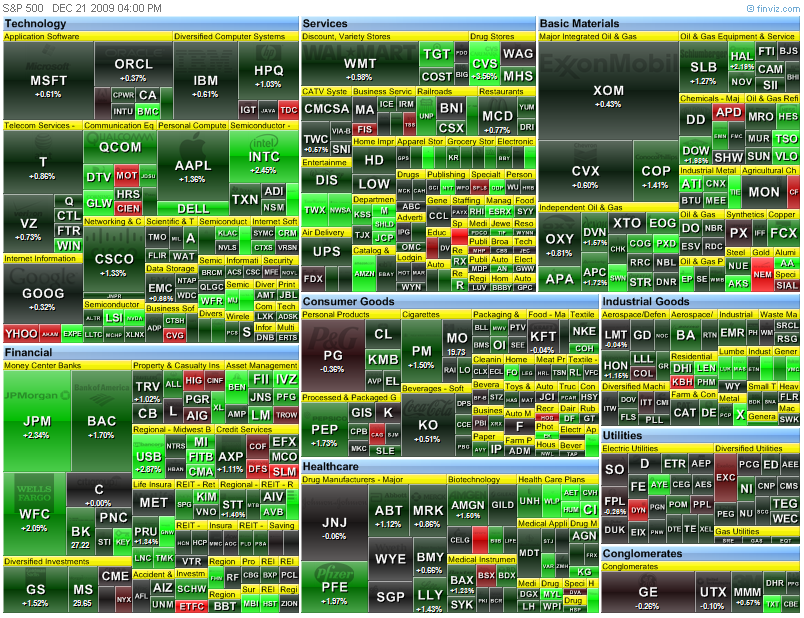
Just another normal Monday. Ramp up right from the bell, Dow as much as triple digit gains by 10:15, perhaps on an upgrade to Alcoca (AA). Healthcare stock were strong performers today, led by insurers, which should tell us something about the bill in Congress.
Looking at the S&P, today was the 29th straight day, the index has traded between 1085 and 1115. Wow! Yet they tell us everything is better. Then why isn't the market breaking out above the 1115 level? Could it be, just maybe, the damn thing shouldn't be this inflated to begin with?
Dow 10,414 +85 +0.83%
Nasdaq 2,238 26 1.17%
S&P 500 1,114 12 1.05%
GlobalDow 1,951 +16 +0.84%
Gold 1,096 -16 -1.40%
Oil 72.73 -0.63 -0.86%


Pre-market - Monday, December 21, 2009
Futures:
DJIA INDEX 10,312.00 41.00
S&P 500 1,103.40 5.70
NASDAQ 100 1,816.75
Today's economic reports:
4-Week Bill Announcement 11:00 AM ET
3-Month Bill Auction 11:30 AM ET
6-Month Bill Auction 11:30 AM ET
Today's earnings reports.
Before open:
CAG ConAgra Foods, Inc. Consumer Goods Processed & Packaged Goods
After close:
JBL Jabil Circuit Inc. Technology Printed Circuit Boards
Friday, December 18, 2009
My repy from Sherrod Brown concerning Bernanke confirmation - Friday, December 18, 2009
I recently wrote Sherrod Brown and George Voinovich about confirming Ben Bernanke to another term as Chairman of the Federal Reserve Board. I was nice, but told them, if in fact they voted for him, they lose my vote. I did get a reply from Mr. Brown, nothing from Mr. Voinovich as of yet. In the past when I wrote Mr. Voinavich, I never recieved a reply, so I don't really expect one. I do thank Mr. Brown for at least replying. Below is his reply.
Dear Mr. XXXXXXXXX:
Thank you for sharing your thoughts about the nomination of Ben Bernanke to serve a second term as chairman of the Federal Reserve.
I agree with you that a lack of oversight contributed to the financial and economic problems that have confronted the nation, and I have addressed those concerns to Chairman Bernanke in public and private. Regulators, including the Federal Reserve, did not do enough to promote the strong supervision of financial firms and protect the public from economic turmoil.
As a member of the Senate Banking Committee, I am working to ensure that sufficient safeguards are in place to ensure that our financial system remains stable over time. I have emphasized to Chairman Bernanke that a culture change at the Federal Reserve, as well as an independent risk regulator and tough accountability measures, are necessary to prevent another economic crisis from gripping our country. You can be sure I will continue to work with the committee and with Chairman Bernanke to press for these changes.
That being said, I believe the bold steps that Chairman Bernanke and Treasury Secretary Paulson took to prevent economic meltdown in the fall of 2008 forestalled an even worse financial crisis. He has demonstrated a willingness to put pragmatism before ideology and act decisively to protect the interests of the United States, and I recently voted in the Senate Banking Committee to approve the Chairman’s nomination to serve a second term.
Please be assured that I will keep your thoughts in mind as Chairman Bernanke’s nomination moves to the full Senate for consideration. Thank you again for getting in touch with me.
Sincerely,
Sherrod Brown
United States Senator
*****
All I have to say Mr. Brown is quite simple. You have lost my vote, and Ben Bernanke is a damn liar, which he has proven on multiple occasions, so why should I believe him now. Did he have a come to Jesus moment? I think not, unless of course, Jesus is a Wall Street banker. Simple enough?
Market wrap - 4:20
Borrrinnnggg! Just not much going on today. End of year, index re-balancing. Nothing much too exciting.
Dow 10,329 21 0.20%
Nasdaq 2,212 32 1.45%
S&P 500 1,102 6 0.58%
GlobalDow 1,935 -8 -0.41%
Gold 1,112 +5 +0.42%
Oil 73.11 +0.46 +0.63



Pre-market, Friday, December 18, 2009
Futures up on the RIMM earnings last night.
DJIA INDEX 10,309.00 37.00
S&P 500 1,099.50 5.30
NASDAQ 100 1,790.25 4.75
Today's economic calendar:
Quadruple Witching
Today's earnings reports.
Before open:
CCL Carnival Corp. Services General Entertainment
KMX CarMax Inc. Services Auto Dealerships
NEOG Neogen Corp. Healthcare Diagnostic Substances
STEI Stewart Enterprises Inc. Services Personal Services
After close:
None
Thursday, December 17, 2009
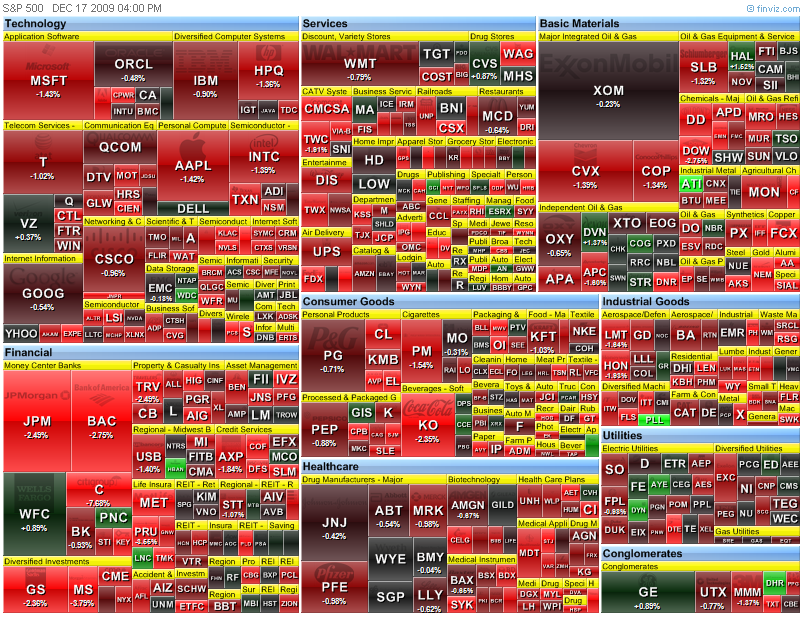
Market wrap - 4:10
Opps!
Dow 10,308 -133 -1.27%
Nasdaq 2,180 -27 -1.22%
S&P 500 1,096 -13 -1.18%
GlobalDow 1,943 -36 -1.81%
Gold 1,107 -29 -2.55%
Oil 72.61 -0.05 -0.07%


Bernanke passes Committee 16-7
From MarketWatch
Dec. 17, 2009, 11:50 a.m. EST
Senate panel approves Bernanke on 16-7 vote
Size of opposition signals rough waters ahead
By Greg Robb, MarketWatch
WASHINGTON (MarketWatch) -- The Senate Banking Committee on Thursday approved the nomination of Federal Reserve Board chairman Ben Bernanke to a second four-year term by an unusually close margin of 16-7.
The debate prior to the vote was contentious.
Several senators complained that the Fed had not provided information they requested prior to the vote. Many questioned Bernanke's actions prior to the financial crisis and during the tense days in the fall of 2008 when U.S. investment banking sector essentially disappeared overnight.
On the Economy, Stability or Growth a Tough Choice
Europe has long advocated for a stable economy; the U.S. has preferred a dynamic one. WSJ's David Wessel says those mindsets are clashing once again during the current crisis.
Analysts expect a close vote on the Senate floor after the holiday recess.
Bernanke failed to woo the support of Sen. Richard Shelby, R-Ala. and the ranking minority member of the Banking Committee.
"I strongly disapprove of some of the past deeds of the Federal Reserve while Ben Bernanke was a member and a chairman, and I lack confidence in what little plans for the future he has articulated," Shelby said in a lengthy statement.
Shelby's opposition means the Fed won't be able to count on Republican support to fend off sweeping changes to the Fed's regulatory powers put forward by Sen. Christopher Dodd, D.-Conn., and the chairman of the panel.
Dodd has said that the Fed's oversight of the biggest banks prior to the financial crisis was an "abysmal failure." Dodd has proposed stripping the oversight power from the Fed and giving it to a new single banking regulator to oversee the financial sector.
Supporters of Bernanke said that opponents were just engaging in typical Monday-morning-quarterbacking after a crisis abates.
"He's the guy I would hire" to get the U.S. out of trouble, said Sen. Judd Gregg, R.-N.H.
Filly Fed Leading Indicators - 10:00
Full report here
Released: Thursday, December 17, 2009
The Conference Board Leading Economic Index™ (LEI) for the U.S. increased 0.9 percent in November, following a 0.3 percent gain in October, and a 1.2 percent rise in September.
Download a PDF of the technical notes for underlying detail, diffusion indexes, components, contributions and graphs.
Download a PDF of the press release with graph and summary table.
Says Ataman Ozyildirim, Economist at The Conference Board: "The Conference Board LEI has been on an uptrend for more than half a year and it is now slightly higher than its latest peak in July 2007. Improving financial conditions, labor market indicators, and housing permits have helped the LEI continue its gains in November. However, its six-month growth rate has slowed somewhat in recent months."
Says Ken Goldstein, Economist at The Conference Board: "The indicators point to a bright new year. The U.S. LEI increased for the eighth consecutive month. Looking ahead, we can expect a slowly improving economy through 2010. The Conference Board Coincident Economic Index™ (CEI) for the U.S. also increased in November. Employment largely held steady, making this the first month since December 2007 that it did not make a negative contribution to the index."
The Conference Board Coincident Economic Index™ (CEI) for the U.S.rose 0.2 percent in November, following no change in October, and a 0.1 percent decline in September. The Conference Board Lagging Economic Index™ (LAG) declined 0.4 percent in November, following a 0.2 percent decline in October, and a 0.5 percent decline in September.
The next release is scheduled for January 21, 2010 at 10 A.M. ET.
Professional Contacts at The Conference Board:
Ken Goldstein: 212-339-0331
Indicators Program: 212-339-0330
Media Contacts:
Frank Tortorici: +1 212 339 0231
Email:
indicators@conference-board.org
Jobless claims - 8:30
Full report here
UNEMPLOYMENT INSURANCE WEEKLY CLAIMS REPORT
SEASONALLY ADJUSTED DATA
In the week ending Dec. 12, the advance figure for seasonally adjusted initial claims was 480,000, an increase of 7,000 from the previous week's revised figure of 473,000. The 4-week moving average was 467,500, a decrease of 5,250 from the previous week's revised average of 472,750.
The advance seasonally adjusted insured unemployment rate was 3.9 percent for the week ending Dec. 5, unchanged from the prior week's unrevised rate of 3.9 percent.
The advance number for seasonally adjusted insured unemployment during the week ending Dec. 5 was 5,186,000, an increase of 5,000 from the preceding week's revised level of 5,181,000. The 4-week moving average was 5,318,250, a decrease of 106,750 from the preceding week's revised average of 5,425,000.
The fiscal year-to-date average for seasonally adjusted insured unemployment for all programs is 5.722 million.
UNADJUSTED DATA
The advance number of actual initial claims under state programs, unadjusted, totaled 555,344 in the week ending Dec. 12, a decrease of 107,393 from the previous week. There were 629,867 initial claims in the comparable week in 2008.
The advance unadjusted insured unemployment rate was 3.9 percent during the week ending Dec. 5, a decrease of 0.2 percentage point from the prior week. The advance unadjusted number for persons claiming UI benefits in state programs totaled 5,176,122, a decrease of 222,989 from the preceding week. A year earlier, the rate was 3.3 percent and the volume was 4,378,273.
Extended benefits were available in Alabama, Alaska, Arizona, California, Colorado, Connecticut, Delaware, the District of Columbia, Florida, Georgia, Idaho, Illinois, Indiana, Kansas, Kentucky, Maine, Massachusetts, Michigan, Minnesota, Missouri, Nevada, New Hampshire, New Jersey, New Mexico, New York, North Carolina, Ohio, Oregon, Pennsylvania, Puerto Rico, Rhode Island, South Carolina, Tennessee, Texas, Vermont, Virginia, Washington, West Virginia, and Wisconsin during the week ending Nov. 28.
Initial claims for UI benefits by former Federal civilian employees totaled 2,081 in the week ending Dec. 5, an increase of 340 from the prior week. There were 2,390 initial claims by newly discharged veterans, an increase of 1,007 from the preceding week.
There were 25,903 former Federal civilian employees claiming UI benefits for the week ending Nov. 28, an increase of 1,764 from the previous week. Newly discharged veterans claiming benefits totaled 36,441, an increase of 2,689 from the prior week.
States reported 4,226,300 persons claiming EUC (Emergency Unemployment Compensation) benefits for the week ending Nov. 28, an increase of 45,922 from the prior week. There were 994,188 claimants in the comparable week in 2008. EUC weekly claims include first, second, and third tier activity.
The highest insured unemployment rates in the week ending Nov. 28 were in Wisconsin (6.4 percent), Oregon (6.3), Alaska (6.2), Nevada (5.5), Puerto Rico (5.4), Michigan (5.3), Pennsylvania (5.3), Arkansas (5.2), Idaho (5.2), North Carolina (5.2), and Washington (5.2).
The largest increases in initial claims for the week ending Dec. 5 were in California (+28,358), Georgia (+19,454), North Carolina (+18,500), Pennsylvania (+17,372), and New York (+16,344), while the largest decreases were in Kansas (-3,803), Kentucky (-2,048), Idaho (-979), Iowa (-917), and Puerto Rico (-892).
More at link with formatted tables
Pre-market - Thursday - December 17, 2009
Futures down on a stronger dollar and waiting on jobless claims report.
DJIA INDEX 10,347.00 -43.00
S&P 500 1,099.50 -6.20
NASDAQ 100 1,790.75 -9.25
Today's economic reports:
Jobless Claims 8:30 AM ET
Leading Indicators 10:00 AM ET
Philadelphia Fed Survey 10:00 AM ET
EIA Natural Gas Report 10:30 AM ET
3-Month Bill Announcement 11:00 AM ET
6-Month Bill Announcement 11:00 AM ET
Money Supply 4:30 PM ET
Today's economic reports:
Before open:
ATU Actuant Corporation Industrial Goods Diversified Machinery
BRLI Bio-Reference Laboratories Inc. Healthcare Medical Laboratories & Research
DFS Discover Financial Services Financial Credit Services
FDX FedEx Corporation Services Air Delivery & Freight Services
GIS General Mills Inc. Consumer Goods Processed & Packaged Goods
MCS The Marcus Corporation Services Lodging
MS Morgan Stanley Financial Diversified Investments
PIR Pier 1 Imports Inc. Services Home Furnishing Stores
RAD Rite Aid Corp. Services Drug Stores
SCHL Scholastic Corporation Services Publishing - Books
WGO Winnebago Industries Inc. Consumer Goods Recreational Vehicles
After close:
ACN Accenture plc Services Management Services
APSG Applied Signal Technology, Inc. Technology Communication Equipment
COMS 3Com Corporation Technology Networking & Communication Devices
CRI Carter's, Inc. Consumer Goods Textile - Apparel Clothing
DRI Darden Restaurants, Inc. Services Restaurants
HEI HEICO Corp. Industrial Goods Aerospace/Defense Products & Services
LUB Luby's Inc. Services Restaurants
NKE Nike Inc. Consumer Goods Textile - Apparel Footwear & Accessories
ORCL Oracle Corp. Technology Application Software
PALM Palm, Inc. Technology Personal Computers
RFMI RF Monolithics Inc. Technology Communication Equipment
RIMM Research In Motion Ltd. Technology Diversified Communication Services
SCS Steelcase Inc. Consumer Goods Business Equipment
SMOD SMART Modular Technologies (WWH) Inc. Technology Semiconductor - Integrated Circuits
ZQK Quiksilver Inc. Consumer Goods Textile - Apparel Clothing
Wednesday, December 16, 2009
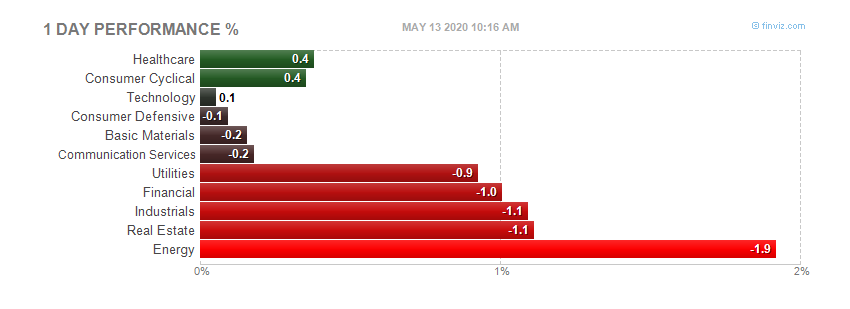
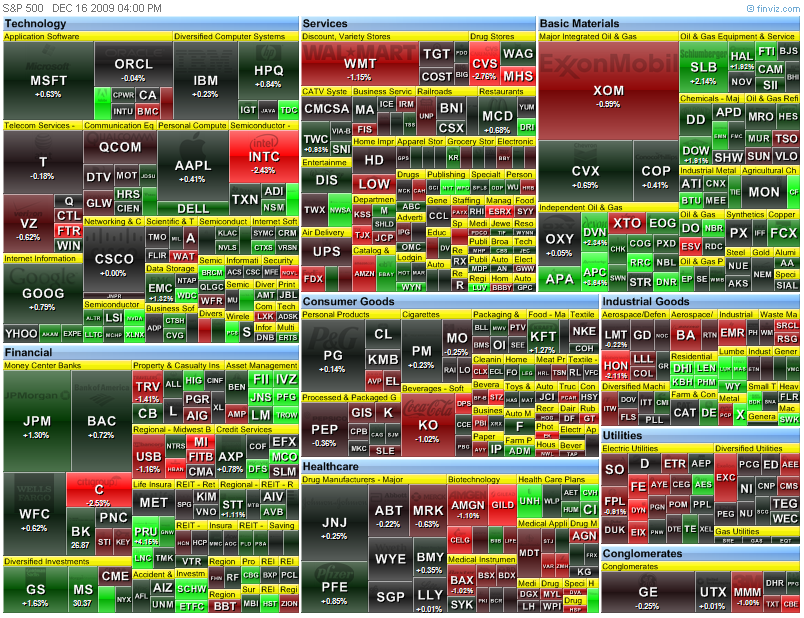
Market wrap - 4:10
Market gapped up this morning hitting 1116 early in the day. Didn't do much until the Fed statement at 2:15 and sold off a bit.
Dow 10,441 -11 -0.10%
Nasdaq 2,207 6 0.27%
S&P 500 1,109 1 0.11%
GlobalDow 1,977 +10 +0.52%
Gold 1,136 +13 +1.16%
Oil 72.67 +1.98 +2.80%


Fed Statement - 2:15
Full report here
Release Date: December 16, 2009
For immediate release
Information received since the Federal Open Market Committee met in November suggests that economic activity has continued to pick up and that the deterioration in the labor market is abating. The housing sector has shown some signs of improvement over recent months. Household spending appears to be expanding at a moderate rate, though it remains constrained by a weak labor market, modest income growth, lower housing wealth, and tight credit. Businesses are still cutting back on fixed investment, though at a slower pace, and remain reluctant to add to payrolls; they continue to make progress in bringing inventory stocks into better alignment with sales. Financial market conditions have become more supportive of economic growth. Although economic activity is likely to remain weak for a time, the Committee anticipates that policy actions to stabilize financial markets and institutions, fiscal and monetary stimulus, and market forces will contribute to a strengthening of economic growth and a gradual return to higher levels of resource utilization in a context of price stability.
With substantial resource slack likely to continue to dampen cost pressures and with longer-term inflation expectations stable, the Committee expects that inflation will remain subdued for some time.
The Committee will maintain the target range for the federal funds rate at 0 to 1/4 percent and continues to anticipate that economic conditions, including low rates of resource utilization, subdued inflation trends, and stable inflation expectations, are likely to warrant exceptionally low levels of the federal funds rate for an extended period. To provide support to mortgage lending and housing markets and to improve overall conditions in private credit markets, the Federal Reserve is in the process of purchasing $1.25 trillion of agency mortgage-backed securities and about $175 billion of agency debt. In order to promote a smooth transition in markets, the Committee is gradually slowing the pace of these purchases, and it anticipates that these transactions will be executed by the end of the first quarter of 2010. The Committee will continue to evaluate the timing and overall amounts of its purchases of securities in light of the evolving economic outlook and conditions in financial markets.
In light of ongoing improvements in the functioning of financial markets, the Committee and the Board of Governors anticipate that most of the Federal Reserve’s special liquidity facilities will expire on February 1, 2010, consistent with the Federal Reserve’s announcement of June 25, 2009. These facilities include the Asset-Backed Commercial Paper Money Market Mutual Fund Liquidity Facility, the Commercial Paper Funding Facility, the Primary Dealer Credit Facility, and the Term Securities Lending Facility. The Federal Reserve will also be working with its central bank counterparties to close its temporary liquidity swap arrangements by February 1. The Federal Reserve expects that amounts provided under the Term Auction Facility will continue to be scaled back in early 2010. The anticipated expiration dates for the Term Asset-Backed Securities Loan Facility remain set at June 30, 2010, for loans backed by new-issue commercial mortgage-backed securities and March 31, 2010, for loans backed by all other types of collateral. The Federal Reserve is prepared to modify these plans if necessary to support financial stability and economic growth.
Voting for the FOMC monetary policy action were: Ben S. Bernanke, Chairman; William C. Dudley, Vice Chairman; Elizabeth A. Duke; Charles L. Evans; Donald L. Kohn; Jeffrey M. Lacker; Dennis P. Lockhart; Daniel K. Tarullo; Kevin M. Warsh; and Janet L. Yellen.
Housing Starts - 8:30
Full report here
NEW RESIDENTIAL CONSTRUCTION IN NOVEMBER 2009
The U.S. Census Bureau and the Department of Housing and Urban Development jointly announced the following new residential construction statistics for November 2009:
BUILDING PERMITS
Privately-owned housing units authorized by building permits in November were at a seasonally adjusted annual rate of 584,000. This is 6.0 percent (±1.6%) above the revised October rate of 551,000, but is 7.3 percent (±1.8%) below the November 2008 estimate of 630,000. Single-family authorizations in November were at a rate of 473,000; this is 5.3 percent (±1.1%) above the revised October figure of 449,000. Authorizations of units in buildings with five units or more were at a rate of 86,000 in November.
HOUSING STARTS
Privately-owned housing starts in November were at a seasonally adjusted annual rate of 574,000. This is 8.9 percent (±10.2%)* above the revised October estimate of 527,000, but is 12.4 percent (±9.1%) below the November 2008 rate of 655,000.
Single-family housing starts in November were at a rate of 482,000; this is 2.1 percent (±9.2%)* above the revised October figure of 472,000. The November rate for units in buildings with five units or more was 83,000.
HOUSING COMPLETIONS
Privately-owned housing completions in November were at a seasonally adjusted annual rate of 810,000. This is 8.7 percent (±13.7%)* above the revised October estimate of 745,000, but is 25.3 percent (±10.1%) below the November 2008 rate of 1,084,000.
Single-family housing completions in November were at a rate of 524,000; this is unchanged (±11.7%)*compared with the revised October figure. The November rate for units in buildings with five units or more was 270,000.
CPI - 8:30
Full report here
Consumer Price Index - November 2009
On a seasonally adjusted basis, the Consumer Price Index for All
Urban Consumers (CPI-U) rose 0.4 percent in November, the U.S. Bureau
of Labor Statistics reported today. Over the last 12 months the index
increased 1.8 percent before seasonal adjustment, the first positive
12-month change since February 2009.
The seasonally adjusted increase in the all items index was due to a
4.1 percent increase in the energy index. The index for gasoline rose
sharply and the indexes for electricity, fuel oil, and natural gas
also increased, creating the fourth consecutive rise in the energy
index and the largest increase since August. In contrast, the index
for all items less food and energy was unchanged in November, after
ten consecutive monthly increases. Declines in shelter indexes offset
increases in the indexes for new and used motor vehicles, medical
care, airline fares, and tobacco.
The food index rose slightly in November. As in October, the food
away from home index rose modestly while the index for food at home
was unchanged. Within the latter, three grocery store food groups
posted increases while three declined.
More at link with formatted tables
Pre-market - 8:15
Futures up a little on who knows what.
DJIA INDEX 10,437.00 39.00
S&P 500 1,109.30 5.40
NASDAQ 100 1,805.50 10.50
Today's economic calendar:
MBA Purchase Applications 7:00 AM ET
Consumer Price Index 8:30 AM ET
Housing Starts 8:30 AM ET
Current Account 8:30 AM ET
EIA Petroleum Status Report 10:30 AM ET
FOMC Meeting Announcement 2:15 PM ET
Today's earnings reports.
Before open:
JOYG Joy Global, Inc. Industrial Goods Farm & Construction Machinery
After close:
ABM ABM Industries Inc. Services Business Services
APOG Apogee Enterprises Inc. Industrial Goods General Building Materials
HOV Hovnanian Enterprises Inc. Industrial Goods Residential Construction
MATK Martek Biosciences Corp. Healthcare Biotechnology
MLHR Herman Miller Inc. Consumer Goods Business Equipment
NDSN Nordson Corp. Industrial Goods Diversified Machinery
OHB Orleans Homebuilders Inc. Industrial Goods Residential Construction
PAYX Paychex Inc. Services Staffing & Outsourcing Services
Tuesday, December 15, 2009
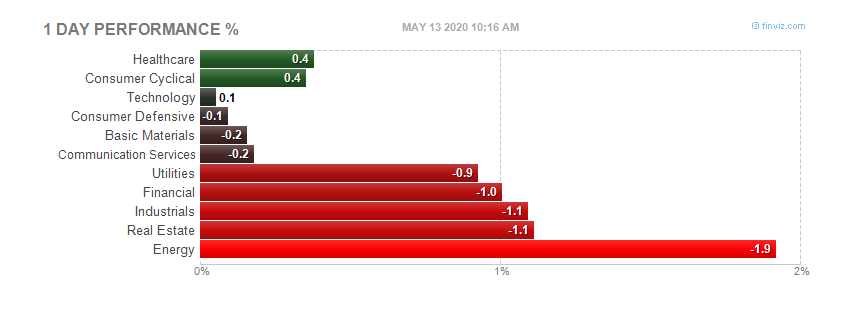
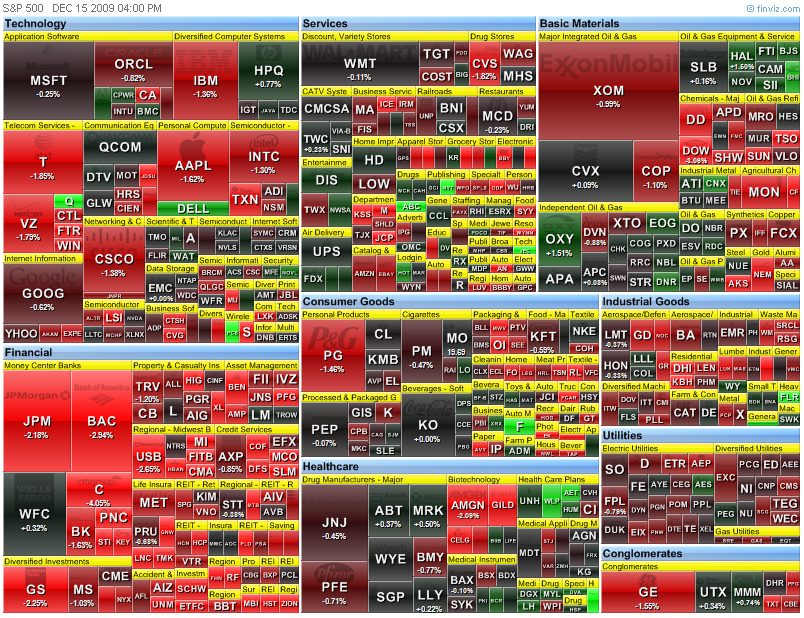
Market wrap - 4:15
Some bad data and a market that is probably too overbought gave back a little today.
Dow 10,452 -49 -0.47%
Nasdaq 2,201 -11 -0.49%
S&P 500 1,108 -6 -0.56%
GlobalDow 1,966 -12 -0.59%
Gold 1,123 -1 -0.10%
Oil 70.71 +1.20 +1.73%


Jim Chanos and Melissa Lee - CNBC - funny interview IMHO - 2:10
As hard as Melissa Lee tries to get Jim Chanos to give a buy, buy, buy on anything, he won't. I get a kick out of her pumping bank stocks, he disagrees, but she pumps them anyway. Get this woman off TV.
More from Dylan Ratigan on the banks and lending - 1:45
Visit msnbc.com for breaking news, world news, and news about the economy

Dylan Ratigan on the banks - 1:30
Visit msnbc.com for breaking news, world news, and news about the economy
Housing market index report - 1:00
Full report here
Builder Confidence Edges Down in December
December 15, 2009 - Builder confidence in the market for newly built, single-family homes receded one point to 16 in December as continued weakness in the economy and job markets weighed on consumers’ potential home buying plans, according to the latest NAHB/Wells Fargo Housing Market Index (HMI), released today.
“From an affordability standpoint, rarely has there been a better time in history to purchase a home, thanks to record low interest rates, attractive prices, and of course the recent extension and expansion of the home buyer tax credit,” said Joe Robson, Chairman of the National Association of Home Builders (NAHB) and a home builder from Tulsa, Okla. “However, builders are not seeing the full impact of these conditions on buyer demand, partly because awareness of the latest incentives is still building, and partly because of concerns about job security and other economic woes.”
“As we anticipated, this is shaping up to be a bumpy recovery period for the housing market,” noted NAHB Chief Economist David Crowe. “While some families may be just starting to factor the expanded tax credit into their potential home buying plans, many are hesitating because of the poor economy. At the same time, tight lending conditions for both consumers and home builders continue to pose considerable obstacles on the road to a sustained housing and economic recovery.”
Derived from a monthly survey that NAHB has been conducting for more than 20 years, the NAHB/Wells Fargo Housing Market Index gauges builder perceptions of current single-family home sales and sales expectations for the next six months as “good,” “fair” or “poor.” The survey also asks builders to rate traffic of prospective buyers as “high to very high,” “average” or “low to very low.” Scores for each component are then used to calculate a seasonally adjusted index where any number over 50 indicates that more builders view sales conditions as good than poor.
The December HMI fell one point to 16, its lowest point since June of this year. Two out of three component indexes also were down, with a one-point decline to 16 registered for current sales conditions and a two-point decline to 26 registered for sales expectations in the next six months. The component gauging traffic of prospective buyers remained unchanged for a third consecutive month, at 13.
Regionally, December’s HMI results were somewhat mixed. The Northeast posted a three point gain to 23, while the West posted a one-point gain to 19, the South registered no change at 17, and the Midwest posted a two-point decline, to 12.
Editor’s Note: The NAHB/Wells Fargo Housing Market Index is strictly the product of NAHB Economics, and is not seen or influenced by any outside party prior to being released to the public. HMI tables can be accessed online at: www.nahb.org/hmi. More information on housing statistics is also available at: www.housingeconomics.com.
Industrial Production - 9:15
Full report here
INDUSTRIAL PRODUCTION AND CAPACITY UTILIZATION
Industrial production increased 0.8 percent in November after having been unchanged in October. Manufacturing production advanced 1.1 percent, with broad-based gains among both durables and nondurables. The output of mines climbed 2.1 percent, but the index for utilities fell 1.8 percent, primarily as a result of lower output of gas utilities--temperatures in November were unseasonably mild and reduced the need for heating. At 99.4 percent of its 2002 average, total industrial production was 5.1 percent below its level of a year earlier. Capacity utilization for total industry moved up 0.7 percentage point to 71.3 percent, a rate 9.6 percentage points below its average for the period from 1972 through 2008.
See link for formatted tables
Empire State Manufacturing Survey - 8:30
 Full report here
The Empire State Manufacturing Survey indicates that conditions for New York manufacturers leveled off in December, following four months of improvement. The general business conditions index fell 21 points, to 2.6. The indexes for new orders and shipments posted somewhat more moderate declines but also moved close to zero. Input prices picked up a bit, as the prices paid index rebounded to roughly its November level; however, the prices received index moved further into negative territory, suggesting that price increases are not being passed along. Current employment indexes slipped back into negative territory. Future indexes remained well above zero but signaled somewhat less widespread optimism than in recent months. Indexes for expected prices paid and received declined moderately but remained well above zero.
In a series of supplementary questions (see Supplemental Reports tab), manufacturers were asked about recent and expected changes in the prices paid for various categories of goods and services. Respondents predicted that prices paid for most budget categories would increase by 2 to 3 percentage points more in 2010 than in 2009. Prices paid overall were reported to have risen by 2.5 percent in 2009 and were expected to rise by 4.2 percent next year. The average respondent anticipated an increase of 2.1 percent in both wages and costs of outside services, 7.6 percent in employee benefit costs, and 3.5 percent in nonmedical insurance costs. In response to a separate question, the average respondent saw a roughly 7 percent chance that prices paid would decline by more than 2 percent; in last year’s survey, the probability of such a decline was pegged at 19 percent.
Conditions Level Off
The general business conditions index fell from 23.5 to just 2.6, suggesting a leveling off in conditions after four straight months of improvement. Roughly 24 percent of those surveyed in December said that conditions had improved, while 22 percent reported that conditions had deteriorated. Most of the other specific activity measures fell a bit less sharply: the new orders index slipped more than 14 points to 2.2, and the shipments measure declined by just under 7 points to 6.3. The unfilled orders index fell by more than 18 points to -21.1, its lowest level in nine months. In contrast, the index for delivery times held steady at -2.6, and the inventories index, at -18.4, was little changed for the third straight month.
Manufacturers See Margins Squeezed Survey respondents faced somewhat higher input prices in December, while their selling prices declined. The prices paid index rose 9 points to 19.7, reversing a drop of similar magnitude in November and suggesting some renewed price pressures. At the same time, the prices received index slipped 6.6 points to -9.2, its lowest level since August. Employment indexes declined for the second straight month, falling below zero for the first time in a few months: the index for number of employees slipped 7 points to -5.3, and the average workweek index fell 11 points to -5.3.
Manufacturers’ Optimism Ebbs Slightly; Prices Are Expected to Rise
Manufacturers remained generally optimistic about the outlook for general business conditions and activity, although a bit less so than in recent months. After rising to its highest level in more than a year, the index for expected general business conditions retreated 14 points to 43.0—still a high level but the lowest since July. The forward-looking indexes for both new orders and shipments fell by almost as much but remained in the upper 30s, while the future unfilled orders index declined by a more moderate 5 points to 12.0. The index for expected delivery times edged up to zero, its highest level in more than a year, and the measure for future inventories was unchanged at 7.9.
Forward-looking price indexes declined in December, after rising sharply in the preceding month: the index for future prices paid slipped nearly 8 points to 40.8, and the index for future prices received dropped about 5 points to 22.4. The index for expected number of employees reversed course in December, retreating 13 points to 17.8, while the future average workweek index was little changed at 19.7. The measure for planned capital expenditures jumped more than 9 points to 30.3, its highest level since May 2007; however, the measure for planned technology spending edged down to 13.2.
Full report here
The Empire State Manufacturing Survey indicates that conditions for New York manufacturers leveled off in December, following four months of improvement. The general business conditions index fell 21 points, to 2.6. The indexes for new orders and shipments posted somewhat more moderate declines but also moved close to zero. Input prices picked up a bit, as the prices paid index rebounded to roughly its November level; however, the prices received index moved further into negative territory, suggesting that price increases are not being passed along. Current employment indexes slipped back into negative territory. Future indexes remained well above zero but signaled somewhat less widespread optimism than in recent months. Indexes for expected prices paid and received declined moderately but remained well above zero.
In a series of supplementary questions (see Supplemental Reports tab), manufacturers were asked about recent and expected changes in the prices paid for various categories of goods and services. Respondents predicted that prices paid for most budget categories would increase by 2 to 3 percentage points more in 2010 than in 2009. Prices paid overall were reported to have risen by 2.5 percent in 2009 and were expected to rise by 4.2 percent next year. The average respondent anticipated an increase of 2.1 percent in both wages and costs of outside services, 7.6 percent in employee benefit costs, and 3.5 percent in nonmedical insurance costs. In response to a separate question, the average respondent saw a roughly 7 percent chance that prices paid would decline by more than 2 percent; in last year’s survey, the probability of such a decline was pegged at 19 percent.
Conditions Level Off
The general business conditions index fell from 23.5 to just 2.6, suggesting a leveling off in conditions after four straight months of improvement. Roughly 24 percent of those surveyed in December said that conditions had improved, while 22 percent reported that conditions had deteriorated. Most of the other specific activity measures fell a bit less sharply: the new orders index slipped more than 14 points to 2.2, and the shipments measure declined by just under 7 points to 6.3. The unfilled orders index fell by more than 18 points to -21.1, its lowest level in nine months. In contrast, the index for delivery times held steady at -2.6, and the inventories index, at -18.4, was little changed for the third straight month.
Manufacturers See Margins Squeezed Survey respondents faced somewhat higher input prices in December, while their selling prices declined. The prices paid index rose 9 points to 19.7, reversing a drop of similar magnitude in November and suggesting some renewed price pressures. At the same time, the prices received index slipped 6.6 points to -9.2, its lowest level since August. Employment indexes declined for the second straight month, falling below zero for the first time in a few months: the index for number of employees slipped 7 points to -5.3, and the average workweek index fell 11 points to -5.3.
Manufacturers’ Optimism Ebbs Slightly; Prices Are Expected to Rise
Manufacturers remained generally optimistic about the outlook for general business conditions and activity, although a bit less so than in recent months. After rising to its highest level in more than a year, the index for expected general business conditions retreated 14 points to 43.0—still a high level but the lowest since July. The forward-looking indexes for both new orders and shipments fell by almost as much but remained in the upper 30s, while the future unfilled orders index declined by a more moderate 5 points to 12.0. The index for expected delivery times edged up to zero, its highest level in more than a year, and the measure for future inventories was unchanged at 7.9.
Forward-looking price indexes declined in December, after rising sharply in the preceding month: the index for future prices paid slipped nearly 8 points to 40.8, and the index for future prices received dropped about 5 points to 22.4. The index for expected number of employees reversed course in December, retreating 13 points to 17.8, while the future average workweek index was little changed at 19.7. The measure for planned capital expenditures jumped more than 9 points to 30.3, its highest level since May 2007; however, the measure for planned technology spending edged down to 13.2.
PPI - 8:30
Full report here
PRODUCER PRICE INDEXES - NOVEMBER 2009
The Producer Price Index for Finished Goods rose 1.8 percent in November, seasonally adjusted, the U.S. Bureau of Labor Statistics reported today. This increase followed a 0.3-percent advance in October and a 0.6-percent decrease in September. In November, at the earlier stages of processing, prices received by manufacturers of intermediate goods climbed 1.4 percent, and the crude goods index rose 5.7 percent. On an unadjusted basis, prices for finished goods moved up 2.4 percent for the 12 months ended November 2009, their first 12-month increase since November 2008. (See table A.)
SEE TABLE A AT LINK
Stage-of-Processing Analysis
Finished goods
About three-fourths of the November advance in the finished goods index can be traced to higher prices for energy goods, which jumped 6.9 percent. The indexes for finished goods less foods and energy and for finished consumer foods also contributed to the finished goods increase, both rising 0.5 percent.
Finished energy: The index for finished energy goods climbed 6.9 percent in November after advancing 1.6 percent a month earlier. About sixty percent of the broad-based November rise can be attributed to a 14.2-percent surge in gasoline prices. Increases in the indexes for liquefied petroleum gas and home heating oil also were major factors in the finished energy goods
advance. (See table 2.)
Finished core: The index for finished goods less foods and energy moved up 0.5 percent in November, its largest increase since a 0.5-percent gain in October 2008. Leading the November advance, the index for light motor trucks jumped 4.2 percent. Higher cigarette prices also contributed to the rise in the finished core index.
Finished foods: The index for finished consumer foods advanced 0.5 percent in November, its second consecutive monthly increase. Over sixty percent of the November rise can be traced to higher prices for fresh and dry vegetables, which climbed 8.7 percent.
Intermediate goods
The Producer Price Index for Intermediate Materials, Supplies, and Components rose 1.4 percent in November, its fourth straight monthly advance. Accounting for about three-fourths of the broad-based November increase, prices for intermediate energy goods climbed 5.4 percent. The indexes for both intermediate goods less foods and energy and for intermediate foods and feeds also contributed to this advance, rising 0.3 and 0.7 percent, respectively. On a 12-month basis, prices for intermediate goods fell 1.6 percent in November. This is the fourth consecutive month of slowing year-over-year declines following a record 15.2-percent drop for the 12 months ended
July 2009. (See table B.)
Intermediate energy: The index for intermediate energy goods rose 5.4 percent in November, its second consecutive monthly increase. A major factor in the November advance was an 18.8-percent surge in jet fuel prices. The indexes for gasoline and liquefied petroleum gas also contributed significantly to higher intermediate energy goods prices. (See table 2).
Intermediate core: Prices for intermediate materials less foods and energy increased 0.3 percent in November, their fifth increase in the last six months. The index for basic organic chemicals led the November advance, rising 4.3 percent. Higher prices for medicinal and botanical chemicals also were a factor in the intermediate core increase.
Intermediate foods: The index for intermediate foods and feeds moved up 0.7 percent in November following two consecutive monthly declines. About forty percent of this advance can be attributed to prices for pork, which climbed 6.4 percent.
Crude goods
The Producer Price Index for Crude Materials for Further Processing increased 5.7 percent in November. For the 3-month period ending in November, crude material prices rose 9.1 percent after advancing 4.4 percent in the 3 months ending in August. In November, monthly increases of 12.2 percent in the index for crude energy materials and 2.6 percent for prices of crude foodstuffs and feedstuffs outweighed a 0.8-percent decrease in the index for crude nonfood materials less energy. (See table B.)
Crude energy: The index for crude energy materials increased 12.2 percent in November. From August to November, this index rose 15.0 percent compared with a 12.6-percent rise in the 3 months ending in August. Accounting for about two-thirds of the monthly November increase, the index for natural gas jumped 25.5 percent. Higher prices for both crude petroleum and coal also contributed to the advance in the crude energy materials index. (See table 2.)
Crude foods: Prices for crude foodstuffs and feedstuffs rose 2.6 percent in November. This index moved up 5.8 percent in the most recent 3-month period compared with a 7.1-percent decline in the previous 3-month period. In November, over sixty percent of the monthly increase in the crude foods index can be attributed to a 25.6-percent surge in prices for slaughter hogs. An advance in the fluid milk index also was a significant factor in the rise for crude foodstuffs and
feedstuffs.
SEE TABLE B AT LINK
Services Analysis
Trade industries: The Producer Price Index for the Net Output of Total Trade Industries moved up 1.3 percent in November after no change in the previous month. (Trade indexes measure changes in margins received by wholesalers and retailers.) The November increase was led by a 36.5-percent rise in the margin index for gasoline stations. Higher margins received by merchant wholesalers of durable goods and general merchandise stores also contributed to the advance in the total trade industries index.
Transportation and warehousing industries: The Producer Price Index for the Net Output of Total Transportation and Warehousing Industries rose 0.5 percent in November, its second consecutive monthly increase. About seventy percent of the November advance can be traced to a 1.8-percent rise in prices received by the air transportation industry group. The indexes for long-distance general freight trucking (by the truckload) and specialized freight trucking also moved
up in November.
Traditional service industries: The Producer Price Index for the Net Output of Total Traditional Service Industries declined 0.1 percent in November after advancing 0.5 percent in October. Two-thirds of this decline can be attributed to prices received by general and medical surgical hospitals, which fell 0.5 percent. The industry indexes for non-casino hotels and motels and for passenger car rental also decreased in November.
See link for formatted tables
Pre-market - 7:50
Futures down slightly on a stronger dollar index.
DJIA INDEX 10,410.00 -27.00
S&P 500 1,105.30 -3.30
NASDAQ 100 1,802.50 -5.25
Today's economic calendar:
FOMC Meeting Begins
ICSC-Goldman Store Sales 7:45 AM ET
Producer Price Index 8:30 AM ET
Empire State Mfg Survey 8:30 AM ET
Redbook 8:55 AM ET
Treasury International Capital 9:00 AM ET
Industrial Production 9:15 AM ET
4-Week Bill Auction 11:30 AM ET
52-Week Bill Auction 11:30 AM ET
Housing Market Index 1:00 PM ET
Today's earnings reports
Before open:
AEY ADDvantage Technologies Group Inc. Services Electronics Wholesale
BBY Best Buy Co. Inc. Services Electronics Stores
FDS FactSet Research Systems Inc. Technology Information & Delivery Services
GIGM GigaMedia Ltd. Technology Internet Software & Services
GS Goldman Sachs Group Inc. Financial Diversified Investments
After close:
ADBE Adobe Systems Inc. Technology Application Software
AIR AAR Corp. Industrial Goods Aerospace/Defense Products & Services
CLC CLARCOR Inc. Consumer Goods Auto Parts
HRAY Hurray! Holding Co. Ltd. Technology Business Software & Services
SURG Synergetics USA, Inc. Healthcare Medical Appliances & Equipment
WPCS WPCS International Incorporated Technology Diversified Communication Services
Monday, December 14, 2009
Market wrap - 4:15
Just another day of pumping junk stocks to make the indexes go up.
Dow 10,501 30 0.28%
Nasdaq 2,212 22 0.99%
S&P 500 1,114 8 0.70%
GlobalDow 1,978 +14 +0.74%
Gold 1,124 +4 +0.35%
Oil 69.68 -0.19 -0.27%


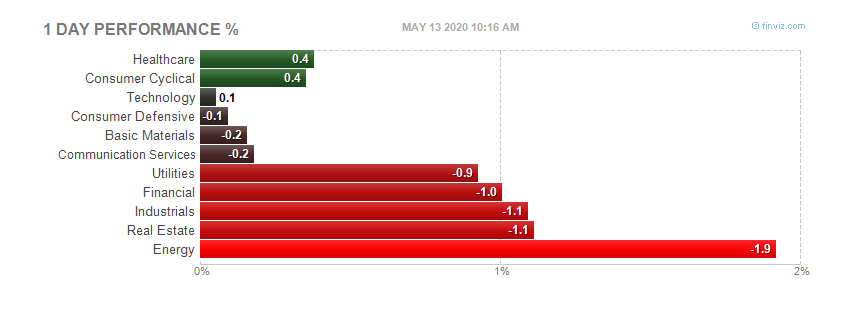
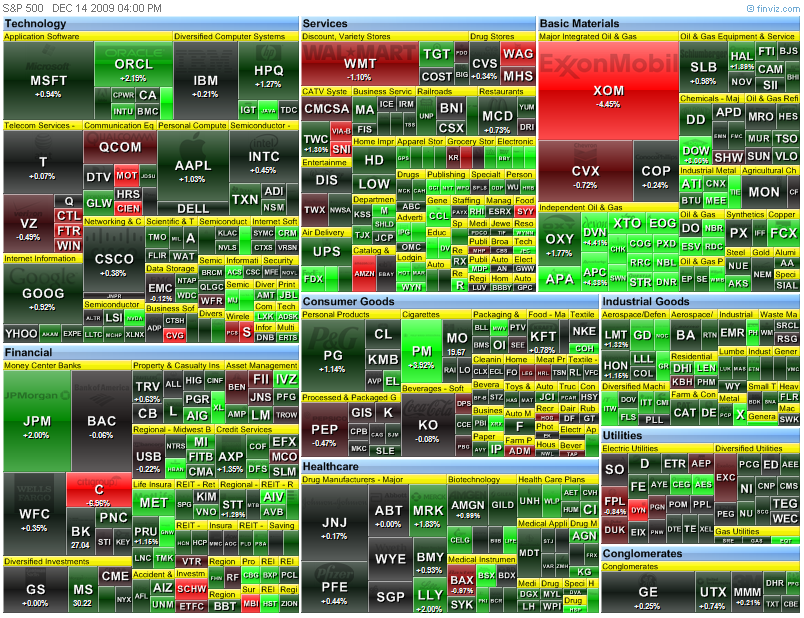
Pre-market - December 14, 2009
Futures up on the news Abu Dhabi will bail out Dubai.
DJIA INDEX 10,461.00 38.00
S&P 500 1,107.50 4.30
NASDAQ 100 1,799.50 7.50
Today's economic calendar:
4-Week Bill Announcement 11:00 AM ET
3-Month Bill Auction 11:30 AM ET
6-Month Bill Auction 11:30 AM ET
Today's earnings reports:
Before open:
NTSC National Technical Systems Inc. Services Research Services
After close:
ALCO Alico Inc. Consumer Goods Farm Products
ANGN Angeion Corp. Healthcare Medical Instruments & Supplies
BRT BRT Realty Trust Financial Mortgage Investment
IAAC International Assets Holding Corporation Financial Asset Management
IESC Integrated Electrical Services, Inc. Industrial Goods General Contractors
PAY VeriFone Holdings, Inc. Consumer Goods Business Equipment
SEH Spartech Corp. Consumer Goods Rubber & Plastics
SNS Steak n Shake Co. Services Restaurants
Friday, December 11, 2009
Market wrap - 4:15
Another boorrrriiinnnggg day in the market. Really didn't do much. DOW up nicely but the other indexes were flat. Ho friken hum.
Dow 10,472 66 0.63%
Nasdaq 2,190 -1 -0.03%
S&P 500 1,106 4 0.37%
Gold 1,120 -7 -0.59%
Oil 69.79 -0.67 -0.95%


Subscribe to:
Posts (Atom)

