Wednesday, September 23, 2009
Pre-market - Wednesday, September 23, 2009
Futures up slightly this morning:
DJIA INDEX 9,786.00 15.00
S&P 500 1,069.40 2.10
NASDAQ 100 1,738.75 4.50
Today's economic reports:
MBA Purchase Applications 7:00 AM ET
EIA Petroleum Status Report 10:30 AM ET
5-Yr Note Auction 1:00 PM ET
FOMC Meeting Announcement 2:15 PM ET
Today's earnings reports:
Before open:
AZO AutoZone Inc. Services Auto Parts Stores
GIS General Mills Inc. Consumer Goods Processed & Packaged Goods
After close:
BBBY Bed Bath & Beyond, Inc. Services Home Furnishing Stores
CMTL Comtech Telecommunications Corp. Technology Communication Equipment
CPRT Copart Inc. Services Auto Dealerships
CTAS Cintas Corp. Services Business Services
OHB Orleans Homebuilders Inc. Industrial Goods Residential Construction
PAYX Paychex Inc. Services Staffing & Outsourcing Services
RHT Red Hat Inc. Technology Application Software


Market wrap for Tuesday, September 22, 2009
Dow /quotes/comstock/10w!i:dji/delayed 9,830 51 0.52%
Nasdaq/quotes/comstock/10y!i:comp 2,146 8 0.39%
S&P 500/quotes/comstock/21z!i1:in\x 1,072 7 0.66%
Today by sector:
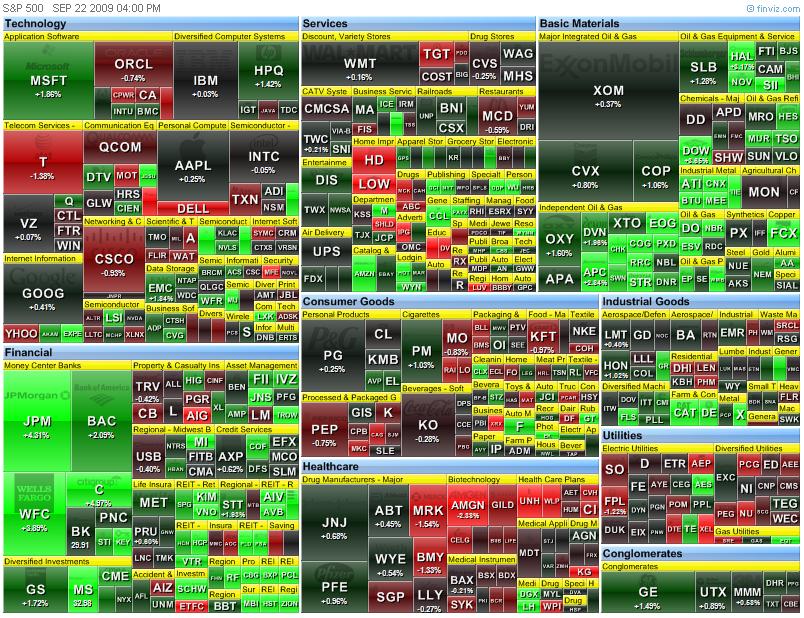
 Today's heatmap:

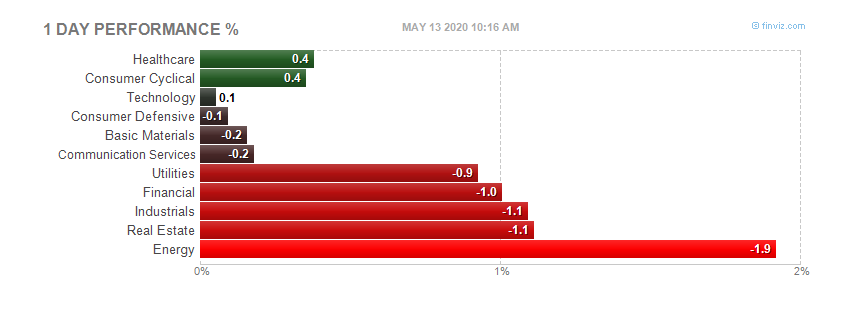 Today's heatmap:
Tuesday, September 22, 2009
Pre-market - Tuesday, September 22, 2009
Futures up this morning
DJIA INDEX 9,783.00 65.00
S&P 500 1,067.90 7.50
NASDAQ 100 1,738.75 11.00
Today's economic calendar:
ICSC-Goldman Store Sales 7:45 AM ET
Redbook 8:55 AM ET
4-Week Bill Auction 11:30 AM ET
52-Week Bill Auction 11:30 AM ET
2-Yr Note Auction 1:00 PM ET
Today's earnings reports:
Before open:
CAG ConAgra Foods, Inc. Consumer Goods Processed & Packaged Goods
CCL Carnival Corp. Services General Entertainment
FDS FactSet Research Systems Inc. Technology Information & Delivery Services
GIGM GigaMedia Ltd. Technology Internet Software & Services
KMX CarMax Inc. Services Auto Dealerships
PRGS Progress Software Corp. Technology Application Software
RAIL FreightCar America Inc. Services Railroads
VSR Versar Inc. Services Technical Services
Today after close:
AIR AAR Corp. Industrial Goods Aerospace/Defense Products & Services
FIF Financial Federal Corp. Financial Credit Services
FUL HB Fuller Co. Basic Materials Specialty Chemicals
Market wrap - a day late - Tuesday, September 22, 2009
The results from yesterday:
Dow 9,779 -41 -0.42%
Nasdaq 2,138 5 0.24%
S&P 500 1,065 -4 -0.34%
Gold 1,005 -5 -0.53%
Oil 70.75 +1.04 +1.49%
Today by sector:
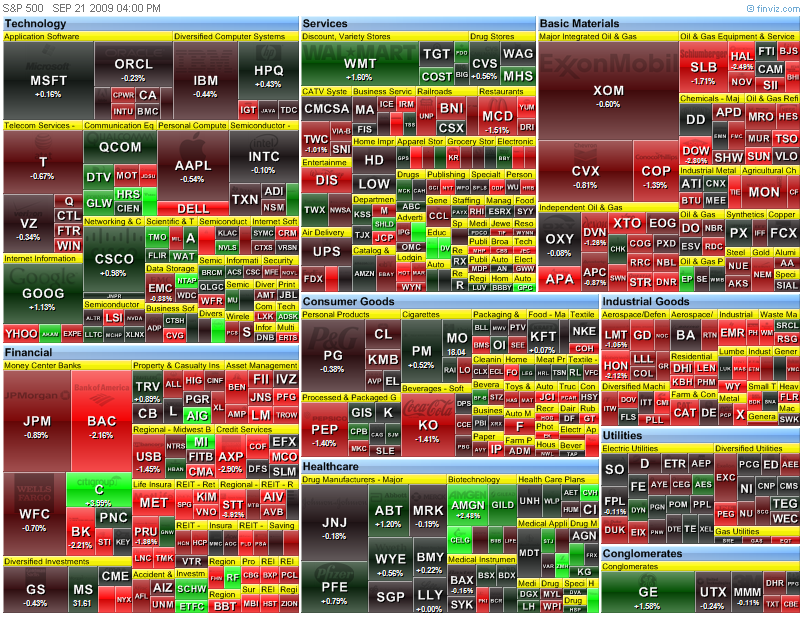
 Today's heatmap:

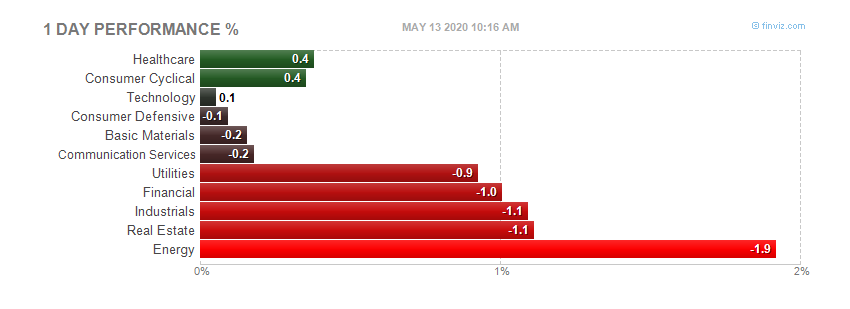 Today's heatmap:
Monday, September 21, 2009
Leading Indicators - 10:00am
Full report here
Released: Monday, September 21, 2009
The Conference Board Leading Economic Index™ (LEI) for the U.S. increased 0.6 percent in August, following a 0.9 percent gain in July, and a 0.8 percent rise in June.
Download a PDF of the technical notes for underlying detail, diffusion indexes, components, contributions and graphs.
Download a PDF of the press release with graph and summary table.
"Since reaching a peak in July 2007, the LEI fell for twenty months – the longest downtrend since the mid 1970s – but it has been rising since April and its gains have become very widespread," says Ataman Ozyildirim, Economist at The Conference Board. "The six-month growth rate of the LEI continues to accelerate. At the same time, the downtrend in the coincident economic index, measuring current economic activity, seems to be stabilizing, with the index flat so far this quarter."
Says Ken Goldstein, Economist at The Conference Board: "The LEI has risen for five consecutive months and the coincident economic index has stopped falling. Taken together, this suggests that the recession is bottoming out. These numbers are consistent with the view that after a very severe downturn, a recovery is very near. But, the intensity and pattern of that recovery is more uncertain."
The Conference Board Coincident Economic Index™ (CEI) for the U.S. was unchanged in August, following a 0.1 percent increase in July, and a 0.4 percent decline in June. The Conference Board Lagging Economic Index™ (LAG) declined 0.1 percent in August, following a 0.5 percent decline in July, and a 0.9 percent decline in June.
The next release is scheduled for Thursday, October 22, 2009 at 10 A.M. ET.
Professional Contacts at The Conference Board:
Ken Goldstein: 212-339-0331
Indicators Program: 212-339-0330
Media Contacts:
Frank Tortorici: +1 212 339 0231
Email:
indicators@conference-board.org
Pre-market - Monday, Septmember 21,2009
Futures pointing to the downside this morning:
DJIA INDEX 9,696.00 -37.00
S&P 500 1,055.80 -5.20
NASDAQ 100 1,713.25 -8.00
Today's economic calendar:
Leading Indicators 10:00 AM ET
4-Week Bill Announcement 11:00 AM ET
3-Month Bill Auction 1:00 PM ET
6-Month Bill Auction 1:00 PM ET
Today's earnings reports:
Before open = LEN Business Services
After close = SNX Business Services
Friday, September 18, 2009
Market wrap - 5:15
Another up day for this rocket of a market
Dow/quotes 9,820 36 0.37%
Nasdaq 2,133 6 0.29%
S&P 500 1,068 3 0.26%
Gold 1,010 -3 -0.32%
Oil 71.78 -0.43 -0.59%
Today by sector:
 Today's heatmap:

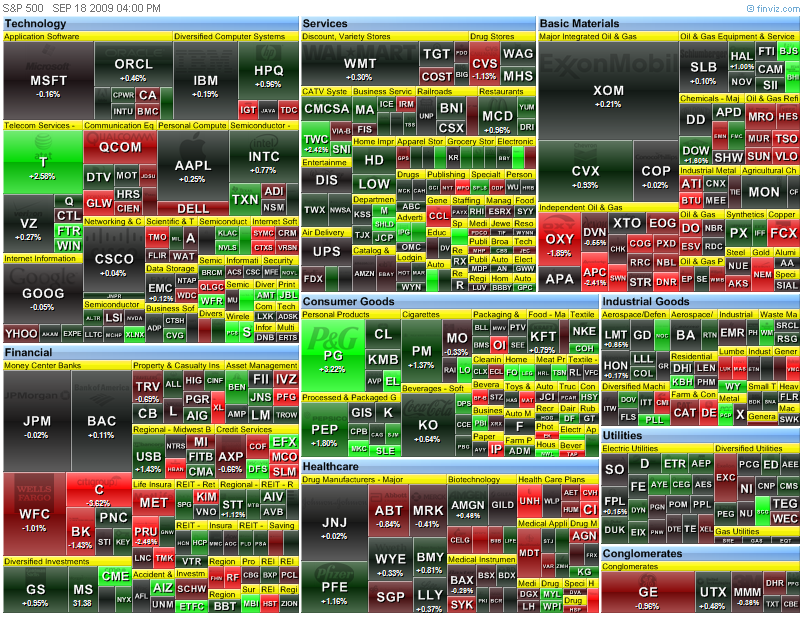
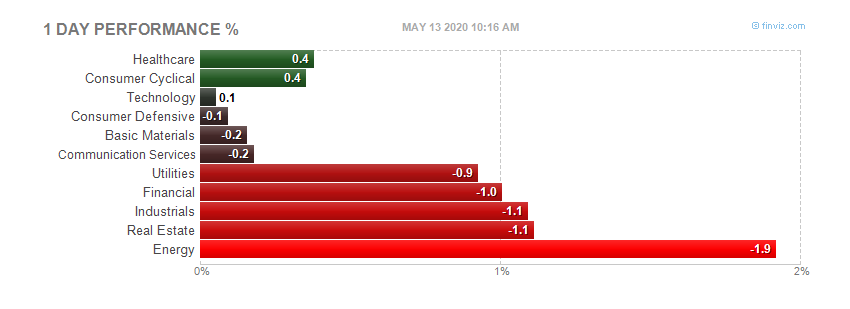 Today's heatmap:
FHA running out of money?
Hate to link to a CNBC article, but couldn't find it elsewhere.
FHA Cash Reserves to Fall Below Required Levels
HOUSING, REAL ESTATE, FHA, FEDERAL HOUSING ADMINISTRATION
Posted By: Jeff Cox | CNBC.com
CNBC.com
| 18 Sep 2009 | 09:32 AM ET
Pressure from loan defaults has pushed cash reserves at the Federal Housing Administration below mandated minimum levels, but the agency's head says taxpayers won't be asked to make up the difference.
Instead, the agency is moving is pressing ahead with policy changes aimed at reducing its exposure to risk as the FHA coffers have been hit by staggering losses from defaults and fraud.
Borrowers will be required to have higher credit scores, though the agency did not release details of what the heightened credit requirements will be.
Among the other significant changes are a raise in cash reserve requirements for lenders that handle FHA loans. The current standards call for $250,000 but will be raised by $1 million and possibly more in the future.
In addition, the agency will appoint for the first time a risk compliance officer who will be responsible for overseeing risk of the insurance fund. FHA is establishing new credit rules to verify income and credit history as well in order to minimize defaults in the future.
"Given the size and scope of the FHA and its importance to today’s market, these risk management and credit policy changes are important steps in strengthening the FHA fund, by ensuring that lenders have proper and sufficient protections," Commissioner David Stevens said in a statement.
Another change likely to gain attention is FHA's moves to "assure appraiser independence." A similar move by government-sponsored enterprises Fannie Mae and Freddie Mac have drawn widespread criticism in the industry for holding up modifications to distressed loans.
The FHA has never used taxpayer money to cover losses from its borrowing program, but has been hit hard by the rash of defaults that have plagued the industry. Part of the formula for making up the drop in reserves is likely to entail addressing fraudulent loans that contributed to the FHA's losses.
The agency is amid preparing its actuarial study that will be submitted to Congress in November.
Stevens said the agency has sufficient funds to cover its losses even without the proposed changes. But the new regulations and the appointment of the risk officer will help prevent similar problems from happening in the future, he said.
FHA has about $30 billion in reserves, representing 4.4 percent of the loans it insures. The agency is a key backer for first-time homeowners and is now insuring about 5.3 million mortgages, compared to 4 million three years ago.
Pre-market - September 18, 2009
Futures flat on this quadruple witching Friday
DJIA INDEX 9,743.00 6.00
S&P 500 1,063.80 1.00
NASDAQ 100 1,722.00 2.00
Today's economic calenedar: Nothing of note
Today's earnings reports:
Before open: None
After close:
FMCN Focus Media Holding Ltd. Services Advertising Agencies
Thursday, September 17, 2009
Market wrap - 4:15pm
The market got some good news today, and got some bad news. Once you drilled into the Philly FED report, you would find some NOT so green shoots.
Dow 9,784 -8 -0.08%
Nasdaq 2,127 -6 -0.30%
S&P 500 1,065 -3 -0.31%
Gold 1,014 -7 -0.66%
Oil 72.50 -0.04 -0.06%
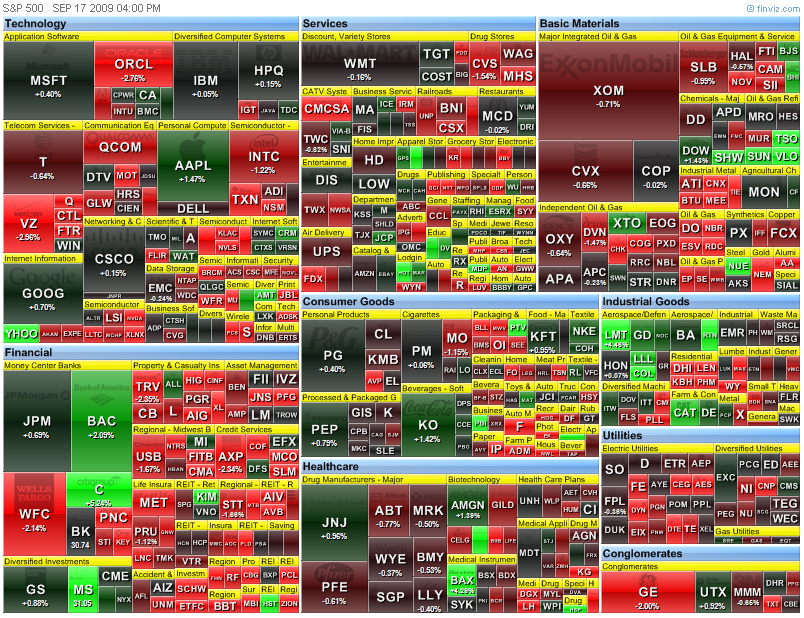
Today by sector:
 Today's heatmap:

 Today's heatmap:
Philly FED survey - 10:00am
Full report here
Read the carefully - please - there is data in here below the headlines that are not so good.
September 2009 Business Outlook Survey
The region's manufacturing sector is showing signs of growth, according to firms polled for this month's Business Outlook Survey. Indexes for general activity, new orders, and shipments all registered positive readings for the second consecutive month. Indexes for employment, work hours, and the prices received for manufactured goods remained negative, suggesting continued weakness. The survey's broad indicators of future activity continued to suggest that the region's manufacturing executives expect business activity to increase over the next six months.
Current Indicators Suggest Modest Growth
The survey's broadest measure of manufacturing conditions, the diffusion index of current activity, increased from 4.2 in August to 14.1 this month. This is the highest reading since June 2007 and the second consecutive positive reading (see Chart). The percentage of firms reporting increases in activity (33 percent) exceeded the percentage reporting decreases (19 percent). Other broad indicators also suggested some growth this month. The current new orders index also remained positive for the second consecutive month, although it edged one point lower, to 3.3. The current shipments index increased eight points and has now increased 18 points over the last two months. Firms reported declines in inventories this month: The current inventory index declined 18 points, from 0.3 in August to -18.1. Indicators for unfilled orders and delivery times remained negative, suggesting continued weakness.
Labor market conditions remain weak, despite signs of improvement in overall activity. The current employment index decreased slightly, from -12.9 to -14.3. Overall declines, however, are still not as widespread as in the first six months of this year. Twenty-four percent of firms reported declines in employment this month; only 10 percent reported employment increases. Although the workweek index remained negative, the index edged two points higher, to -3.9.
Prices of Manufactured Goods Decline
Although more firms have reported higher prices for purchased inputs over the past few months, firms reported overall declines in prices of their manufactured goods this month. The prices paid index increased five points and follows a rise of 14 points last month; the reading of 14.9 for the prices paid index is the highest level since last September. The same manufacturers, however, reported declines in prices for their own final goods. While 17 percent reported price decreases, 6 percent reported increases; nearly 76 percent of the firms reported steady prices this month. The prices received index decreased nine points, to -10.6.
Manufacturers Are Still Optimistic
Indicators of future activity remained near levels not seen since 2004 (see Chart). The future general activity index remained positive for the ninth consecutive month but decreased from 56.8 in August to 47.8. Indexes for future new orders and shipments edged higher this month. The future shipments index increased eight points, and the future new orders index increased four points. For the fifth consecutive month, the percentage of firms expecting employment to increase over the next six months exceeded the percentage expecting declines (34 percent versus 14 percent). Firms' forecast for capital spending suggests that capital spending will be flat over the next six months: The future capital spending index, at 0.8, has remained very near zero for five months.
In this month's special questions, manufacturers were asked about their total production growth for the third quarter (ending in September) and expectations for the fourth quarter (see Special Questions). Twice as many firms expect overall growth in production in the third quarter (48 percent) than expect a decline (24 percent). The average growth was about 1.3 percent for the responding firms. For the upcoming fourth quarter, more firms expect an acceleration in production growth (40 percent) than expect a deceleration (28 percent). However, few firms (only 1 percent) expect significant acceleration in growth in the fourth quarter; most firms characterized the expected acceleration in growth to be some (21percent) or slight (17 percent).
Summary
According to respondents to the September Business Outlook Survey, manufacturing conditions are improving. For the second consecutive month, the survey's indicators for general activity, new orders, and shipments were positive, suggesting business growth. Employment continued to decline among the reporting firms, however. Firms expect conditions to improve over the next six months, and they expect modest growth in the third and fourth quarters of this year.
More at link with formatted tables
Jobless claims - 8:30am
Full report here
UNEMPLOYMENT INSURANCE WEEKLY CLAIMS REPORT
SEASONALLY ADJUSTED DATA
In the week ending Sept. 12, the advance figure for seasonally adjusted initial claims was 545,000, a decrease of 12,000 from the previous week's revised figure of 557,000. The 4-week moving average was 563,000, a decrease of 8,750 from the previous week's revised average of 571,750.
The advance seasonally adjusted insured unemployment rate was 4.7 percent for the week ending Sept. 5, an increase of 0.1 percentage point from the prior week's unrevised rate of 4.6 percent.
The advance number for seasonally adjusted insured unemployment during the week ending Sept. 5 was 6,230,000, an increase of 129,000 from the preceding week's revised level of 6,101,000. The 4-week moving average was 6,180,250, a decrease of 5,500 from the preceding week's revised average of 6,185,750.
The fiscal year-to-date average for seasonally adjusted insured unemployment for all programs is 5.636 million.
UNADJUSTED DATA
The advance number of actual initial claims under state programs, unadjusted, totaled 407,869 in the week ending Sept. 12, a decrease of 58,429 from the previous week. There were 382,249 initial claims in the comparable week in 2008.
The advance unadjusted insured unemployment rate was 4.0 percent during the week ending Sept. 5, a decrease of 0.1 percentage point from the prior week. The advance unadjusted number for persons claiming UI benefits in state programs totaled 5,270,688, a decrease of 165,485 from the preceding week. A year earlier, the rate was 2.3 percent and the volume was 3,040,859.
Extended benefits were available in Alabama, Alaska, Arizona, Arkansas, California, Colorado, Connecticut, Delaware, the District of Columbia, Florida, Georgia, Idaho, Illinois, Indiana, Kansas, Kentucky, Maine, Massachusetts, Michigan, Minnesota, Missouri, Nevada, New Hampshire, New Jersey, New York, North Carolina, Ohio, Oregon, Pennsylvania, Puerto Rico, Rhode Island, South Carolina, Tennessee, Texas, Vermont, Virginia, Washington, West Virginia, and Wisconsin during the week ending Aug. 29.
Initial claims for UI benefits by former Federal civilian employees totaled 1,539 in the week ending Sept. 5, an increase of 83 from the prior week. There were 2,195 initial claims by newly discharged veterans, an increase of 42 from the preceding week.
There were 20,414 former Federal civilian employees claiming UI benefits for the week ending Aug. 29, an increase of 699 from the previous week. Newly discharged veterans claiming benefits totaled 30,213, a decrease of 563 from the prior week.
States reported 3,141,485 persons claiming EUC (Emergency Unemployment Compensation) benefits for the week ending Aug. 29, an increase of 21,781 from the prior week. There were 1,525,890 claimants in the comparable week in 2008. EUC weekly claims include both first and second tier activity.
The highest insured unemployment rates in the week ending Aug. 29 were in Puerto Rico (6.8 percent), Oregon (5.7), Pennsylvania (5.7), Nevada (5.5), Michigan (5.2), Connecticut (5.1), New Jersey (5.1), California (5.0), Wisconsin (5.0), North Carolina (4.8), and Rhode Island (4.8).
The largest increases in initial claims for the week ending Sept. 5 were in Washington (+2,620), Pennsylvania (+2,573), Massachusetts(+1,565), North Carolina (+1,332), and Illinois (+1,218), while the largest decreases were in California (-2,751), New York (-2,479), Wisconsin (-1,149), Texas (-809), and New Jersey (-700).
More at link with formatted tables
Housing starts report - 8:30am
Full report here
NEW RESIDENTIAL CONSTRUCTION IN AUGUST 2009
The U.S. Census Bureau and the Department of Housing and Urban Development jointly announced the following new residential construction statistics for July 2009:
BUILDING PERMITS
Privately-owned housing units authorized by building permits in August were at a seasonally adjusted annual rate of 579,000. This is 2.7 percent (±1.2%) above the revised July rate of 564,000, but is 32.4 percent (±1.3%) below the August 2008 estimate of 857,000.
Single-family authorizations in August were at a rate of 462,000; this is 0.2 percent (±1.1%)* below the revised July figure of 463,000. Authorizations of units in buildings with five units or more were at a rate of 98,000 in August.
HOUSING STARTS
Privately-owned housing starts in August were at a seasonally adjusted annual rate of 598,000. This is 1.5 percent (±7.9%)* above the revised July estimate of 589,000, but is 29.6 percent (±6.0%) below the August 2008 rate of 849,000. Single-family housing starts in August were at a rate of 479,000; this is 3.0 percent (±5.7%)* below the revised July figure of 494,000. The August rate for units in buildings with five units or more was 115,000.
HOUSING COMPLETIONS
Privately-owned housing completions in August were at a seasonally adjusted annual rate of 760,000. This is 5.5 percent (±14.0%)* below the revised July estimate of 804,000 and is 25.3 percent (±9.6%) below the August 2008 rate of 1,018,000. Single-family housing completions in August were at a rate of 489,000; this is 1.6 percent (±12.7%)* below the revised July figure of 497,000. The August rate for units in buildings with five units or more was 256,000.
Pre-market - Thursday, September 17, 2009
Futures bright again this morning, waiting on the jobless claims report at 8:30
DJIA INDEX 9,743.00 18.00
S&P 500 1,064.50 1.00
NASDAQ 100 1,719.50 1.75
Today's economic calendar:
Housing Starts 8:30 AM ET
Jobless Claims 8:30 AM ET
Philadelphia Fed Survey 10:00 AM ET
EIA Natural Gas Report 10:30 AM ET
3-Month Bill Announcement 11:00 AM ET
6-Month Bill Announcement 11:00 AM ET
52-Week Bill Announcement 11:00 AM ET
2-Yr Note Announcement 11:00 AM ET
5-Yr Note Announcement 11:00 AM ET
7-Yr Note Announcement 11:00 AM ET
Money Supply 4:30 PM ET
Today's earnings reports:
Today before open:
CCL Carnival Corp. Services General Entertainment
DFS Discover Financial Services Financial Credit Services
FDX FedEx Corporation Services Air Delivery & Freight Services
MCS Marcus Corp. Services Lodging
PIR Pier 1 Imports Inc. Services Home Furnishing Stores
SMTS Somanetics Corp. Healthcare Medical Appliances & Equipment
Today after close:
CMTL Comtech Telecommunications Corp. Technology Communication Equipment
IHS IHS Inc. Technology Business Software & Services
PALM Palm, Inc. Technology Personal Computers
PCYC Pharmacyclics Inc. Healthcare Drug Manufacturers - Other
PSEM Pericom Semiconductor Corp. Technology Semiconductor - Integrated Circuits
TSCM TheStreet.com, Inc. Technology Internet Information Providers
Wednesday, September 16, 2009
Another rocket up day for the market. How long and how high is the only question.
Dow 108 1.12%
Nasdaq 2,133 31 1.45%
S&P 500 1,069 16 1.53%
Gold 1,020 +14 +1.38%
Oil 72.40 1.58 2.23%
Today by sector:
 Today's heatmap:
 Tomorrow's earnings before open:
CCL Carnival Corp. Services General Entertainment
DFS Discover Financial Services Financial Credit Services
FDX FedEx Corporation Services Air Delivery & Freight Services
MCS Marcus Corp. Services Lodging
PIR Pier 1 Imports Inc. Services Home Furnishing Stores
SMTS Somanetics Corp. Healthcare Medical Appliances & Equipment
Tomorrows earnings reports:
CMTL Comtech Telecommunications Corp. Technology Communication Equipment
IHS IHS Inc. Technology Business Software & Services
PALM Palm, Inc. Technology Personal Computers
PSEM Pericom Semiconductor Corp. Technology Semiconductor - Integrated Circuits
TSCM TheStreet.com, Inc. Technology Internet Information Providers
Tomorrow's earnings before open:
CCL Carnival Corp. Services General Entertainment
DFS Discover Financial Services Financial Credit Services
FDX FedEx Corporation Services Air Delivery & Freight Services
MCS Marcus Corp. Services Lodging
PIR Pier 1 Imports Inc. Services Home Furnishing Stores
SMTS Somanetics Corp. Healthcare Medical Appliances & Equipment
Tomorrows earnings reports:
CMTL Comtech Telecommunications Corp. Technology Communication Equipment
IHS IHS Inc. Technology Business Software & Services
PALM Palm, Inc. Technology Personal Computers
PSEM Pericom Semiconductor Corp. Technology Semiconductor - Integrated Circuits
TSCM TheStreet.com, Inc. Technology Internet Information Providers
 Today's heatmap:
 Tomorrow's earnings before open:
CCL Carnival Corp. Services General Entertainment
DFS Discover Financial Services Financial Credit Services
FDX FedEx Corporation Services Air Delivery & Freight Services
MCS Marcus Corp. Services Lodging
PIR Pier 1 Imports Inc. Services Home Furnishing Stores
SMTS Somanetics Corp. Healthcare Medical Appliances & Equipment
Tomorrows earnings reports:
CMTL Comtech Telecommunications Corp. Technology Communication Equipment
IHS IHS Inc. Technology Business Software & Services
PALM Palm, Inc. Technology Personal Computers
PSEM Pericom Semiconductor Corp. Technology Semiconductor - Integrated Circuits
TSCM TheStreet.com, Inc. Technology Internet Information Providers
Tomorrow's earnings before open:
CCL Carnival Corp. Services General Entertainment
DFS Discover Financial Services Financial Credit Services
FDX FedEx Corporation Services Air Delivery & Freight Services
MCS Marcus Corp. Services Lodging
PIR Pier 1 Imports Inc. Services Home Furnishing Stores
SMTS Somanetics Corp. Healthcare Medical Appliances & Equipment
Tomorrows earnings reports:
CMTL Comtech Telecommunications Corp. Technology Communication Equipment
IHS IHS Inc. Technology Business Software & Services
PALM Palm, Inc. Technology Personal Computers
PSEM Pericom Semiconductor Corp. Technology Semiconductor - Integrated Circuits
TSCM TheStreet.com, Inc. Technology Internet Information Providers
CPI - Wednesday, September 16, 2009
Full report here
Consumer Price Index - August 2009
On a seasonally adjusted basis, the Consumer Price Index for all Urban Consumers (CPI-U) rose 0.4 percent in August, the Bureau of Labor Statistics reported today. The index has decreased 1.5 percent over the last 12 months on a not seasonally adjusted basis.
The 0.4 percent seasonally adjusted increase in the CPI-U was driven by a 9.1 percent rise in the gasoline index. This increase accounted for almost the entire advance in the energy index and over 80 percent of the overall increase. Despite the August increase, the gasoline index has fallen 30.0 percent over the last 12 months.
The indexes for food and for all items less food and energy both posted slight increases in August. The food index rose 0.1 percent following a 0.3 percent decline in July. The food at home index, which fell 0.5 percent in July, was unchanged in August. Of the six major grocery store food group indexes, three rose in August and three declined. The index for all items less food and energy also rose 0.1 percent in August, the second consecutive such increase.
Increases in the indexes for used cars and trucks, medical care, public transportation and lodging away from home offset a decline in the new vehicle index. The index for all items less food and energy increased 1.4 percent over the last 12 months, the smallest 12-month increase in the index since February 2004.
More info at link
Futures up this morning before some critical and market moving data begins to come out at 8:30 am.
DJIA INDEX 9,652.00 49.00
S&P 500 1,050.80 4.90
NASDAQ 100 1,701.25 6.25
Today's economic calendar:
MBA Purchase Applications 7:00 AM ET
Consumer Price Index 8:30 AM ET
Current Account 8:30 AM ET
Treasury International Capital 9:00 AM ET
Industrial Production 9:15 AM ET
EIA Petroleum Status Report 10:30 AM ET
Housing Market Index 1:00 PM ET
Today's earnings reports:
Before market opens:
EPM Evolution Petroleum Corp. Basic Materials Independent Oil & Gas
VOL Volt Information Sciences Inc. Services Staffing & Outsourcing Services
ZLC Zale Corporation Services Jewelry Stores
After market closes:
APOG Apogee Enterprises Inc. Industrial Goods General Building Materials
CKR CKE Restaurants Inc. Services Restaurants
CLC CLARCOR Inc. Consumer Goods Auto Parts
CTAS Cintas Corp. Services Business Services
DBRN Dress Barn Inc. Services Apparel Stores
DDMX Dynamex Inc. Services Trucking
MLHR Herman Miller Inc. Consumer Goods Business Equipment
OHB Orleans Homebuilders Inc. Industrial Goods Residential Construction
ORCL Oracle Corp. Technology Application Software
Tuesday, September 15, 2009
Market wrap - 4:15
The market looked like it might go down this morning, but at 10:30 it changed directions, and helped by the falling dollar around noon, rallied most of the day. A slight sell off at the close kept it from finishing at the day's high.
Dow 9,683.41 +56.61 (0.59%)
S&P 500 1,052.63 +3.29 (0.31%)
Nasdaq 2,102.64 +10.86 (0.52%)
Gold 1,006 +5 +0.52%
Oil 70.94 2.07 3.01%
Today by sector:
 Today's heatmap:
 Earnings after close tonight:
ADBE Adobe Systems Inc. Technology Application Software
CGA China Green Agriculture, Inc. Basic Materials Agricultural Chemicals
Earnings reports before open tomorrow:
VOL Volt Information Sciences Inc. Services Staffing & Outsourcing Services
Earnings after close tonight:
ADBE Adobe Systems Inc. Technology Application Software
CGA China Green Agriculture, Inc. Basic Materials Agricultural Chemicals
Earnings reports before open tomorrow:
VOL Volt Information Sciences Inc. Services Staffing & Outsourcing Services
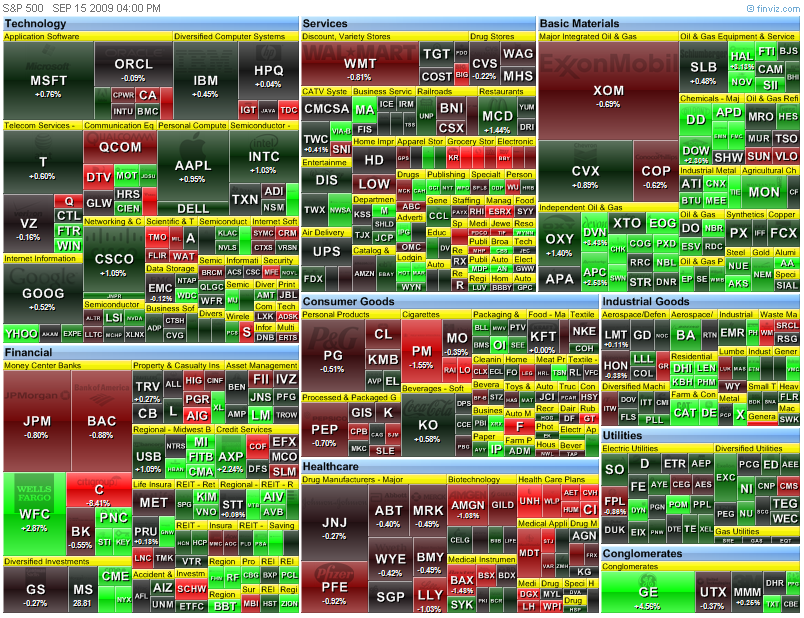
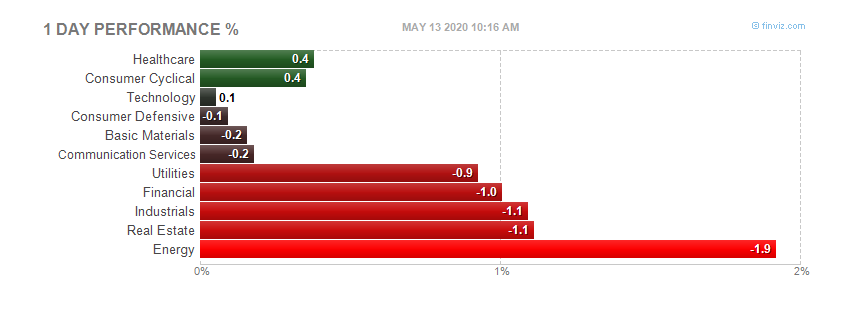 Today's heatmap:
 Earnings after close tonight:
ADBE Adobe Systems Inc. Technology Application Software
CGA China Green Agriculture, Inc. Basic Materials Agricultural Chemicals
Earnings reports before open tomorrow:
VOL Volt Information Sciences Inc. Services Staffing & Outsourcing Services
Earnings after close tonight:
ADBE Adobe Systems Inc. Technology Application Software
CGA China Green Agriculture, Inc. Basic Materials Agricultural Chemicals
Earnings reports before open tomorrow:
VOL Volt Information Sciences Inc. Services Staffing & Outsourcing Services
Empire State Manufacturing Survey - 8:30am
 Full report here
The Empire State Manufacturing Survey indicates that conditions for New York manufacturers improved in September, following the upturn first observed in August. The general business conditions index increased 7 points, to 18.9, its highest level since late 2007. The new orders index was positive and higher than last month, while the shipments index dipped. The prices paid index rose several points to its highest level in many months, and the prices received index, while negative, inched close to zero. The index for number of employees remained in negative territory, while the average workweek index moved above zero for the first time in a year. Future indexes remained relatively high and close to their August levels, suggesting that conditions are expected to improve further in the months ahead. Indeed, the future general business conditions index reached its highest level in several years.
In response to a series of supplementary questions about past and prospective changes in the selling prices of their goods, manufacturers indicated that prices had declined by 2.1 percent, on average, over the past twelve months—a sharp contrast with the rise of 4.8 percent reported in an identical survey conducted a year ago (see supplemental report). Looking ahead to the next twelve months, respondents expected prices to rise by 1.9 percent, on average, compared with last year’s expected price rise of 3.6 percent. When asked about the probability of certain specified price changes over the next twelve months, the average respondent estimated a roughly 50 percent chance that prices would remain within 2 percent of their current levels, a 39 percent chance that they would rise 2 percent or more, and a 12 percent chance that they would drop 2 percent or more.
Conditions Improve for a Second Consecutive Month
In September, the general business conditions index posted its third consecutive monthly increase and its second consecutive positive reading. Rising 7 points to 18.9, the index was at its highest level since November 2007, with nearly 40 percent of respondents reporting that conditions had improved in September and 20 percent reporting that conditions had worsened. Similarly, the new orders index rose 6 points to 19.8, its highest level since November 2007. The shipments index dipped 9 points to 5.3; the unfilled orders index, while still below zero, rose to -4.8. The delivery time index moved above zero for the first time in considerably more than a year, climbing 12 points to 1.2. The inventories index remained well below zero, at -25.0.
Average Workweek Index Rises above Zero
The indexes for both prices paid and prices received advanced in September. The prices paid index rose 6 points to 20.2, its third consecutive positive reading—a sign that input prices were generally rising. The prices received index rose 9 points, but continued to be negative, at -3.6. The index for number of employees, at -8.3, remained negative and close to last month’s level. The average workweek index rose sharply, as it did last month, climbing 12 points to 6.0, its first positive reading in a year.
Continued Improvement Expected in the Months Ahead
Future indexes were generally positive and near last month’s levels. The future general business conditions index rose 4 points, to 52.3, a level last reached in 2004. The future new orders and shipments indexes held steady. The future inventories index dipped 11 points to -17.9. Future price indexes were both positive and higher than in August, and future employment indexes were also positive. The capital expenditures and technology spending indexes both edged down a few points, but remained positive.
Full report here
The Empire State Manufacturing Survey indicates that conditions for New York manufacturers improved in September, following the upturn first observed in August. The general business conditions index increased 7 points, to 18.9, its highest level since late 2007. The new orders index was positive and higher than last month, while the shipments index dipped. The prices paid index rose several points to its highest level in many months, and the prices received index, while negative, inched close to zero. The index for number of employees remained in negative territory, while the average workweek index moved above zero for the first time in a year. Future indexes remained relatively high and close to their August levels, suggesting that conditions are expected to improve further in the months ahead. Indeed, the future general business conditions index reached its highest level in several years.
In response to a series of supplementary questions about past and prospective changes in the selling prices of their goods, manufacturers indicated that prices had declined by 2.1 percent, on average, over the past twelve months—a sharp contrast with the rise of 4.8 percent reported in an identical survey conducted a year ago (see supplemental report). Looking ahead to the next twelve months, respondents expected prices to rise by 1.9 percent, on average, compared with last year’s expected price rise of 3.6 percent. When asked about the probability of certain specified price changes over the next twelve months, the average respondent estimated a roughly 50 percent chance that prices would remain within 2 percent of their current levels, a 39 percent chance that they would rise 2 percent or more, and a 12 percent chance that they would drop 2 percent or more.
Conditions Improve for a Second Consecutive Month
In September, the general business conditions index posted its third consecutive monthly increase and its second consecutive positive reading. Rising 7 points to 18.9, the index was at its highest level since November 2007, with nearly 40 percent of respondents reporting that conditions had improved in September and 20 percent reporting that conditions had worsened. Similarly, the new orders index rose 6 points to 19.8, its highest level since November 2007. The shipments index dipped 9 points to 5.3; the unfilled orders index, while still below zero, rose to -4.8. The delivery time index moved above zero for the first time in considerably more than a year, climbing 12 points to 1.2. The inventories index remained well below zero, at -25.0.
Average Workweek Index Rises above Zero
The indexes for both prices paid and prices received advanced in September. The prices paid index rose 6 points to 20.2, its third consecutive positive reading—a sign that input prices were generally rising. The prices received index rose 9 points, but continued to be negative, at -3.6. The index for number of employees, at -8.3, remained negative and close to last month’s level. The average workweek index rose sharply, as it did last month, climbing 12 points to 6.0, its first positive reading in a year.
Continued Improvement Expected in the Months Ahead
Future indexes were generally positive and near last month’s levels. The future general business conditions index rose 4 points, to 52.3, a level last reached in 2004. The future new orders and shipments indexes held steady. The future inventories index dipped 11 points to -17.9. Future price indexes were both positive and higher than in August, and future employment indexes were also positive. The capital expenditures and technology spending indexes both edged down a few points, but remained positive.
Retail sales - September 15, 2009 - 8:30am
Full report here
August 2009
The U.S. Census Bureau announced today that advance estimates of U.S. retail and food services sales for August, adjusted for seasonal variation and holiday and trading-day differences, but not for price changes, were $351.4 billion, an increase of 2.7 percent (±0.5%) from the previous month, but 5.3 percent (±0.7%) below August 2008. Total sales for the June through August 2009 period were down 7.6 percent (±0.3%) from the same period a year ago. The June to July 2009 percent change was revised from -0.1 percent (±0.5%)* to -0.2 percent (±0.2%)*.
Retail trade sales were up 3.0 percent (±0.7%) from July 2009, but 6.0 percent (±0.7%) below last year. Gasoline stations sales were down 26.7 percent (±1.5%) from August 2008 and building material and garden equipment and supplies dealers were down 13.6 percent (±2.0%) from last year.
More at link
PPI data - September 15, 2009 - 8:30am
Full report here
PRODUCER PRICE INDEXES - AUGUST 2009
The Producer Price Index for Finished Goods advanced 1.7 percent in August, seasonally adjusted, the Bureau of Labor Statistics of the U.S. Department of Labor reported today. This increase followed a 0.9-percent decline in July and a 1.8-percent advance in June. In August, at the earlier stages of processing, prices received by manufacturers of intermediate goods rose 1.8 percent and the crude goods index moved up 3.8 percent. On an unadjusted basis, prices for finished goods fell 4.3 percent from August 2008 to August 2009, following a record 6.8 percent 12-month decline in July. (See table A.)
More at link with formatted tables
Pre-market, Tuesday, September 15, 2009
Futures down slightly as of 7:47 am
DJIA INDEX 9,537.00 -13.00
S&P 500 1,041.30 -2.20
NASDAQ 100 1,685.75 -2.25
Today's economic calendar:
ICSC-Goldman Store Sales 7:45 AM ET
Producer Price Index 8:30 AM ET
Retail Sales 8:30 AM ET
Empire State Mfg Survey 8:30 AM ET
Redbook 8:55 AM ET
Business Inventories 10:00 AM ET
Ben Bernanke Speaks 10:00 AM ET
4-Week Bill Auction 1:00 PM ET
Today's earnings reports:
Before market opens:
BBY Best Buy Co. Inc. Services Electronics Stores
CBRL Cracker Barrel Old Country Store, Inc. Services Restaurants
GIGM GigaMedia Ltd. Technology Internet Software & Services
KR Kroger Co. Services Grocery Stores
RAIL FreightCar America Inc. Services Railroads
SYMX Synthesis Energy Systems, Inc. Basic Materials Specialty Chemicals
After close:
ADBE Adobe Systems Inc. Technology Application Software
CGA China Green Agriculture, Inc. Basic Materials Agricultural Chemicals
Market wrap - a day late - 7:45am
Dow 9,626.80 +21.39 (0.22%)
S&P 500 1,049.34 +6.61 (0.63%)
Nasdaq 2,091.78 +10.88 (0.52%)
Today by sector:
 Today's heatmap:

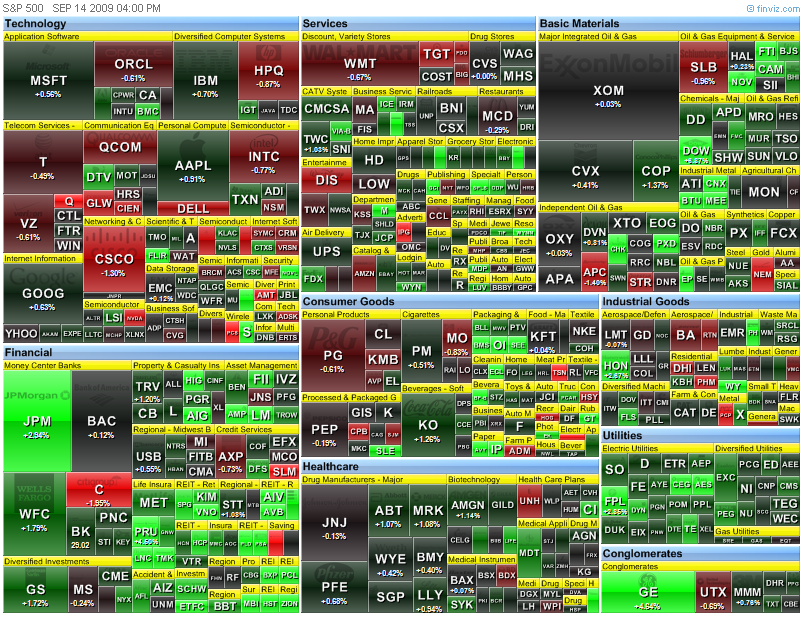
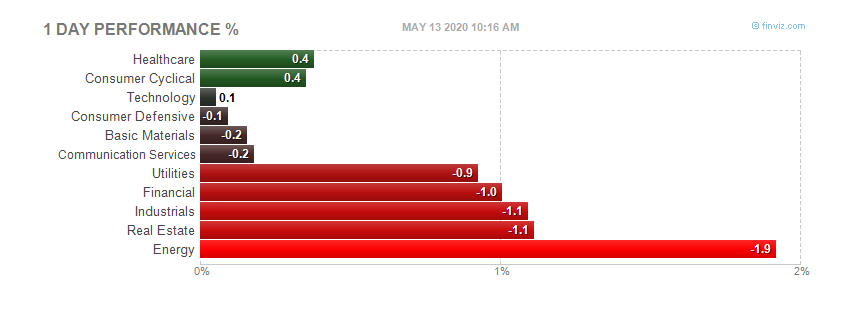 Today's heatmap:
Monday, September 14, 2009
Pre-market, Monday, September 14, 2009
Futures down this morning as of 7:45
DJIA INDEX 9,464.00 -67.00
S&P 500 1,028.60 -8.70
NASDAQ 100 1,669.75 -13.75
Today's economic calendar:
Elizabeth Duke Speaks 8:35 AM ET
4-Week Bill Announcement 11:00 AM ET
Jeffrey Lacker Speaks 12:30 PM ET
3-Month Bill Auction 1:00 PM ET
6-Month Bill Auction 1:00 PM ET
Janet Yellen Speaks 3:50 PM ET
Today's earnings reports:
Before open:
FMCN Focus Media Holding Ltd. Services Advertising Agencies
NTSC National Technical Systems Inc. Services Research Services
PMFG PMFG, Inc. Industrial Goods Diversified Machinery
SCMR Sycamore Networks Inc. Technology Networking & Communication Devices
After close:
COOL Majesco Entertainment Co. Technology Multimedia & Graphics Software
PLL Pall Corp. Industrial Goods Diversified Machinery
UNFY Unify Corp. Technology Business Software & Services
WPCS WPCS International Incorporated Technology Diversified Communication Services
Friday, September 11, 2009
Pre-market - Friday, September 11, 2009
Futures up slightly this mornning:
DJIA INDEX 9,554.00 10.00
S&P 500 1,038.60 1.20 1,037.00
NASDAQ 100 1,684.25 1.50
Today's economic calendar:
Import and Export Prices 8:30 AM ET
Consumer Sentiment 9:55 AM ET
Wholesale Trade 10:00 AM ET
Treasury Budget 2:00 PM ET
Today's earnings reports:
Before open:
ACET Aceto Corp. Healthcare Drug Manufacturers - Major
BRC Brady Corp. Services Business Services
CPB Campbell Soup Co. Consumer Goods Processed & Packaged Goods
GROW U.S. Global Investors, Inc. Financial Asset Management
After close = none
Market wrap - Thrusday, September 10, 2009
Dow 9,627.48 +80.26 (0.84%)
S&P 500 1,044.14 +10.77 (1.04%)
Nasdaq 2,084.02 +23.63 (1.15%)


Thursday, September 10, 2009

International trade - 8:30am
Full report here
U.S. Census Bureau
U.S. Bureau of Economic Analysis
NEWS
U.S. Department of Commerce * Washington, DC 20230
U.S. INTERNATIONAL TRADE IN GOODS AND SERVICES
July 2009
Goods and Services
The U.S. Census Bureau and the U.S. Bureau of Economic Analysis, through the Department of Commerce, announced today that total July exports of $127.6 billion and imports of $159.6 billion resulted in a goods and services deficit of $32.0 billion, up from $27.5 billion in June, revised. July exports were $2.7 billon more than June exports of $124.9 billion. July imports were $7.2 billion more than June imports of $152.4 billion.
In July, the goods deficit increased $4.3 billion from June to $42.7 billion, and the services surplus decreased $0.1 billion to $10.7 billion. Exports of goods increased $2.7 billion to $86.7 billion, and imports of goods increased $7.0 billion to $129.4 billion. Exports of services increased $0.1 billion to $40.9 billion, and imports of services increased $0.2 billion to $30.2 billion.
In July, the goods and services deficit decreased $32.9 billion from July 2008. Exports were down $36.8 billion, or 22.4 percent, and imports were down $69.8 billion, or 30.4 percent.
Goods
The June to July increase in exports of goods reflected increases in automotive vehicles, parts, and engines ($1.3 billion); capital goods ($0.7 billion); industrial supplies and materials ($0.4 billion); consumer goods ($0.4 billion); and other goods ($0.2 billion). A decrease occurred in foods, feeds, and beverages ($0.4 billion).
The June to July increase in imports of goods reflected increases in automotive vehicles, parts, and engines ($2.4 billion); consumer goods ($1.7 billion); industrial supplies and materials ($1.4 billion); capital goods ($1.3 billion); and other goods ($0.2 billion). A decrease occurred in foods, feeds, and beverages ($0.1 billion).
The July 2008 to July 2009 decrease in exports of goods reflected decreases in industrial supplies and materials ($13.1 billion); capital goods ($7.9 billion); automotive vehicles, parts, and engines ($4.7 billion); foods, feeds, and beverages ($2.2 billion); consumer goods ($2.1 billion); and other goods ($0.4 billion).
The July 2008 to July 2009 decrease in imports of goods reflected decreases in industrial supplies and materials ($41.5 billion); capital goods ($8.6 billion); automotive vehicles, parts, and engines ($6.8 billion); consumer goods ($5.5 billion); other goods ($1.1 billion); and foods, feeds, and beverages ($0.7 billion).
Services
Services exports increased $0.1 billion from June to July. The increase was more than accounted for by an increase in other transportation (which includes freight and port services) and small increases in several other categories of services exports. Decreases in passenger fares and other private services (which includes items such as business, professional, and technical services, insurance services, and financial services) were partly offsetting.
Services imports increased $0.2 billion from June to July. The increase was more than accounted for by increases in other transportation and travel. A decrease in passenger fares was partly offsetting. Changes in other categories of services imports were small.
The July 2008 to July 2009 decrease in exports of services was $6.3 billion. The largest decreases were in travel ($2.3 billion), other transportation ($1.6 billion), other private services ($1.1 billion), and royalties and license fees ($1.0 billion). Within other private services, the largest decrease was in business, professional, and technical services.
The July 2008 to July 2009 decrease in imports of services was $4.7 billion. The largest decreases were in other transportation ($2.0 billion), passenger fares ($0.8
billion), travel ($0.6 billion), and other private services ($0.6 billion). Within other private services, the largest decreases were in business, professional, and technical services and financial services.
Goods and Services Moving Average
For the three months ending in July, exports of goods and services averaged $124.9 billion, while imports of goods and services averaged $153.5 billion, resulting in an average trade deficit of $28.6 billion. For the three months ending in June, the average trade deficit was $27.7 billion, reflecting average exports of $122.6 billion and average imports of $150.3 billion.
Selected Not Seasonally Adjusted Goods Details
The July figures show surpluses, in billions of dollars, with Hong Kong $1.3 ($1.4 for June), Australia $0.7 ($1.0), Singapore $0.7 ($0.5), and Egypt $0.2 ($0.2). Deficits were recorded, in billions of dollars, with China $20.4 ($18.4), the European Union $8.0 ($4.5), OPEC $6.9 ($5.9), Japan $3.9 ($3.7), Mexico $2.9 ($3.4), Venezuela $2.3 ($1.8), Canada $2.2 ($1.5), Nigeria $1.7 ($1.3), Korea $1.0 ($0.9), and Taiwan $0.7 ($0.6).
Advanced technology products (ATP) exports were $20.0 billion in July and imports were $26.6 billion, resulting in a deficit of $6.6 billion. July exports were $0.8 billion less than the $20.7 billion in June, while July imports were $1.2 billion more than the $25.3 billion in June.
Revisions
Goods carry-over in July was $0.1 billion (0.1 percent) for exports and $0.6 billion (0.4 percent) for imports. For June, revised export carry-over was virtually zero, revised down from $0.1 billion (0.1 percent). For June, revised import carry-over was $0.1 billion (0.1 percent), revised down from $0.5 billion (0.4 percent).
Services exports and imports for January 2009 through June 2009 reflect the incorporation of more comprehensive and revised quarterly and monthly data. For services exports, the largest monthly revisions were in royalties and license fees and other private services. For services imports, the largest monthly revisions were in other private services.
Services exports for June were revised down $1.0 billion to $40.8 billion. The revision was more than accounted for by downward revisions in royalties and license fees, other private services, and travel; an upward revision in transfers under U.S. military sales contracts was partly offsetting. Services imports for June were revised down $0.4 billion to $30.0 billion. The revision was more than accounted for by a downward revision in other private services; an upward revision in royalties and license fees was partly offsetting.
Jobless claims - 8:30am
Full report here
UNEMPLOYMENT INSURANCE WEEKLY CLAIMS REPORT
SEASONALLY ADJUSTED DATA
In the week ending Sept. 5, the advance figure for seasonally adjusted initial claims was 550,000, a decrease of 26,000 from the previous week's revised figure of 576,000. The 4-week moving average was 570,000, a decrease of 2,750 from the previous week's revised average of 572,750.
The advance seasonally adjusted insured unemployment rate was 4.6 percent for the week ending Aug. 29, a decrease of 0.1 percentage point from the prior week's unrevised rate of 4.7 percent.
The advance number for seasonally adjusted insured unemployment during the week ending Aug. 29 was 6,088,000, a decrease of 159,000 from the preceding week's revised level of 6,247,000. The 4-week moving average was 6,182,500, a decrease of 37,750 from the preceding week's revised average of 6,220,250.
The fiscal year-to-date average for seasonally adjusted insured unemployment for all programs is 5.617 million.
UNADJUSTED DATA
The advance number of actual initial claims under state programs, unadjusted, totaled 460,516 in the week ending Sept. 5, an increase of 3,834 from the previous week. There were 336,733 initial claims in the comparable week in 2008.
The advance unadjusted insured unemployment rate was 4.1 percent during the week ending Aug. 29, a decrease of 0.1 percentage point from the prior week. The advance unadjusted number for persons claiming UI benefits in state programs totaled 5,424,564, a decrease of 197,837 from the preceding week. A year earlier, the rate was 2.3 percent and the volume was 3,059,126.
Extended benefits were available in Alabama, Alaska, Arizona, Arkansas, California, Colorado, Connecticut, Delaware, the District of Columbia, Florida, Georgia, Idaho, Illinois, Indiana, Kansas, Kentucky, Maine, Massachusetts, Michigan, Minnesota, Missouri, Nevada, New Hampshire, New Jersey, New York, North Carolina, Ohio, Oregon, Pennsylvania, Puerto Rico, Rhode Island, South Carolina, Tennessee, Texas, Vermont, Virginia, Washington, West Virginia, and Wisconsin during the week ending Aug. 22.
Initial claims for UI benefits by former Federal civilian employees totaled 1,456 in the week ending Aug. 29, a decrease of 49 from the prior week. There were 2,153 initial claims by newly discharged veterans, a decrease of 33 from the preceding week.
There were 19,715 former Federal civilian employees claiming UI benefits for the week ending Aug. 22, a decrease of 434 from the previous week. Newly discharged veterans claiming benefits totaled 30,776, an increase of 661 from the prior week.
States reported 3,102,877 persons claiming EUC (Emergency Unemployment Compensation) benefits for the week ending Aug. 22, an increase of 73,209 from the prior week. There were 1,160,151 claimants in the comparable week in 2008. EUC weekly claims include both first and second tier activity.
The highest insured unemployment rates in the week ending Aug. 22 were in Puerto Rico (7.0 percent), Pennsylvania (5.9), Oregon (5.9), Michigan (5.7), Nevada (5.7), California (5.3), Wisconsin (5.3), Connecticut (5.2), New Jersey (5.1), North Carolina (4.8), Rhode Island (4.8), and South Carolina (4.8).
The largest increases in initial claims for the week ending Aug. 29 were in New York (+4,546), Texas (+2,837), Florida (+1,780), New Jersey (+1,368), and Georgia (+1,336), while the largest decreases were in Michigan (-1,915), Ohio (-1,832), Oregon (-1,717), Wisconsin (-1,235), and Pennsylvania
(-1,190).
More at link with formatted tables
Pre-market - Thursday, September 10, 2009
Futures mixed to down this morning waiting on the Jobless Claims report at 8:30:
DJIA INDEX 9,537.00 -1.00
S&P 500 1,032.50 0.00
NASDAQ 100 1,668.25 2.25
Today's economic calendar:
BOE Announcement 7:00 AM ET
International Trade 8:30 AM ET
Jobless Claims 8:30 AM ET
Bank of Canada Announcement 9:00 AM ET
RBC CASH Index 9:00 AM ET
EIA Natural Gas Report 10:30 AM ET
EIA Petroleum Status Report 11:00 AM ET
3-Month Bill Announcement 11:00 AM ET
6-Month Bill Announcement 11:00 AM ET
30-Yr Bond Auction 1:00 PM ET
Money Supply 4:30 PM ET
Today's earings reports:
Before market opens:
DSGX Descartes Systems Group Inc. (T Technology Business Software & Services
GNET Global Traffic Network Inc. Technology Information & Delivery Services
LULU Lululemon Athletica Inc. Consumer Goods Textile - Apparel Clothing
MDNU Medical Nutrition USA, Inc. Healthcare Drug Related Products
MDZ MDS, Inc. Healthcare Specialized Health Services
MGPI MGP Ingredients Inc. Consumer Goods Processed & Packaged Goods
OHB Orleans Homebuilders Inc. Industrial Goods Residential Construction
SCMR Sycamore Networks Inc. Technology Networking & Communication Devices
VOL Volt Information Sciences Inc. Services Staffing & Outsourcing Services (release delayed)
After market close:
CMRO Comarco, Inc. Technology Communication Equipment
FMCN Focus Media Holding Ltd. Services Advertising Agencies
NSM National Semiconductor Corporation Technology Semiconductor - Broad Line
PSEM Pericom Semiconductor Corp. Technology Semiconductor - Integrated Circuits
TSCM TheStreet.com, Inc. Technology Internet Information Providers
Market wrap for Wednesday
Dow 9,547.22 +49.88 (0.53%)
S&P 500 1,033.37 +7.98 (0.78%)
Nasdaq 2,060.39 +22.62 (1.11%)
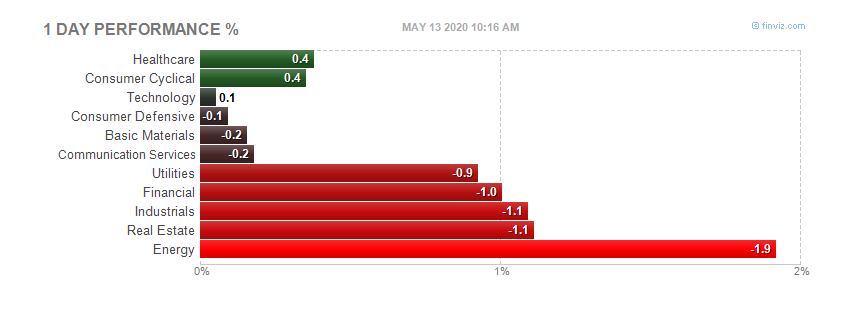
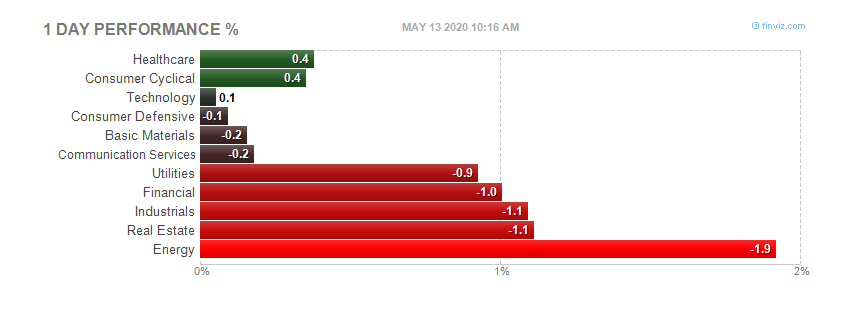
Today by sector:
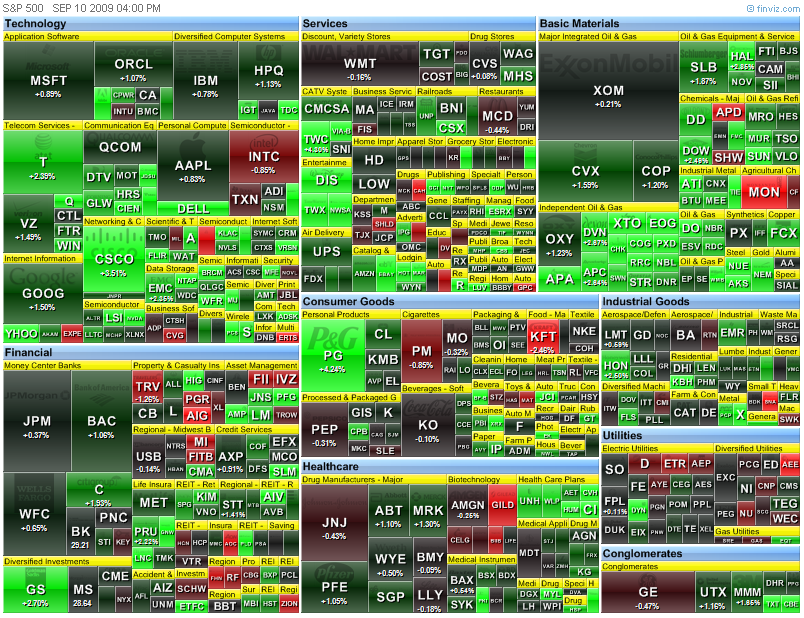
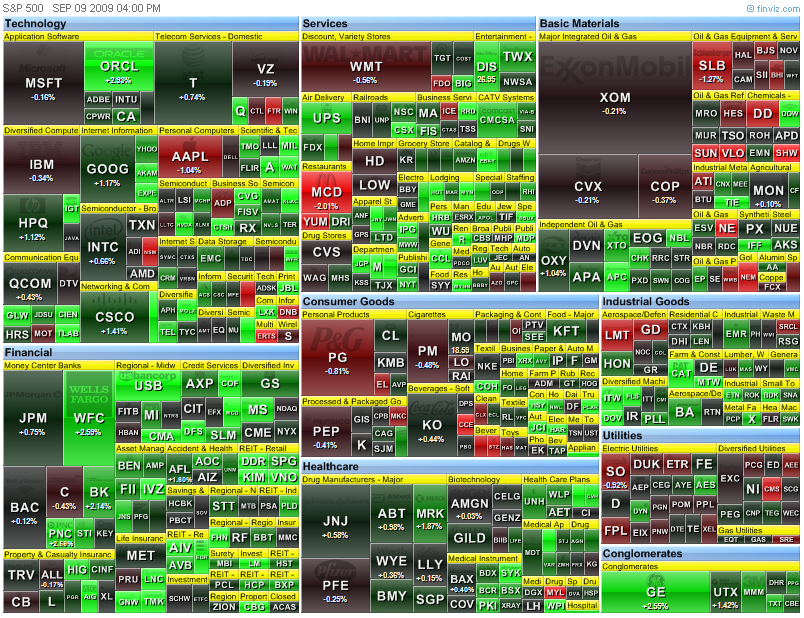
 Today's heatmap:

 Today's heatmap:
Wednesday, September 9, 2009
Pre-market - Wednesday, Sept 9, 2009
Futures down slightly as we wait on data this morning:
DJIA INDEX 9,488.00 -8.00
S&P 500 1,024.80 -0.30
NASDAQ 100 1,652.75 -2.50
Today's economic calendar:
MBA Purchase Applications 7:00 AM ET
ICSC-Goldman Store Sales 7:45 AM ET
Redbook 8:55 AM ET
Quarterly Services Survey 10:00 AM ET
4-Week Bill Auction 11:30 AM ET
10-Yr Note Auction 1:00 PM ET
Richard Fisher Speaks 1:30 PM ET
Beige Book 2:00 PM ET
Today's earnings reports:
Before open:
HITK Hi Tech Pharmacal Co. Inc. Healthcare Drugs - Generic
KFY Korn/Ferry International Services Staffing & Outsourcing Services
LAKE Lakeland Industries Inc. Healthcare Medical Appliances & Equipment
LRN K12, Inc. Services Education & Training Services
OHB Orleans Homebuilders Inc. Industrial Goods Residential Construction
RSC REX Stores Corp. Services Electronics Stores
RURL Rural/Metro Corp. Services Consumer Services
SIG Signet Jewelers Limited Services Jewelry Stores
TITN Titan Machinery, Inc. Services Specialty Retail, Other
TLB The Talbots Inc. Services Apparel Stores
UNFI United Natural Foods, Inc. Services Food Wholesale
ZLC Zale Corporation Services Jewelry Stores
After close:
GCOM Globecomm Systems Inc. Technology Processing Systems & Products
IRET Investors Real Estate Trust Financial REIT - Retail
MW Men's Wearhouse Inc. Services Apparel Stores
NAV Navistar International Corp. Consumer Goods Trucks & Other Vehicles
NCS NCI Building Systems Inc. Industrial Goods General Building Materials
SEH Spartech Corp. Consumer Goods Rubber & Plastics
SHFL Shuffle Master Inc. Industrial Goods Diversified Machinery
STEI Stewart Enterprises Inc. Services Personal Services
STRM Streamline Health Solutions, Inc. Technology Healthcare Information Services
SWHC Smith & Wesson Holding Corp. Industrial Goods Aerospace/Defense Products & Services
Market wrap - Tuesday, Sept 8, 2009
Dow 9,497.34 +56.07 (0.59%)
S&P 500 1,025.39 +8.99 (0.88%)
Nasdaq 2,037.77 +18.99 (0.94%)



Tuesday, September 8, 2009
Pre-market - September 8, 2009
Futures up this morning after a long weekend:
DJIA INDEX 9,502.00 85.00 9,416.00 07:01
S&P 500 1,023.80 9.90
NASDAQ 100 1,651.50 15.75
Today's economic calendar:
ICSC-Goldman Store Sales 7:45 AM ET
Redbook 8:55 AM ET
4-Week Bill Announcement 11:00 AM ET
3-Month Bill Auction 11:30 AM ET
6-Month Bill Auction 11:30 AM ET
3-Yr Note Auction 1:00 PM ET
Consumer Credit 3:00 PM ET
Todays's earnings reports:
Before market opens:
CHP C&D Technologies Inc. Technology Diversified Electronics
GIGM GigaMedia Ltd. Technology Internet Software & Services
RAIL FreightCar America Inc. Services Railroads
SFD Smithfield Foods Inc. Consumer Goods Meat Products
XIN Xinyuan Real Estate Company Ltd. Industrial Goods Residential Construction
After market closes:
ALOY Alloy Inc. Services Marketing Services
AVAV AeroVironment, Inc. Industrial Goods Aerospace/Defense Products & Services
CASY Casey's General Stores Inc. Services Grocery Stores
FCE-A Forest City Enterprises Inc. Financial Property Management
FCEL FuelCell Energy Inc. Industrial Goods Industrial Electrical Equipment
FLOW Flow International Corp. Industrial Goods Machine Tools & Accessories
MIND Mitcham Industries Inc. Services Rental & Leasing Services
NLCI Nobel Learning Communities Inc. Services Education & Training Services
PBY Pep Boys - Manny, Moe & Jack Services Auto Parts Stores
ROSG Rosetta Genomics, Ltd. Healthcare Diagnostic Substances
SB Safe Bulkers, Inc. Services Shipping
Friday, September 4, 2009
Employment report - 8:30am
Not so good - full report here
Transmission of material in this release is embargoed until 8:30 a.m. (EDT) September 4, 2009
THE EMPLOYMENT SITUATION -- AUGUST 2009
Nonfarm payroll employment continued to decline in August (-216,000),
and the unemployment rate rose to 9.7 percent, the U.S. Bureau of Labor
Statistics reported today. Although job losses continued in many of the
major industry sectors in August, the declines have moderated in recent
months.
Household Survey Data
In August, the number of unemployed persons increased by 466,000 to 14.9
million, and the unemployment rate rose by 0.3 percentage point to 9.7
percent. The rate had been little changed in June and July, after in-
creasing 0.4 or 0.5 percentage point in each month from December 2008
through May. Since the recession began in December 2007, the number of
unemployed persons has risen by 7.4 million, and the unemployment rate
has grown by 4.8 percentage points. (See table A-1.)
Among the major worker groups, the unemployment rates for adult men
(10.1 percent), whites (8.9 percent), and Hispanics (13.0 percent) rose
in August. The jobless rates for adult women (7.6 percent), teenagers
(25.5 percent), and blacks (15.1 percent) were little changed over the
month. The unemployment rate for Asians was 7.5 percent, not seasonally
adjusted. (See tables A-1, A-2, and A-3.)
The civilian labor force participation rate remained at 65.5 percent in
August. The employment-population ratio, at 59.2 percent, edged down
over the month and has declined by 3.5 percentage points since the re-
cession began in December 2007. (See table A-1.)
In August, the number of persons working part time for economic reasons
was little changed at 9.1 million. These individuals indicated that they
were working part time because their hours had been cut back or because
they were unable to find a full-time job. The number of such workers
rose sharply in the fall and winter but has been little changed since
March. (See table A-5.)
About 2.3 million persons were marginally attached to the labor force
in August, reflecting an increase of 630,000 from a year earlier. (The
data are not seasonally adjusted.) These individuals were not in the
labor force, wanted and were available for work, and had looked for a
job sometime in the prior 12 months. They were not counted as unemployed
because they had not searched for work in the 4 weeks preceding the sur-
vey. (See table A-13.)
Among the marginally attached, the number of discouraged workers in
August (758,000) has nearly doubled over the past 12 months. (The data
are not seasonally adjusted.) Discouraged workers are persons not cur-
rently looking for work because they believe no jobs are available for
them. The other 1.5 million persons marginally attached to the labor
force in August had not searched for work in the 4 weeks preceding the
survey for reasons such as school attendance or family responsibilities.
Establishment Survey Data
Total nonfarm payroll employment declined by 216,000 in August. Since
December 2007, employment has fallen by 6.9 million. In recent months,
job losses have moderated in many major industry sectors. (See table
B-1.)
In August, construction employment declined by 65,000, in line with
the trend since May. Monthly losses had averaged 117,000 over the 6
months ending in April. Employment in the construction industry has
contracted by 1.4 million since the onset of the recession. Starting
in early 2009, the larger share of monthly job losses shifted from the
residential to the nonresidential and heavy construction components.
In mining, employment declined by 9,000 over the month.
In August, manufacturing employment continued to trend downward, with
a decline of 63,000. The pace of job loss has slowed throughout manu-
facturing in recent months. Motor vehicles and parts lost 15,000 jobs
in August, partly offsetting a 31,000 employment increase in July.
Financial activities shed 28,000 jobs in August, with declines spread
throughout the industry. Job loss in financial activities has slowed
since the beginning of the year. Employment in the industry has de-
clined by 537,000 since the start of the recession.
Wholesale trade employment fell by 17,000 in August. Employment in
information continued to trend down over the month.
Employment in the retail trade industry was little changed in August.
Employment also was little changed in professional and business ser-
vices over the month. From May through August, monthly employment
declines in the sector averaged 46,000, compared with 138,000 per
month from November through April. Job loss in its temporary help
services component has slowed markedly over the last 4 months.
Employment was little changed in August both in transportation and
warehousing, and in leisure and hospitality.
Employment in health care continued to rise in August (28,000), with
gains in ambulatory care and in nursing and residential care. Employ-
ment in hospitals was little changed in August; job growth in the
industry slowed in early 2009 and employment has been flat since May.
Health care has added 544,000 jobs since the start of the recession.
In August, the average workweek for production and nonsupervisory
workers on private nonfarm payrolls was unchanged at 33.1 hours.
The manufacturing workweek and factory overtime also showed no
change over the month (at 39.8 hours and 2.9 hours, respectively).
(See table B-2.)
In August, average hourly earnings of production and nonsupervisory
workers on private nonfarm payrolls rose by 6 cents, or 0.3 percent,
to $18.65. Over the past 12 months, average hourly earnings have risen
by 2.6 percent, while average weekly earnings have risen by only 0.8
percent due to declines in the average workweek. (See table B-3.)
The change in total nonfarm payroll employment for June was revised
from -443,000 to -463,000, and the change for July was revised from
-247,000 to -276,000.
_____________
The Employment Situation for September is scheduled to be released on
Friday, October 2, 2009, at 8:30 a.m. (EDT).
More at link
Pre-market - Friday, September 4, 2009
Futures up slightly this morning waiting on the much awaited jobs report out at 8:30
DJIA INDEX 9,357.00 27.00
S&P 500 1,005.20 3.50
NASDAQ 100 1,611.25 7.25
Today's economic calendar:
Employment Situation 8:30 AM ET
Treasury STRIPS 3:00 PM ET
Today's earnings reports:
Before market opens:
DFZ RG Barry Corp. Consumer Goods Textile - Apparel Footwear & Accessories
HRB H&R Block, Inc. Services Personal Services
After close = none
Market wrap - Thursday - September 3, 2009
A pretty uneventful day in the market today.
Dow 9,344.61 +63.94 (0.69%)
S&P 500 1,003.24 +8.49 (0.85%)
Nasdaq 1,983.20 +16.13 (0.82%)
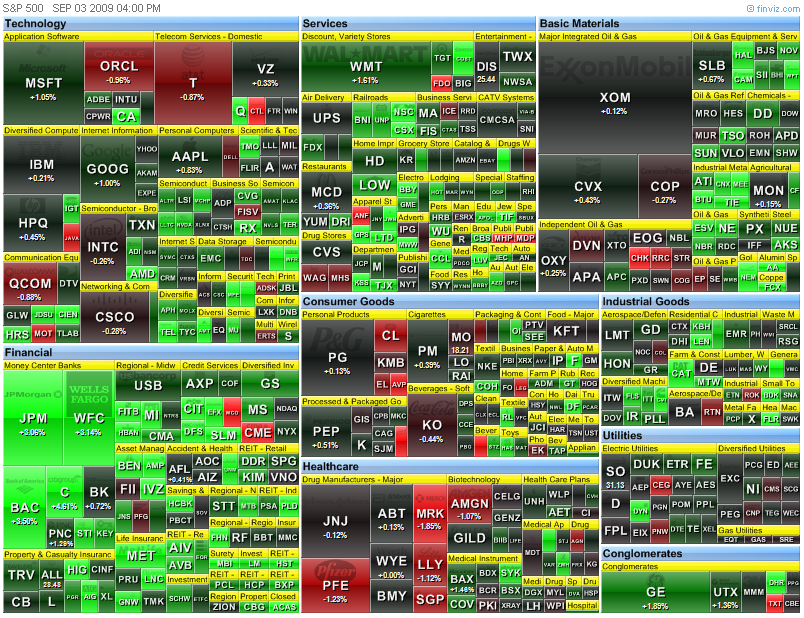
Today by sector(the banks win again).
 Today's heatmap:

 Today's heatmap:
Thursday, September 3, 2009
ISM Non-manufacturing data - 10:am
Full report here
August 2009 Non-Manufacturing ISM Report On Business®
NMI (Non-Manufacturing Index) at 48.4%
DO NOT CONFUSE THIS NATIONAL REPORT with the various regional purchasing reports released across the country. The national report's information reflects the entire United States, while the regional reports contain primarily regional data from their local vicinities. Also, the information in the regional reports is not used in calculating the results of the national report. The information compiled in this report is for the month of August 2009.
Business Activity Index at 51.3%
New Orders Index at 49.9%
Employment Index at 43.5%
(Tempe, Arizona) — Economic activity in the non-manufacturing sector contracted in August, say the nation's purchasing and supply executives in the latest Non-Manufacturing ISM Report On Business®.
The report was issued today by Anthony Nieves, C.P.M., CFPM, chair of the Institute for Supply Management™ Non-Manufacturing Business Survey Committee; and senior vice president — supply management for Hilton Hotels Corporation. "The NMI (Non-Manufacturing Index) registered 48.4 percent in August, 2 percentage points higher than the 46.4 percent registered in July, indicating contraction in the non-manufacturing sector for the 11th consecutive month but at a slower rate. The Non-Manufacturing Business Activity Index increased 5.2 percentage points to 51.3 percent. This is the first time this index has reflected growth since September 2008. The New Orders Index increased 1.8 percentage points to 49.9 percent, and the Employment Index increased 2 percentage points to 43.5 percent. The Prices Index increased 21.8 percentage points to 63.1 percent in August, indicating a substantial increase in prices paid from July. According to the NMI, six non-manufacturing industries reported growth in August. Respondents' comments are mixed about business conditions and the overall economy; however, there is an increase in comments indicating that there are signs of improvement going forward."
INDUSTRY PERFORMANCE (Based on the NMI)
The six industries reporting growth in August based on the NMI composite index — listed in order — are: Real Estate, Rental & Leasing; Health Care & Social Assistance; Transportation & Warehousing; Utilities; Accommodation & Food Services; and Information. The 12 industries reporting contraction in August — listed in order — are: Management of Companies & Support Services; Mining; Finance & Insurance; Arts, Entertainment & Recreation; Professional, Scientific & Technical Services; Construction; Other Services; Agriculture, Forestry, Fishing & Hunting; Wholesale Trade; Educational Services; Public Administration; and Retail Trade.
WHAT RESPONDENTS ARE SAYING ...
* "While there are promising signs in the economy pointing toward the beginnings of a recovery, the financial services industry continues to be significantly affected by the downturn. Expectations are that the pace will begin to change by Q4 '09." (Finance & Insurance)
* "Business is still soft due to overall economic conditions." (Wholesale Trade)
* "There seems to be a more positive feeling about the economy." (Educational Services)
* "Healthcare reform still has hospitals wondering how they are going to get paid at the end of the day." (Health Care & Social Assistance)
* "Occupancy shows continued strength for the summer season, still below previous years' averages by 15% to 25%." (Accommodation & Food Services)
* "Business steady — revenue down slightly; however, less than expected." (Arts, Entertainment & Recreation)
* "Good first half results. Some evidence of consumers 'trading down.' Supplier lead times are very short." (Agriculture, Forestry, Fishing & Hunting)
More at link with formatted tables
Jobless claims - 8:30am
Full report here
UNEMPLOYMENT INSURANCE WEEKLY CLAIMS REPORT
SEASONALLY ADJUSTED DATA
In the week ending Aug. 22, the advance figure for seasonally adjusted initial claims was 570,000, a decrease of 10,000 from the previous week's revised figure of 580,000. The 4-week moving average was 566,250, a decrease of 4,750 from the previous week's revised average of 571,000.
The advance seasonally adjusted insured unemployment rate was 4.6 percent for the week ending Aug. 15, a decrease of 0.1 percentage point from the prior week's unrevised rate of 4.7 percent.
The advance number for seasonally adjusted insured unemployment during the week ending Aug. 15 was 6,133,000, a decrease of 119,000 from the preceding week's revised level of 6,252,000. The 4-week moving average was 6,241,750, a decrease of 27,000 from the preceding week's revised average of 6,268,750.
The fiscal year-to-date average for seasonally adjusted insured unemployment for all programs is 5.583 million.
UNADJUSTED DATA
The advance number of actual initial claims under state programs, unadjusted, totaled 453,936 in the week ending Aug. 22, a decrease of 4,049 from the previous week. There were 345,127 initial claims in the comparable week in 2008.
The advance unadjusted insured unemployment rate was 4.3 percent during the week ending Aug. 15, a decrease of 0.1 percentage point from the prior week. The advance unadjusted number for persons claiming UI benefits in state programs totaled 5,673,467, a decrease of 135,105 from the preceding week. A year earlier, the rate was 2.4 percent and the volume was 3,175,006.
Extended benefits were available in Alabama, Alaska, Arizona, Arkansas, California, Colorado, Connecticut, Delaware, the District of Columbia, Florida, Georgia, Idaho, Illinois, Indiana, Kansas, Kentucky, Maine, Massachusetts, Michigan, Minnesota, Missouri, Nevada, New Hampshire, New Jersey, New York, North Carolina, Ohio, Oregon, Pennsylvania, Puerto Rico, Rhode Island, South Carolina, Tennessee, Texas, Vermont, Virginia, Washington, West Virginia, and Wisconsin during the week ending Aug. 8.
Initial claims for UI benefits by former Federal civilian employees totaled 1,377 in the week ending Aug. 15, a decrease of 262 from the prior week. There were 2,054 initial claims by newly discharged veterans, a decrease of 198 from the preceding week.
There were 19,783 former Federal civilian employees claiming UI benefits for the week ending Aug. 8, a decrease of 794 from the previous week. Newly discharged veterans claiming benefits totaled 30,541, an increase of 216 from the prior week.
States reported 2,916,148 persons claiming EUC (Emergency Unemployment Compensation) benefits for the week ending Aug. 8, an increase of 38,392 from the prior week. There were 1,081,755 claimants in the comparable week in 2008. EUC weekly claims include both first and second tier activity.
The highest insured unemployment rates in the week ending Aug. 8 were in Puerto Rico (7.3 percent), Oregon (6.1), Pennsylvania (6.0), Michigan (5.9), Nevada (5.8), Wisconsin (5.5), California (5.4), Connecticut (5.4), New Jersey (5.2), North Carolina (5.0), and South Carolina (5.0).
The largest increases in initial claims for the week ending Aug. 15 were in Michigan (+4,068), Pennsylvania (+1,193), Florida (+1,148), Puerto Rico (+735), and Missouri (+649), while the largest decreases were in California (-6,286), Tennessee (-2,999), Texas (-2,557), Wisconsin (-2,075), and Ohio (-1,918).
More at link with formatted tables
Pre-market - September 3, 2009
Futures up slightly this morning waiting of the Jobless claims at 8:30:
DJIA INDEX 9,341.00 64.00
S&P 500 1,002.60 8.40
NASDAQ 100 1,606.00 13.00
Today's economic calendar:
Chain Store Sales
Monster Employment Index
ECB Announcement 7:45 AM ET
Jobless Claims 8:30 AM ET
RBC CASH Index 9:00 AM ET
30-Yr Bond Announcement 9:00 AM ET
ISM Non-Mfg Index 10:00 AM ET
EIA Natural Gas Report 10:30 AM ET
3-Month Bill Announcement 11:00 AM ET
6-Month Bill Announcement 11:00 AM ET
3-Yr Note Announcement 11:00 AM ET
10-Yr Note Announcement 11:00 AM ET
Today's earnings reports:
Before market opens
AHII Animal Health International, Inc. Services Medical Equipment Wholesale
CIEN CIENA Corp. Technology Communication Equipment
DLM Del Monte Foods Co. Consumer Goods Processed & Packaged Goods
FLOW Flow International Corp. Industrial Goods Machine Tools & Accessories
JTX Jackson Hewitt Tax Service Inc. Services Personal Services
LAYN Layne Christensen Co. Industrial Goods Heavy Construction
LTXC LTX-Credence Corporation Technology Semiconductor Equipment & Materials
MDZ MDS, Inc. Healthcare Specialized Health Services
MEI Methode Electronics Inc. Technology Diversified Electronics
MOV Movado Group Inc. Consumer Goods Recreational Goods, Other
NOVN Noven Pharmaceuticals Inc. Healthcare Drug Delivery
SCMR Sycamore Networks Inc. Technology Networking & Communication Devices
TK Teekay Corporation Services Shipping
UTIW UTI Worldwide, Inc. Services Air Delivery & Freight Services
After close
ARST ArcSight, Inc. Technology Business Software & Services
CHP C&D Technologies Inc. Technology Diversified Electronics
COO The Cooper Companies Inc. Healthcare Medical Instruments & Supplies
ESL Esterline Technologies Corp. Industrial Goods Aerospace/Defense Products & Services
FMCN Focus Media Holding Ltd. Services Advertising Agencies
GIII G-III Apparel Group, Ltd. Consumer Goods Textile - Apparel Clothing
PSEM Pericom Semiconductor Corp. Technology Semiconductor - Integrated Circuits
SNDA Shanda Interactive Entertainment Ltd. Technology Internet Software & Services
SWHC Smith & Wesson Holding Corp. Industrial Goods Aerospace/Defense Products & Services
TSCM TheStreet.com, Inc. Technology Internet Information Providers
ULTA Ulta Salon, Cosmetics & Fragrance, Inc. Services Personal Services
ZQK Quiksilver Inc. Consumer Goods Textile - Apparel Clothing
Market wrap for Wednesday - 8:00am
Not much movement today. Pretty boring actually:
Dow 9,280.67 -29.93 (-0.32%)
S&P 500 994.75 -3.29 (-0.33%)
Nasdaq 1,967.07 -1.82 (-0.09%)
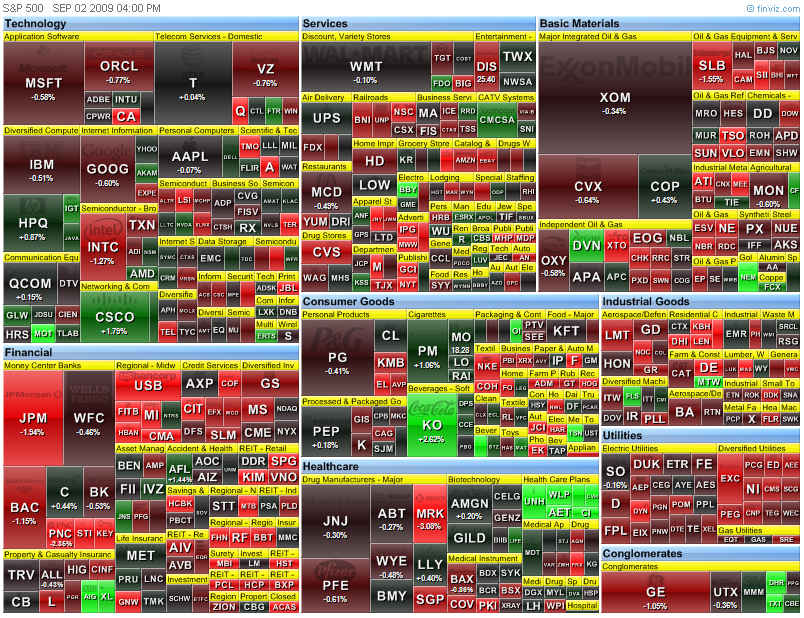
Today by sector:
 Today's heatmap:

 Today's heatmap:
Wednesday, September 2, 2009
Factory orders - 10:00am
Full report here
HIGHLIGHTS FROM THE PRELIMINARY REPORT ON MANUFACTURERS' SHIPMENTS, INVENTORIES, AND ORDERS
July 2009 --------------- Released 10:00 A.M. EDT September 2, 2009
(M3-2(09)-07)
Note: All figures in text are in seasonally adjusted current dollars
For Data - (301) 763-4673
For Questions - Chris Savage or Jessica Young
(301) 763-4832
Summary
New orders for manufactured goods in July, up five of the last six months, increased $4.6 billion or 1.3 percent to $355.5 billion, the U.S. Census Bureau reported today. This followed a 0.9 percent June increase. Excluding transportation, new orders decreased 0.7 percent. Shipments, down eleven of the last twelve months, decreased $0.2 billion to $359.7 billion. This followed a 1.8 percent June increase. Unfilled orders, down ten consecutive months, decreased $0.1 billion to $740.6 billion. This was the longest streak of consecutive monthly decreases since the series was first published on a NAICS basis in 1992. This followed a 0.8 percent June decrease. The unfilled orders-to-shipments ratio was 5.95, down from 6.00 in June. Inventories, down eleven consecutive months, decreased $3.6 billion or 0.7 percent to $503.1 billion. This was the longest streak of consecutive monthly decreases since March 2003-January 2004 and followed a 1.1 percent June decrease. The inventories-to-shipments ratio was 1.40, down from 1.41 in June.
New Orders
New orders for manufactured durable goods in July, up three of the last four months, increased $8.2 billion or 5.1 percent to $169.0 billion, revised from the previously published 4.9 percent increase. This followed a 1.1 percent June decrease.
New orders for manufactured nondurable goods decreased $3.6 billion or 1.9 percent to $186.5 billion.
Shipments
Shipments of manufactured durable goods in July, up two consecutive months, increased $3.4 billion or 2.0 percent to $173.3 billion, unchanged from the previously published increase. This followed a 0.8 percent June increase.
Shipments of manufactured nondurable goods, down following two consecutive monthly increases, decreased $3.6 billion or 1.9 percent to $186.5 billion. This followed a 2.8 percent June increase. This decrease was led by petroleum and coal products, which decreased $2.7 billion or 7.2 percent to $34.3 billion.
Unfilled Orders
Unfilled orders for manufactured durable goods in July, down ten consecutive months, decreased $0.1 billion to $740.6 billion, revised from the previously published 0.1 percent decrease. This was the longest streak of consecutive monthly decreases since the series was first published on a NAICS basis in 1992 and followed a 0.8 percent June decrease.
Inventories
Inventories of manufactured durable goods in July, down seven consecutive months, decreased $2.9 billion or 0.9 percent to $313.7 billion, revised from the previously published 0.8 percent decrease. This followed a 1.5 percent June decrease.
Inventories of manufactured nondurable goods, down eleven consecutive months, decreased $0.7 billion or 0.4 percent to $189.4 billion. This followed a 0.4 percent June decrease. Plastic and rubber products led the decrease, down $0.4 billion or 2.0 percent to $18.9 billion.
By stage of fabrication, July materials and supplies decreased 1.8 percent in durable goods and increased 0.7 percent in nondurable goods. Work in process decreased 0.1 percent in durable goods and 0.8 percent in nondurable goods. Finished goods decreased 1.1 percent in durable goods and 1.0 percent in nondurable goods.
Productivity and costs - 8:30am
Full report here
Transmission of this material is embargoed until USDL-09-1066
8:30 a.m. (EDT) Wednesday, September 2, 2009
Technical information: (202) 691-5606 • dprweb@bls.gov • www.bls.gov/lpc
Media contact: (202) 691-5902 • PressOffice@bls.gov
PRODUCTIVITY AND COSTS
Second Quarter 2009, Revised
Nonfarm business sector labor productivity increased at a 6.6 percent
annual rate during the second quarter of 2009, the U.S. Bureau of Labor
Statistics reported today. This was the largest productivity increase
since the third quarter of 2003, and reflects declines of 1.5 percent in
output and 7.6 percent in hours worked. (All quarterly percent changes in
this release are seasonally adjusted annual rates.) From the second
quarter of 2008 to the second quarter of 2009, output fell 5.5 percent
while hours fell 7.2 percent, yielding an increase in productivity of 1.9
percent (tables A and 2). Nonfarm business productivity increased at an
annual rate of 2.5 percent from 2000 through 2008.
Labor productivity, or output per hour, is calculated by dividing an index
of real output by an index of hours of all persons, including employees,
proprietors, and unpaid family workers.
Unit labor costs in nonfarm businesses fell 5.9 percent in the second
quarter of 2009, with the decline due entirely to the increase in
productivity; hourly compensation increased slightly. Unit labor costs
declined 1.2 percent over the last four quarters, as a 1.9 percent
increase in output per hour was partially offset by a 0.7 percent increase
in hourly compensation (tables A and 2).
BLS defines unit labor costs as the ratio of hourly compensation to labor
productivity; increases in hourly compensation tend to increase unit labor
costs and increases in output per hour tend to reduce them.
Productivity increased 6.5 percent in the business sector in the second
quarter of 2009. Unit labor costs decreased 6.0 percent during the second
quarter of 2009 (tables A and 1).
Manufacturing sector productivity grew 4.9 percent in the second quarter
of 2009, as output fell 9.8 percent and hours worked decreased 14.0
percent; declines in output and hours were much larger in durable goods
industries than in nondurable goods industries (tables A, 3, 4 and 5).
The productivity gain in the manufacturing sector was the largest since
the first quarter of 2005. Unit labor costs in manufacturing edged up 0.2
percent in the second quarter of 2009 and increased 6.7 percent over the
last four quarters (tables A and 3).
The data sources and methods used in the preparation of the manufacturing
output series differ from those used in preparing the business and nonfarm
business output series, and these measures are not directly comparable.
See Technical Notes for further information on data sources.
Revised measures
Table B presents previous and revised productivity and related measures
for the major sectors: business, nonfarm business and manufacturing, for
the first and second quarters of 2009.
In the second quarter of 2009, nonfarm business productivity was revised
up by 0.2 percentage point from the estimate published on August 11,
reflecting a 0.2 percentage point upward revision to output; hours were
not revised. Unit labor costs were revised down by 0.1 percentage point
in the second quarter. In the manufacturing sector, productivity was
revised down by 0.4 percentage point in the second quarter.
In the first quarter of 2009, nonfarm business productivity was not
revised. Unit labor costs fell 5.0 percent rather than decreasing 2.7
percent as previously reported, due to a 2.3 percent downward revision to
hourly compensation. In the manufacturing sector, first quarter
productivity was unrevised. Unit labor costs were revised down by 2.6
percentage points.
From the first quarter of 1987, unit labor costs, hourly compensation, and
real hourly compensation were revised in the manufacturing sector and its
subsectors. This was the result of addressing a series break between 2000
and 2001 in the manufacturing compensation series published on August 11.
The SIC-based data prior to 2001 have been linked to the NAICS-based
series. This revision eliminates the break in series at 2001 for the
manufacturing sector data based on compensation; percent changes in 2001
were revised substantially. There were small revisions to percent changes
in other years and quarters. Because the base year for the indexes (1992)
was adjusted, index values for the entire series were subject to revision.
Revised quarterly and annual series for recent years appear in tables 3-5
and revised annual indexes are displayed in appendix tables 1-3. Full
historical annual and quarterly measures can be found on the productivity
and costs home page https://www.bls.gov/lpc/#data.
More at link with formatted tables
More at link with formatted tables
ADP Employment report - 8:15am
Full report here
ADP NATIONAL EMPLOYMENT REPORT SHOWS U.S.
EMPLOYMENT DECREASED BY 298,000 PRIVATE SECTOR JOBS IN AUGUST
ROSELAND, N.J. – September 2, 2009 – According to today’s ADP National Employment Report®, private sector employment decreased by 298,000 in August. The ADP National Employment Report, created by ADP® Employer Services, a division of Automatic Data Processing, Inc. (ADP), in partnership with Macroeconomic Advisers, LLC, is derived from actual payroll data and measures the change in total nonfarm private employment each month.
Nonfarm Private Employment Highlights – August Report:
• Total employment: -298,000
• Small businesses* -122,000
• Medium businesses** -116,000
• Large businesses*** -60,000
• Goods-producing sector: -152,000
• Service-providing sector: -146,000
Addendum:
• Manufacturing industry: -74,000
* Small businesses represent payrolls with 1-49 employees
** Medium businesses represent payrolls with 50-499 employees
*** Large businesses represent payrolls with more than 499 employees
According to Joel Prakken, Chairman of Macroeconomic Advisers, LLC, “Nonfarm private employment decreased 298,000 from July to August 2009 on a seasonally adjusted basis, according to the ADP National Employment Report. August’s employment decline was the smallest since September of 2008. Employment losses are clearly diminishing. Despite recent indications that overall economic activity is stabilizing, employment, which usually trails overall economic activity, is still likely to decline for at least several more months, albeit at a diminishing rate.”
Prakken added, “August’s ADP Report estimates nonfarm private employment in the service-providing sector fell by 146,000. Employment in the goods-producing sector declined 152,000, with employment in the manufacturing sector dropping 74,000, its smallest monthly decline since July of 2008.”
“Large businesses, defined as those with 500 or more workers, saw employment decline by 60,000, while medium-size businesses with between 50 and 499 workers declined 116,000. Employment among small-size businesses, defined as those with fewer than 50 workers, declined 122,000,” said Prakken. Prakken went on to say, “In August, construction employment dropped 73,000. This was its thirty-first consecutive monthly decline, and brings the total decline in construction jobs since the peak in January 2007 to 1,562,000. Employment in the financial services sector dropped 19,000, the twenty-first consecutive monthly decline.”
More at link with formatted tables
More at link with formatted tables
Pre-market - September 2, 2009
Futures flat today waiting on economic data:
DJIA INDEX 9,303.00 0.00
S&P 500 996.40 -0.10
NASDAQ 100 1,592.25 -3.25
Today's economic calendar:
MBA Purchase Applications 7:00 AM ET
Challenger Job-Cut Report 7:30 AM ET
ADP Employment Report 8:15 AM ET
Productivity and Costs 8:30 AM ET
Factory Orders 10:00 AM ET
EIA Petroleum Status Report 10:30 AM ET
FOMC Minutes 2:00 PM ET
Today's earnings reports:
Before market opens
BF-B Brown-Forman Corporation Consumer Goods Beverages
BRLI Bio-Reference Laboratories Inc. Healthcare Medical Laboratories
BTH Blyth, Inc. Consumer Goods Personal Products
DHT DHT Maritime, Inc. Services Shipping
JOYG Joy Global, Inc. Industrial Goods Farm & Construction Machinery
SYNO Synovis Life Technologies Inc. Healthcare Medical Appliances
ZLC Zale Corporation Services Jewelry Stores
After market close:
ABM ABM Industries Inc. Services Business Services
CWST Casella Waste Systems Inc. Industrial Goods Waste Management
GEF Greif Inc. Consumer Goods Packaging & Containers
HOV Hovnanian Enterprises Inc. Industrial Goods Residential Construction
MATK Martek Biosciences Corp. Healthcare Biotechnology
NX Quanex Building Products Corporation Industrial Goods General Building Materials
OXM Oxford Industries Inc. Consumer Goods Textile - Apparel Clothing
PSS Collective Brands, Inc. Services Apparel Stores
SAI SAIC, Inc. Services Technical Services
Tuesday, September 1, 2009
Market wrap - 5:30pm
Sell off today. The questions is - a day - or more?
Dow 9,310.60 -185.68 (-1.96%)
S&P 500 998.04 -22.58 (-2.21%)
Nasdaq 1,968.89 -40.17 (-2.00%)
Gold 957 +3 +0.32%
Oil 68.35 -1.91 -2.72%
Today by sector:
 Today's heatmap:

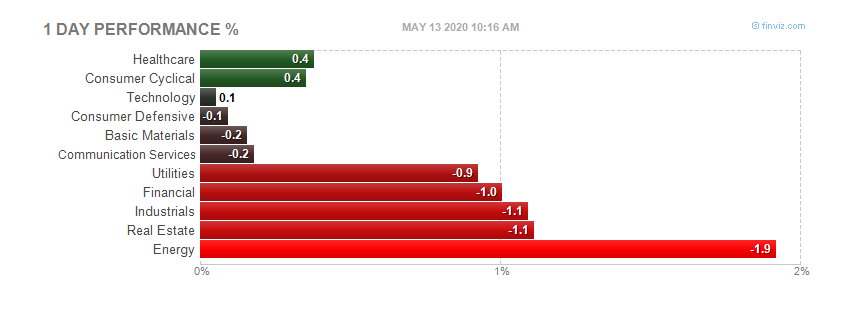 Today's heatmap:

ISM manufacturing data - 10:00am
Full report here
August 2009 Manufacturing ISM Report On Business®
PMI at 52.9%
DO NOT CONFUSE THIS NATIONAL REPORT with the various regional purchasing reports released across the country. The national report's information reflects the entire United States, while the regional reports contain primarily regional data from their local vicinities. Also, the information in the regional reports is not used in calculating the results of the national report. The information compiled in this report is for the month of August 2009.
New Orders and Production Growing
Employment and Inventories Contracting
Supplier Deliveries Slower
(Tempe, Arizona) — Economic activity in the manufacturing sector expanded in August, following 18 consecutive months of contraction, and the overall economy grew for the fourth consecutive month, say the nation's supply executives in the latest Manufacturing ISM Report On Business®.
The report was issued today by Norbert J. Ore, CPSM, C.P.M., chair of the Institute for Supply Management™ Manufacturing Business Survey Committee. "The year-and-a-half decline in manufacturing output has come to an end, as 11 of 18 manufacturing industries are reporting growth when comparing August to July. While this is certainly a positive occurrence, we have to keep in mind that it is the beginning of a new cycle and that all industries are not yet participating in the growth. The August index of 52.9 percent is the highest since June 2007. The 4 percentage point increase was driven by significant strength in the New Orders Index, which is up 9.6 points to 64.9 percent, the highest since December 2004. The growth appears sustainable in the short term, as inventories have been reduced for 40 consecutive months and supply chains will have to re-stock to meet this new demand."
PERFORMANCE BY INDUSTRY
Eleven of the 18 manufacturing industries reported growth in August. These industries — listed in order — are: Textile Mills; Apparel, Leather & Allied Products; Paper Products; Miscellaneous Manufacturing; Printing & Related Support Activities; Computer & Electronic Products; Transportation Equipment; Nonmetallic Mineral Products; Electrical Equipment, Appliances & Components; Fabricated Metal Products; and Chemical Products. The six industries reporting contraction in August — listed in order — are: Primary Metals; Plastics & Rubber Products; Furniture & Related Products; Wood Products; Food, Beverage & Tobacco Products; and Machinery.
WHAT RESPONDENTS ARE SAYING ...
* "Production is picking up as demand [for] orders is being accelerated." (Nonmetallic Mineral Products)
* "Demand from automotive manufacturers increasing thanks to 'Cash for Clunkers.'" (Fabricated Metal Products)
* "In addition to improved business come the complications of a supply chain drained of inventory." (Paper Products)
* "The sudden increase in customer demand, plus the low inventories held at services centers, is causing a shortage in the supply of raw steel." (Transportation Equipment)
* "[It] appears customers' inventories are getting low, and they are cautiously placing orders." (Apparel, Leather & Allied Products)
More at link with formatted tables
More at link with formatted tables
Construction spending - 10:00am
Full report here
JULY 2009 CONSTRUCTION AT $958.0 BILLION ANNUAL RATE
The U.S. Census Bureau of the Department of Commerce announced today that construction spending during July 2009 was estimated at a seasonally adjusted annual rate of $958.0 billion, 0.2 percent (±1.6%)* below the revised June estimate of $959.5 billion. The July figure is 10.5 percent (±1.8%) below the July 2008 estimate of $1,070.2 billion. During the first 7 months of this year, construction spending amounted to $543.8 billion, 11.4 percent (±1.3%) below the $613.5 billion for the same period in 2008.
PRIVATE CONSTRUCTION
Spending on private construction was at a seasonally adjusted annual rate of $630.4 billion, 0.1 percent (±1.0%)* above the revised June estimate of $629.6 billion. Residential construction was at a seasonally adjusted annual rate of $245.6 billion in July, 2.3 percent (±1.3%) above the revised June estimate of $240.1 billion. Nonresidential construction was at a seasonally adjusted annual rate of $384.9 billion in July, 1.2 percent (±1.0%) below the revised June estimate of $389.5
billion.
PUBLIC CONSTRUCTION
In July, the estimated seasonally adjusted annual rate of public construction spending was $327.6 billion, 0.7 percent (±2.6%)* below the revised June estimate of $329.9 billion. Educational construction was at a seasonally adjusted annual rate of $90.8 billion, 1.3 percent (±3.7%)* below the revised June estimate of $92.0 illion. Highway construction was at a seasonally adjusted annual rate of $83.8 billion, 1.0 percent (±7.0%)* below the revised June estimate of $84.7 billion.
August 2009 data will be released on October 1, 2009 at 10:00 A.M. EDT.
For more detailed data and methodologies, go to our website:http://www.census.gov/constructionspending
Pending home sales index - 10:00am
Full report here
Washington, September 01, 2009
Contract activity for pending home sales has risen for six straight months, a pattern not seen in the history of the index since it began in 2001, according to the National Association of Realtors®.
The Pending Home Sales Index,1 a forward-looking indicator based on contracts signed in July, increased 3.2 percent to 97.6 from a reading of 94.6 in June, and is 12.0 percent higher than July 2008 when it was 87.1. The index is at the highest level since June 2007 when it was 100.7.
Lawrence Yun, NAR chief economist, said the housing market momentum has clearly turned for the better. “The recovery is broad-based across many parts of the country. Housing affordability has been at record highs this year with the added stimulus of a first-time buyer tax credit,” he said.
Pending Home Sales on a Record Roll
Washington, September 01, 2009
Contract activity for pending home sales has risen for six straight months, a pattern not seen in the history of the index since it began in 2001, according to the National Association of Realtors®.
The Pending Home Sales Index,1 a forward-looking indicator based on contracts signed in July, increased 3.2 percent to 97.6 from a reading of 94.6 in June, and is 12.0 percent higher than July 2008 when it was 87.1. The index is at the highest level since June 2007 when it was 100.7.
Lawrence Yun, NAR chief economist, said the housing market momentum has clearly turned for the better. “The recovery is broad-based across many parts of the country. Housing affordability has been at record highs this year with the added stimulus of a first-time buyer tax credit,” he said.
“Other buyers are taking advantage of low home values before prices turn higher. Nationally, the typical mortgage payment now takes less than 25 percent of a middle-income family’s monthly income to buy a median priced home, with payment percentages so far in 2009 being the lowest on record dating back to 1970. As long as home buyers stay within their budget, mortgage payments will be very manageable,” Yun said.
NAR estimates that about 1.8 to 2.0 million first-time buyers will take advantage of the $8,000 tax credit this year, with approximately 350,000 additional sales that would not have taken place without the credit. Buyers have little time to act because they must complete the transaction by November 30 to qualify for the credit. Unless extended, contracts signed but not completed by that date will not be eligible – it is taking approximately two months to complete home sales in the current market.
The Pending Home Sales Index in the Northeast declined 3.0 percent to 78.8 in July but is 4.7 percent higher than July 2008. In the Midwest the index slipped 2.0 percent to 88.1 but is 8.1 percent above a year ago. In the South, pending home sales activity rose 3.1 percent to an index of 103.8 in July and is 12.0 percent above July 2008. In the West the index jumped 12.1 percent to 112.5 and is 20.0 percent above a year ago.
NAR President Charles McMillan, a broker with Coldwell Banker Residential Brokerage in Dallas-Fort Worth, said Congress needs to keep the momentum going. “Even with a good recovery taking place, the market is not yet back to normal. With a gradual absorption of inventory, we are on the cusp of a general stabilization in home prices,” he said.
“To ensure that housing has a broad stimulus to the overall economy and stays on sound footing, we’re encouraging Congress to extend the tax credit into 2010, and to expand it to all buyers of primary residences. The faster we stabilize home prices, the fewer families will face foreclosure and the quicker credit can be extended to other sectors of the economy,” McMillan said.
NAR’s Housing Affordability Index2 stood at 158.5 in July, below the peak set in April but is still 36.0 percentage points higher than a year ago. The HAI is a broad measure of housing affordability using consistent values and assumptions over time, which examines the relationship between home prices, mortgage interest rates and family income.
Yun expects existing-home sales to rise through the fourth quarter. “Unless the tax credit is extended, no one should be surprised to see home sales drop in the first quarter of next year,” he said. “However, the fundamentals of the housing market and the economy are trending up, and we expect home sales to generally pick up in the second quarter of 2010. The buyer psychology may be shifting from, ‘Why buy now when I can purchase later,’ to ‘I don’t want to miss out on a recovery’.”
The National Association of Realtors®, “The Voice for Real Estate,” is America’s largest trade association, representing 1.2 million members involved in all aspects of the residential and commercial real estate industries.
Pre-market - September 1, 2009 - 8:10am
Futures down this morning waiting on various data later in the morning.
DJIA INDEX 9,439.00 -47.00
S&P 500 1,014.60 -5.10
NASDAQ 100 1,618.50 -6.50
Today's economic calendar:
Motor Vehicle Sales
ICSC-Goldman Store Sales 7:45 AM ET
Redbook 8:55 AM ET
ISM Mfg Index 10:00 AM ET
Construction Spending 10:00 AM ET
Pending Home Sales Index 10:00 AM ET
4-Week Bill Auction 1:00 PM ET
Today's earnings reports:
Before market opens
CMED China Medical Technologies Inc. Healthcare Medical Instruments & Supplies
CPY CPI Corp. Services Personal Services
CRMT America's Car-Mart Inc. Services Auto Dealerships
EDAP EDAP TMS SA Healthcare Medical Appliances & Equipment
GIGM GigaMedia Ltd. Technology Internet Software & Services
GMTN Gander Mountain Co. Services Specialty Retail, Other
RAIL FreightCar America Inc. Services Railroads
TUTR Plato Learning, Inc. Services Business Services
After market close
ADCT ADC Telecommunications Inc. Technology Communication Equipment
APSG Applied Signal Technology, Inc. Technology Communication Equipment
AVAV AeroVironment, Inc. Industrial Goods Aerospace/Defense Products & Services
DCI Donaldson Company Inc. Industrial Goods Pollution & Treatment Controls
PAY VeriFone Holdings, Inc. Consumer Goods Business Equipment
PIKE Pike Electric Corporation Industrial Goods General Contractors
SEAC SeaChange International Inc. Technology Processing Systems & Products
TTWO Take-Two Interactive Software Inc. Technology Multimedia & Graphics Software
Market wrap - the next morning - 8:05am
Slow market today. Gapped down at open and pretty much stayed there. Volume low, not much to get excited about.
Dow 9,496.28 -47.92 (-0.50%)
S&P 500 1,020.62 -8.31 (-0.81%)
Nasdaq 2,009.06 -19.71 (-0.97%)
Today by sector:
 Today's heatmap:

 Today's heatmap:
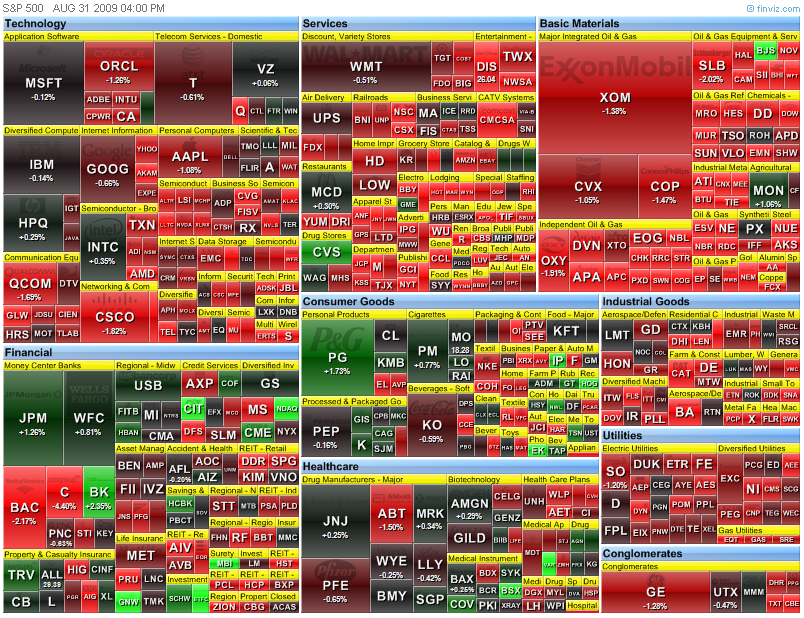
Monday, August 31, 2009
Pre-market - August 31,2009 - 7:45am
Futures down this morning after a sell off in Asia overnight
DJIA INDEX 9,482.00 -54.00 9,538.00
S&P 500 1,021.90 -5.50
NASDAQ 100 1,632.00 -10.50
Gold 959 12 1.21%
Oil 71.42 -1.32 -1.82%
Today's economic calendar:
Chicago PMI 9:45 AM ET
4-Week Bill Announcement 11:00 AM ET
3-Month Bill Auction 1:00 PM ET
6-Month Bill Auction 1:00 PM ET
Farm Prices 3:00 PM ET
Today's earnings reports:
Before open:
CMM China Mass Media Corp. Services Advertising Agencies
JAVA Sun Microsystems Inc. Technology Diversified Computer Systems
After close:
BNHNA Benihana Inc. Services Restaurants
CFI Culp Inc. Industrial Goods Textile Industrial
FMCN Focus Media Holding Ltd. Services Advertising Agencies
SINA Sina Corp. Technology Internet Software & Services
Subscribe to:
Posts (Atom)

