Friday, December 11, 2009
Rolling Stone article from Matt Taibbi - Wow!
Link to Rolling Stone article here.
Obama's Big Sellout
The president has packed his economic team with Wall Street insiders intent on turning the bailout into an all-out giveaway
MATT TAIBBI
Posted Dec 09, 2009 2:35 PM
Barack Obama ran for president as a man of the people, standing up to Wall Street as the global economy melted down in that fateful fall of 2008. He pushed a tax plan to soak the rich, ripped NAFTA for hurting the middle class and tore into John McCain for supporting a bankruptcy bill that sided with wealthy bankers "at the expense of hardworking Americans." Obama may not have run to the left of Samuel Gompers or Cesar Chavez, but it's not like you saw him on the campaign trail flanked by bankers from Citigroup and Goldman Sachs. What inspired supporters who pushed him to his historic win was the sense that a genuine outsider was finally breaking into an exclusive club, that walls were being torn down, that things were, for lack of a better or more specific term, changing.
Then he got elected.
What's taken place in the year since Obama won the presidency has turned out to be one of the most dramatic political about-faces in our history. Elected in the midst of a crushing economic crisis brought on by a decade of orgiastic deregulation and unchecked greed, Obama had a clear mandate to rein in Wall Street and remake the entire structure of the American economy. What he did instead was ship even his most marginally progressive campaign advisers off to various bureaucratic Siberias, while packing the key economic positions in his White House with the very people who caused the crisis in the first place. This new team of bubble-fattened ex-bankers and laissez-faire intellectuals then proceeded to sell us all out, instituting a massive, trickle-up bailout and systematically gutting regulatory reform from the inside.
How could Obama let this happen? Is he just a rookie in the political big leagues, hoodwinked by Beltway old-timers? Or is the vacillating, ineffectual servant of banking interests we've been seeing on TV this fall who Obama really is?
Whatever the president's real motives are, the extensive series of loophole-rich financial "reforms" that the Democrats are currently pushing may ultimately do more harm than good. In fact, some parts of the new reforms border on insanity, threatening to vastly amplify Wall Street's political power by institutionalizing the taxpayer's role as a welfare provider for the financial-services industry. At one point in the debate, Obama's top economic advisers demanded the power to award future bailouts without even going to Congress for approval — and without providing taxpayers a single dime in equity on the deals.
How did we get here? It started just moments after the election — and almost nobody noticed.
'Just look at the timeline of the Citigroup deal," says one leading Democratic consultant. "Just look at it. It's fucking amazing. Amazing! And nobody said a thing about it."
Barack Obama was still just the president-elect when it happened, but the revolting and inexcusable $306 billion bailout that Citigroup received was the first major act of his presidency. In order to grasp the full horror of what took place, however, one needs to go back a few weeks before the actual bailout — to November 5th, 2008, the day after Obama's election.
That was the day the jubilant Obama campaign announced its transition team. Though many of the names were familiar — former Bill Clinton chief of staff John Podesta, long-time Obama confidante Valerie Jarrett — the list was most notable for who was not on it, especially on the economic side. Austan Goolsbee, a University of Chicago economist who had served as one of Obama's chief advisers during the campaign, didn't make the cut. Neither did Karen Kornbluh, who had served as Obama's policy director and was instrumental in crafting the Democratic Party's platform. Both had emphasized populist themes during the campaign: Kornbluh was known for pushing Democrats to focus on the plight of the poor and middle class, while Goolsbee was an aggressive critic of Wall Street, declaring that AIG executives should receive "a Nobel Prize — for evil."
But come November 5th, both were banished from Obama's inner circle — and replaced with a group of Wall Street bankers. Leading the search for the president's new economic team was his close friend and Harvard Law classmate Michael Froman, a high-ranking executive at Citigroup. During the campaign, Froman had emerged as one of Obama's biggest fundraisers, bundling $200,000 in contributions and introducing the candidate to a host of heavy hitters — chief among them his mentor Bob Rubin, the former co-chairman of Goldman Sachs who served as Treasury secretary under Bill Clinton. Froman had served as chief of staff to Rubin at Treasury, and had followed his boss when Rubin left the Clinton administration to serve as a senior counselor to Citigroup (a massive new financial conglomerate created by deregulatory moves pushed through by Rubin himself).
Incredibly, Froman did not resign from the bank when he went to work for Obama: He remained in the employ of Citigroup for two more months, even as he helped appoint the very people who would shape the future of his own firm. And to help him pick Obama's economic team, Froman brought in none other than Jamie Rubin, a former Clinton diplomat who happens to be Bob Rubin's son. At the time, Jamie's dad was still earning roughly $15 million a year working for Citigroup, which was in the midst of a collapse brought on in part because Rubin had pushed the bank to invest heavily in mortgage-backed CDOs and other risky instruments.
Now here's where it gets really interesting. It's three weeks after the election. You have a lame-duck president in George W. Bush — still nominally in charge, but in reality already halfway to the golf-and-O'Doul's portion of his career and more than happy to vacate the scene. Left to deal with the still-reeling economy are lame-duck Treasury Secretary Henry Paulson, a former head of Goldman Sachs, and New York Fed chief Timothy Geithner, who served under Bob Rubin in the Clinton White House. Running Obama's economic team are a still-employed Citigroup executive and the son of another Citigroup executive, who himself joined Obama's transition team that same month.
So on November 23rd, 2008, a deal is announced in which the government will bail out Rubin's messes at Citigroup with a massive buffet of taxpayer-funded cash and guarantees. It is a terrible deal for the government, almost universally panned by all serious economists, an outrage to anyone who pays taxes. Under the deal, the bank gets $20 billion in cash, on top of the $25 billion it had already received just weeks before as part of the Troubled Asset Relief Program. But that's just the appetizer. The government also agrees to charge taxpayers for up to $277 billion in losses on troubled Citi assets, many of them those toxic CDOs that Rubin had pushed Citi to invest in. No Citi executives are replaced, and few restrictions are placed on their compensation. It's the sweetheart deal of the century, putting generations of working-stiff taxpayers on the hook to pay off Bob Rubin's fuck-up-rich tenure at Citi. "If you had any doubts at all about the primacy of Wall Street over Main Street," former labor secretary Robert Reich declares when the bailout is announced, "your doubts should be laid to rest."
It is bad enough that one of Bob Rubin's former protégés from the Clinton years, the New York Fed chief Geithner, is intimately involved in the negotiations, which unsurprisingly leave the Federal Reserve massively exposed to future Citi losses. But the real stunner comes only hours after the bailout deal is struck, when the Obama transition team makes a cheerful announcement: Timothy Geithner is going to be Barack Obama's Treasury secretary!
Geithner, in other words, is hired to head the U.S. Treasury by an executive from Citigroup — Michael Froman — before the ink is even dry on a massive government giveaway to Citigroup that Geithner himself was instrumental in delivering. In the annals of brazen political swindles, this one has to go in the all-time Fuck-the-Optics Hall of Fame.
Wall Street loved the Citi bailout and the Geithner nomination so much that the Dow immediately posted its biggest two-day jump since 1987, rising 11.8 percent. Citi shares jumped 58 percent in a single day, and JP Morgan Chase, Merrill Lynch and Morgan Stanley soared more than 20 percent, as Wall Street embraced the news that the government's bailout generosity would not die with George W. Bush and Hank Paulson. "Geithner assures a smooth transition between the Bush administration and that of Obama, because he's already co-managing what's happening now," observed Stephen Leeb, president of Leeb Capital Management.
Left unnoticed, however, was the fact that Geithner had been hired by a sitting Citigroup executive who still had a big bonus coming despite his proximity to Obama. In January 2009, just over a month after the bailout, Citigroup paid Froman a year-end bonus of $2.25 million. But as outrageous as it was, that payoff would prove to be chump change for the banker crowd, who were about to get everything they wanted — and more — from the new president.
The irony of Bob Rubin: He's an unapologetic arch-capitalist demagogue whose very career is proof that a free-market meritocracy is a myth. Much like Alan Greenspan, a staggeringly incompetent economic forecaster who was worshipped by four decades of politicians because he once dated Barbara Walters, Rubin has been held in awe by the American political elite for nearly 20 years despite having fucked up virtually every project he ever got his hands on. He went from running Goldman Sachs (1990-1992) to the Clinton White House (1993-1999) to Citigroup (1999-2009), leaving behind a trail of historic gaffes that somehow boosted his stature every step of the way.
As Treasury secretary under Clinton, Rubin was the driving force behind two monstrous deregulatory actions that would be primary causes of last year's financial crisis: the repeal of the Glass-Steagall Act (passed specifically to legalize the Citigroup megamerger) and the deregulation of the derivatives market. Having set that time bomb, Rubin left government to join Citi, which promptly expressed its gratitude by giving him $126 million in compensation over the next eight years (they don't call it bribery in this country when they give you the money post factum). After urging management to amp up its risky investments in toxic vehicles, a strategy that very nearly destroyed the company, Rubin blamed Citi's board for his screw-ups and complained that he had been underpaid to boot. "I bet there's not a single year where I couldn't have gone somewhere else and made more," he said.
Despite being perhaps more responsible for last year's crash than any other single living person — his colossally stupid decisions at both the highest levels of government and the management of a private financial superpower make him unique — Rubin was the man Barack Obama chose to build his White House around.
There are four main ways to be connected to Bob Rubin: through Goldman Sachs, the Clinton administration, Citigroup and, finally, the Hamilton Project, a think tank Rubin spearheaded under the auspices of the Brookings Institute to promote his philosophy of balanced budgets, free trade and financial deregulation. The team Obama put in place to run his economic policy after his inauguration was dominated by people who boasted connections to at least one of these four institutions — so much so that the White House now looks like a backstage party for an episode of Bob Rubin, This Is Your Life!
At Treasury, there is Geithner, who worked under Rubin in the Clinton years. Serving as Geithner's "counselor" — a made-up post not subject to Senate confirmation — is Lewis Alexander, the former chief economist of Citigroup, who advised Citi back in 2007 that the upcoming housing crash was nothing to worry about. Two other top Geithner "counselors" — Gene Sperling and Lael Brainard — worked under Rubin at the National Economic Council, the key group that coordinates all economic policymaking for the White House.
As director of the NEC, meanwhile, Obama installed economic czar Larry Summers, who had served as Rubin's protégé at Treasury. Just below Summers is Jason Furman, who worked for Rubin in the Clinton White House and was one of the first directors of Rubin's Hamilton Project. The appointment of Furman — a persistent advocate of free-trade agreements like NAFTA and the author of droolingly pro-globalization reports with titles like "Walmart: A Progressive Success Story" — provided one of the first clues that Obama had only been posturing when he promised crowds of struggling Midwesterners during the campaign that he would renegotiate NAFTA, which facilitated the flight of blue-collar jobs to other countries. "NAFTA's shortcomings were evident when signed, and we must now amend the agreement to fix them," Obama declared. A few months after hiring Furman to help shape its economic policy, however, the White House quietly quashed any talk of renegotiating the trade deal. "The president has said we will look at all of our options, but I think they can be addressed without having to reopen the agreement," U.S. Trade Representative Ronald Kirk told reporters in a little-publicized conference call last April.
The announcement was not so surprising, given who Obama hired to serve alongside Furman at the NEC: management consultant Diana Farrell, who worked under Rubin at Goldman Sachs. In 2003, Farrell was the author of an infamous paper in which she argued that sending American jobs overseas might be "as beneficial to the U.S. as to the destination country, probably more so."
Joining Summers, Furman and Farrell at the NEC is Froman, who by then had been formally appointed to a unique position: He is not only Obama's international finance adviser at the National Economic Council, he simultaneously serves as deputy national security adviser at the National Security Council. The twin posts give Froman a direct line to the president, putting him in a position to coordinate Obama's international economic policy during a crisis. He'll have help from David Lipton, another joint appointee to the economics and security councils who worked with Rubin at Treasury and Citigroup, and from Jacob Lew, a former Citi colleague of Rubin's whom Obama named as deputy director at the State Department to focus on international finance.
Over at the Commodity Futures Trading Commission, which is supposed to regulate derivatives trading, Obama appointed Gary Gensler, a former Goldman banker who worked under Rubin in the Clinton White House. Gensler had been instrumental in helping to pass the infamous Commodity Futures Modernization Act of 2000, which prevented deregulation of derivative instruments like CDOs and credit-default swaps that played such a big role in cratering the economy last year. And as head of the powerful Office of Management and Budget, Obama named Peter Orszag, who served as the first director of Rubin's Hamilton Project. Orszag once succinctly summed up the project's ideology as a sort of liberal spin on trickle-down Reaganomics: "Market competition and globalization generate significant economic benefits."
Taken together, the rash of appointments with ties to Bob Rubin may well represent the most sweeping influence by a single Wall Street insider in the history of government. "Rather than having a team of rivals, they've got a team of Rubins," says Steven Clemons, director of the American Strategy Program at the New America Foundation. "You see that in policy choices that have resuscitated — but not reformed — Wall Street."
While Rubin's allies and acolytes got all the important jobs in the Obama administration, the academics and progressives got banished to semi-meaningless, even comical roles. Kornbluh was rewarded for being the chief policy architect of Obama's meteoric rise by being outfitted with a pith helmet and booted across the ocean to Paris, where she now serves as America's never-again-to-be-seen-on-TV ambassador to the Organization for Economic Cooperation and Development. Goolsbee, meanwhile, was appointed as staff director of the President's Economic Recovery Advisory Board, a kind of dumping ground for Wall Street critics who had assisted Obama during the campaign; one top Democrat calls the panel "Siberia."
Joining Goolsbee as chairman of the PERAB gulag is former Fed chief Paul Volcker, who back in March 2008 helped candidate Obama write a speech declaring that the deregulatory efforts of the Eighties and Nineties had "excused and even embraced an ethic of greed, corner-cutting, insider dealing, things that have always threatened the long-term stability of our economic system." That speech met with rapturous applause, but the commission Obama gave Volcker to manage is so toothless that it didn't even meet for the first time until last May. The lone progressive in the White House, economist Jared Bernstein, holds the impressive-sounding title of chief economist and national policy adviser — except that the man he is advising is Joe Biden, who seems more interested in foreign policy than financial reform.
The significance of all of these appointments isn't that the Wall Street types are now in a position to provide direct favors to their former employers. It's that, with one or two exceptions, they collectively offer a microcosm of what the Democratic Party has come to stand for in the 21st century. Virtually all of the Rubinites brought in to manage the economy under Obama share the same fundamental political philosophy carefully articulated for years by the Hamilton Project: Expand the safety net to protect the poor, but let Wall Street do whatever it wants. "Bob Rubin, these guys, they're classic limousine liberals," says David Sirota, a former Democratic strategist. "These are basically people who have made shitloads of money in the speculative economy, but they want to call themselves good Democrats because they're willing to give a little more to the poor. That's the model for this Democratic Party: Let the rich do their thing, but give a fraction more to everyone else."
Even the members of Obama's economic team who have spent most of their lives in public office have managed to make small fortunes on Wall Street. The president's economic czar, Larry Summers, was paid more than $5.2 million in 2008 alone as a managing director of the hedge fund D.E. Shaw, and pocketed an additional $2.7 million in speaking fees from a smorgasbord of future bailout recipients, including Goldman Sachs and Citigroup. At Treasury, Geithner's aide Gene Sperling earned a staggering $887,727 from Goldman Sachs last year for performing the punch-line-worthy service of "advice on charitable giving." Sperling's fellow Treasury appointee, Mark Patterson, received $637,492 as a full-time lobbyist for Goldman Sachs, and another top Geithner aide, Lee Sachs, made more than $3 million working for a New York hedge fund called Mariner Investment Group. The list goes on and on. Even Obama's chief of staff, Rahm Emanuel, who has been out of government for only 30 months of his adult life, managed to collect $18 million during his private-sector stint with a Wall Street firm called Wasserstein-Perella.
The point is that an economic team made up exclusively of callous millionaire-assholes has absolutely zero interest in reforming the gamed system that made them rich in the first place. "You can't expect these people to do anything other than protect Wall Street," says Rep. Cliff Stearns, a Republican from Florida. That thinking was clear from Obama's first address to Congress, when he stressed the importance of getting Americans to borrow like crazy again. "Credit is the lifeblood of the economy," he declared, pledging "the full force of the federal government to ensure that the major banks that Americans depend on have enough confidence and enough money." A president elected on a platform of change was announcing, in so many words, that he planned to change nothing fundamental when it came to the economy. Rather than doing what FDR had done during the Great Depression and institute stringent new rules to curb financial abuses, Obama planned to institutionalize the policy, firmly established during the Bush years, of keeping a few megafirms rich at the expense of everyone else.
Obama hasn't always toed the Rubin line when it comes to economic policy. Despite being surrounded by a team that is powerfully opposed to deficit spending — balanced budgets and deficit reduction have always been central to the Rubin way of thinking — Obama came out of the gate with a huge stimulus plan designed to kick-start the economy and address the job losses brought on by the 2008 crisis. "You have to give him credit there," says Sen. Bernie Sanders, an advocate of using government resources to address unemployment. "It's a very significant piece of legislation, and $787 billion is a lot of money."
But whatever jobs the stimulus has created or preserved so far — 640,329, according to an absurdly precise and already debunked calculation by the White House — the aid that Obama has provided to real people has been dwarfed in size and scope by the taxpayer money that has been handed over to America's financial giants. "They spent $75 billion on mortgage relief, but come on — look at how much they gave Wall Street," says a leading Democratic strategist. Neil Barofsky, the inspector general charged with overseeing TARP, estimates that the total cost of the Wall Street bailouts could eventually reach $23.7 trillion. And while the government continues to dole out big money to big banks, Obama and his team of Rubinites have done almost nothing to reform the warped financial system responsible for imploding the global economy in the first place.
The push for reform seemed to get off to a promising start. In the House, the charge was led by Rep. Barney Frank, the outspoken chair of the House Financial Services Committee, who emerged during last year's Bush bailouts as a sharp-tongued critic of Wall Street. Back when Obama was still a senator, he and Frank even worked together to introduce a populist bill targeting executive compensation. Last spring, with the economy shattered, Frank began to hold hearings on a host of reforms, crafted with significant input from the White House, that initially contained some very good elements. There were measures to curb abusive credit-card lending, prevent banks from charging excessive fees, force publicly traded firms to conduct meaningful risk assessment and allow shareholders to vote on executive compensation. There were even measures to crack down on risky derivatives and to bar firms like AIG from picking their own regulators.
Then the committee went to work — and the loopholes started to appear.
The most notable of these came in the proposal to regulate derivatives like credit-default swaps. Even Gary Gensler, the former Goldmanite whom Obama put in charge of commodities regulation, was pushing to make these normally obscure investments more transparent, enabling regulators and investors to identify speculative bubbles sooner. But in August, a month after Gensler came out in favor of reform, Geithner slapped him down by issuing a 115-page paper called "Improvements to Regulation of Over-the-Counter Derivatives Markets" that called for a series of exemptions for "end users" — i.e., almost all of the clients who buy derivatives from banks like Goldman Sachs and Morgan Stanley. Even more stunning, Frank's bill included a blanket exception to the rules for currency swaps traded on foreign exchanges — the very instruments that had triggered the Long-Term Capital Management meltdown in the late 1990s.
Given that derivatives were at the heart of the financial meltdown last year, the decision to gut derivatives reform sent some legislators howling with disgust. Sen. Maria Cantwell of Washington, who estimates that as much as 90 percent of all derivatives could remain unregulated under the new rules, went so far as to say the new laws would make things worse. "Current law with its loopholes might actually be better than these loopholes," she said.
An even bigger loophole could do far worse damage to the economy. Under the original bill, the Securities and Exchange Commission and the Commodity Futures Trading Commission were granted the power to ban any credit swaps deemed to be "detrimental to the stability of a financial market or of participants in a financial market." By the time Frank's committee was done with the bill, however, the SEC and the CFTC were left with no authority to do anything about abusive derivatives other than to send a report to Congress. The move, in effect, would leave the kind of credit-default swaps that brought down AIG largely unregulated.
Why would leading congressional Democrats, working closely with the Obama administration, agree to leave one of the riskiest of all financial instruments unregulated, even before the issue could be debated by the House? "There was concern that a broad grant to ban abusive swaps would be unsettling," Frank explained.
Unsettling to whom? Certainly not to you and me — but then again, actual people are not really part of the calculus when it comes to finance reform. According to those close to the markup process, Frank's committee inserted loopholes under pressure from "constituents" — by which they mean anyone "who can afford a lobbyist," says Michael Greenberger, the former head of trading at the CFTC under Clinton.
This pattern would repeat itself over and over again throughout the fall. Take the centerpiece of Obama's reform proposal: the much-ballyhooed creation of a Consumer Finance Protection Agency to protect the little guy from abusive bank practices. Like the derivatives bill, the debate over the CFPA ended up being dominated by horse-trading for loopholes. In the end, Frank not only agreed to exempt some 8,000 of the nation's 8,200 banks from oversight by the castrated-in-advance agency, leaving most consumers unprotected, he allowed the committee to pass the exemption by voice vote, meaning that congressmen could side with the banks without actually attaching their name to their "Aye."
To win the support of conservative Democrats, Frank also backed down on another issue that seemed like a slam-dunk: a requirement that all banks offer so-called "plain vanilla" products, such as no-frills mortgages, to give consumers an alternative to deceptive, "fully loaded" deals like adjustable-rate loans. Frank's last-minute reversal — made in consultation with Geithner — was such a transparent giveaway to the banks that even an economics writer for Reuters, hardly a far-left source, called it "the beginning of the end of meaningful regulatory reform."
But the real kicker came when Frank's committee took up what is known as "resolution authority" — government-speak for "Who the hell is in charge the next time somebody at AIG or Lehman Brothers decides to vaporize the economy?" What the committee initially introduced bore a striking resemblance to a proposal written by Geithner earlier in the summer. A masterpiece of legislative chicanery, the measure would have given the White House permanent and unlimited authority to execute future bailouts of megaconglomerates like Citigroup and Bear Stearns.
Democrats pushed the move as politically uncontroversial, claiming that the bill will force Wall Street to pay for any future bailouts and "doesn't use taxpayer money." In reality, that was complete bullshit. The way the bill was written, the FDIC would basically borrow money from the Treasury — i.e., from ordinary taxpayers — to bail out any of the nation's two dozen or so largest financial companies that the president deems in need of government assistance. After the bailout is executed, the president would then levy a tax on financial firms with assets of more than $10 billion to repay the Treasury within 60 months — unless, that is, the president decides he doesn't want to! "They can wait indefinitely to repay," says Rep. Brad Sherman of California, who dubbed the early version of the bill "TARP on steroids."
The new bailout authority also mandated that future bailouts would not include an exchange of equity "in any form" — meaning that taxpayers would get nothing in return for underwriting Wall Street's mistakes. Even more outrageous, it specifically prohibited Congress from rejecting tax giveaways to Wall Street, as it did last year, by removing all congressional oversight of future bailouts. In fact, the resolution authority proposed by Frank was such a slurpingly obvious blow job of Wall Street that it provoked a revolt among his own committee members, with junior Democrats waging a spirited fight that restored congressional oversight to future bailouts, requires equity for taxpayer money and caps assistance to troubled firms at $150 billion. Another amendment to force companies with more than $50 billion in assets to pay into a rainy-day fund for bailouts passed by a resounding vote of 52 to 17 — with the "Nays" all coming from Frank and other senior Democrats loyal to the administration.
Even as amended, however, resolution authority still has the potential to be truly revolutionary legislation. The Senate version still grants the president unlimited power over equity-free bailouts, and the amended House bill still institutionalizes a system of taxpayer support for the 20 to 25 biggest banks in the country. It would essentially grant economic immortality to those top few megafirms, who will continually gobble up greater and greater slices of market share as money becomes cheaper and cheaper for them to borrow (after all, who wouldn't lend to a company permanently backstopped by the federal government?). It would also formalize the government's role in the global economy and turn the presidential-appointment process into an important part of every big firm's business strategy. "If this passes, the very first thing these companies are going to do in the future is ask themselves, 'How do we make sure that one of our executives becomes assistant Treasury secretary?'" says Sherman.
On the Senate side, finance reform has yet to make it through the markup process, but there's every reason to believe that its final bill will be as watered down as the House version by the time it comes to a vote. The original measure, drafted by chairman Christopher Dodd of the Senate Banking Committee, is surprisingly tough on Wall Street — a fact that almost everyone in town chalks up to Dodd's desperation to shake the bad publicity he incurred by accepting a sweetheart mortgage from the notorious lender Countrywide. "He's got to do the shake-his-fist-at-Wall Street thing because of his, you know, problems," says a Democratic Senate aide. "So that's why the bill is starting out kind of tough."
The aide pauses. "The question is, though, what will it end up looking like?"
He's right — that is the question. Because the way it works is that all of these great-sounding reforms get whittled down bit by bit as they move through the committee markup process, until finally there's nothing left but the exceptions. In one example, a measure that would have forced financial companies to be more accountable to shareholders by holding elections for their entire boards every year has already been watered down to preserve the current system of staggered votes. In other cases, this being the Senate, loopholes were inserted before the debate even began: The Dodd bill included the exemption for foreign-currency swaps — a gift to Wall Street that only appeared in the Frank bill during the course of hearings — from the very outset.
The White House's refusal to push for real reform stands in stark contrast to what it should be doing. It was left to Rep. Pete Kanjorski in the House and Bernie Sanders in the Senate to propose bills to break up the so-called "too big to fail" banks. Both measures would give Congress the power to dismantle those pseudomonopolies controlling almost the entire derivatives market (Goldman, Citi, Chase, Morgan Stanley and Bank of America control 95 percent of the $290 trillion over-the-counter market) and the consumer-lending market (Citi, Chase, Bank of America and Wells Fargo issue one of every two mortgages, and two of every three credit cards). On November 18th, in a move that demonstrates just how nervous Democrats are getting about the growing outrage over taxpayer giveaways, Barney Frank's committee actually passed Kanjorski's measure. "It's a beginning," Kanjorski says hopefully. "We're on our way." But even if the Senate follows suit, big banks could well survive — depending on whom the president appoints to sit on the new regulatory board mandated by the measure. An oversight body filled with executives of the type Obama has favored to date from Citi and Goldman Sachs hardly seems like a strong bet to start taking an ax to concentrated wealth. And given the new bailout provisions that provide these megafirms a market advantage over smaller banks (those Paul Volcker calls "too small to save"), the failure to break them up qualifies as a major policy decision with potentially disastrous consequences.
"They should be doing what Teddy Roosevelt did," says Sanders. "They should be busting the trusts."
That probably won't happen anytime soon. But at a minimum, Obama should start on the road back to sanity by making a long-overdue move: firing Geithner. Not only are the mop-headed weenie of a Treasury secretary's fingerprints on virtually all the gross giveaways in the new reform legislation, he's a living symbol of the Rubinite gangrene crawling up the leg of this administration. Putting Geithner against the wall and replacing him with an actual human being not recently employed by a Wall Street megabank would do a lot to prove that Obama was listening this past Election Day. And while there are some who think Geithner is about to go — "he almost has to," says one Democratic strategist — at the moment, the president is still letting Wall Street do his talking.
Morning, the National Mall, November 5th. A year to the day after Obama named Michael Froman to his transition team, his political "opposition" has descended upon the city. Republican teabaggers from all 50 states have showed up, a vast horde of frowning, pissed-off middle-aged white people with their idiot placards in hand, ready to do cultural battle. They are here to protest Obama's "socialist" health care bill — you know, the one that even a bloodsucking capitalist interest group like Big Pharma spent $150 million to get passed.
These teabaggers don't know that, however. All they know is that a big government program might end up using tax dollars to pay the medical bills of rapidly breeding Dominican immigrants. So they hate it. They're also in a groove, knowing that at the polls a few days earlier, people like themselves had a big hand in ousting several Obama-allied Democrats, including a governor of New Jersey who just happened to be the former CEO of Goldman Sachs. A sign held up by New Jersey protesters bears the warning, "If You Vote For Obamacare, We Will Corzine You."
I approach a woman named Pat Defillipis from Toms River, New Jersey, and ask her why she's here. "To protest health care," she answers. "And then amnesty. You know, immigration amnesty."
I ask her if she's aware that there's a big hearing going on in the House today, where Barney Frank's committee is marking up a bill to reform the financial regulatory system. She recognizes Frank's name, wincing, but the rest of my question leaves her staring at me like I'm an alien.
"Do you care at all about economic regulation?" I ask. "There was sort of a big economic collapse last year. Do you have any ideas about how that whole deal should be fixed?"
"We got to slow down on spending," she says. "We can't afford it."
"But what do we do about the rules governing Wall Street . . ."
She walks away. She doesn't give a fuck. People like Pat aren't aware of it, but they're the best friends Obama has. They hate him, sure, but they don't hate him for any reasons that make sense. When it comes down to it, most of them hate the president for all the usual reasons they hate "liberals" — because he uses big words, doesn't believe in hell and doesn't flip out at the sight of gay people holding hands. Additionally, of course, he's black, and wasn't born in America, and is married to a woman who secretly hates our country.
These are the kinds of voters whom Obama's gang of Wall Street advisers is counting on: idiots. People whose votes depend not on whether the party in power delivers them jobs or protects them from economic villains, but on what cultural markers the candidate flashes on TV. Finance reform has become to Obama what Iraq War coffins were to Bush: something to be tucked safely out of sight.
Around the same time that finance reform was being watered down in Congress at the behest of his Treasury secretary, Obama was making a pit stop to raise money from Wall Street. On October 20th, the president went to the Mandarin Oriental Hotel in New York and addressed some 200 financiers and business moguls, each of whom paid the maximum allowable contribution of $30,400 to the Democratic Party. But an organizer of the event, Daniel Fass, announced in advance that support for the president might be lighter than expected — bailed-out firms like JP Morgan Chase and Goldman Sachs were expected to contribute a meager $91,000 to the event — because bankers were tired of being lectured about their misdeeds.
"The investment community feels very put-upon," Fass explained. "They feel there is no reason why they shouldn't earn $1 million to $200 million a year, and they don't want to be held responsible for the global financial meltdown."
Which makes sense. Shit, who could blame the investment community for the meltdown? What kind of assholes are we to put any of this on them?
This is the kind of person who is working for the Obama administration, which makes it unsurprising that we're getting no real reform of the finance industry. There's no other way to say it: Barack Obama, a once-in-a-generation political talent whose graceful conquest of America's racial dragons en route to the White House inspired the entire world, has for some reason allowed his presidency to be hijacked by sniveling, low-rent shitheads. Instead of reining in Wall Street, Obama has allowed himself to be seduced by it, leaving even his erstwhile campaign adviser, ex-Fed chief Paul Volcker, concerned about a "moral hazard" creeping over his administration.
"The obvious danger is that with the passage of time, risk-taking will be encouraged and efforts at prudential restraint will be resisted," Volcker told Congress in September, expressing concerns about all the regulatory loopholes in Frank's bill. "Ultimately, the possibility of further crises — even greater crises — will increase."
What's most troubling is that we don't know if Obama has changed, or if the influence of Wall Street is simply a fundamental and ineradicable element of our electoral system. What we do know is that Barack Obama pulled a bait-and-switch on us. If it were any other politician, we wouldn't be surprised. Maybe it's our fault, for thinking he was different.
Watch Matt Taibbi discuss "The Big Sellout" in a video on his blog, Taibblog.
[From Issue 1093 — December 10, 2009]


Business inventories - 10:00
Full report here
MANUFACTURING AND TRADE INVENTORIES AND SALES
October 2009
Sales. The U.S. Census Bureau announced today that the combined value of distributive trade sales and manufacturers’ shipments for October, adjusted for seasonal and trading-day differences but not for price changes, was estimated at $1,004.0 billion, up 1.1 percent (±0.3%) from September 2009, but down 8.2 percent (±0.5%) from October 2008.
Inventories. Manufacturers’ and trade inventories, adjusted for seasonal variations but not for price changes, were estimated at an end-of-month level of $1,305.4 billion, up 0.2 percent (±0.1%) from September 2009, but down 12.6 percent (±0.3%) from October 2008.
Inventories/Sales Ratio. The total business inventories/sales ratio based on seasonally adjusted data at the end of October was 1.30. The October 2008 ratio was 1.37.
The scheduled release dates for 2010 are as follows: January 14, February 11, March 12, April 14, May 14, June 11, July 14, August 13, September 14, October 15, November 15, December 14.


Consumer sentiment - 9:00
From MarketWatch
WASHINGTON (MarketWatch) -- Consumer sentiment improved markedly in early December, according to media reports on Friday of the Reuters/University of Michigan index. The consumer sentiment index rose to 73.4 in early December from 67.4 in November. The increase was larger than expected. The consensus forecast of Wall Street economists was for sentiment to rise to 69.0. This is the highest level of consumer sentiment since September. The strong stock market and last week's better-than-expected job report were seen boosting consumer moods.
Import and Export prices - 8:30
Full report here
U.S. IMPORT AND EXPORT PRICE INDEXES - NOVEMBER 2009
The U.S. Import Price Index advanced 1.7 percent in November, the U.S. Bureau of Labor Statistics reported today, led by a 7.3 percent rise in fuel prices. The increase followed a 0.8 percent advance in October. U.S. export prices rose 0.8 percent in November after a 0.2 percent increase the previous month.
Imports
All Imports: The 1.7 percent increase in U.S. imports in November continued the upward trend for the index. Import prices have risen in eight of the past nine months, increasing 10.1 percent over that period. The November advance for overall import prices was driven by higher fuel prices, which accounted for approximately 80 percent of the increase. The price index for U.S. imports advanced 3.7 percent for the year ended in November, the first time the index increased over a 12-month period since a 4.9 percent advance for the October 2007-2008 period.
Fuel Imports: Prices for import fuel rose 7.3 percent in November after a 2.5 percent increase the previous month. A 6.2 percent increase for petroleum prices and a 30.0 percent increase for natural gas prices led the overall advance in November. Over the past 12 months, fuel prices increased 27.0 percent. A 35.5 percent
rise in petroleum prices more than offset declining natural gas prices, which fell 31.3 percent despite the advance in November.
All Imports Excluding Fuel: Nonfuel import prices rose 0.4 percent in November as higher prices for nonfuel industrial supplies and materials, capital goods, and foods, feeds, and beverages contributed to the advance. Prices for nonfuel imports rose between 0.4 percent and 0.5 percent in each of the past four
months. The index declined 1.0 percent over the past 12 months as decreases from November 2008 to March 2009 more than offset the recent increases.
More at link with formatted tables
Retail sales- 8:30
ADVANCE MONTHLY SALES FOR RETAIL TRADE AND FOOD SERVICES
NOVEMBER 2009
The U.S. Census Bureau announced today that advance estimates of U.S. retail and food services sales for November, adjusted for seasonal variation and holiday and trading-day differences, but not for price changes, were $352.1 billion, an increase of 1.3 percent (±0.5%) from the previous month and 1.9 percent (±0.5%) above November 2008. Total sales for the September through November 2009 period were down 2.1 percent (±0.3%) from the same period a year ago. The September to October 2009 percent change was revised from +1.4 percent (±0.5%) to +1.1 percent (±0.2%).
Retail trade sales were up 1.4 percent (±0.5%) from October 2009 and 2.2 percent (±0.5%) above last year. Building material and garden equipment and supplies dealers were down 9.3 percent (±1.8%) from November 2008, but gasoline stations sales were up 8.9% (±1.3%) from last year.
The scheduled release dates for 2010 are as follows: January 14, February 11, March 12, April 14, May 14, June 11, July 14, August 13, September 14, October 15, November 15, December 14.
 More at link with formatted tables
 More at link with formatted tables
Pre-market - 7:45
Futures up a bit on news out of China - I guess.
DJIA INDEX 10,391.00 49.00
S&P 500 1,103.30 6.10
NASDAQ 100 1,807.75
Today's economic calendar
Retail Sales 8:30 AM ET
Import and Export Prices 8:30 AM ET
Consumer Sentiment 9:55 AM ET
Business Inventories 10:00 AM ET
Today's earnings reports: None
Thursday, December 10, 2009
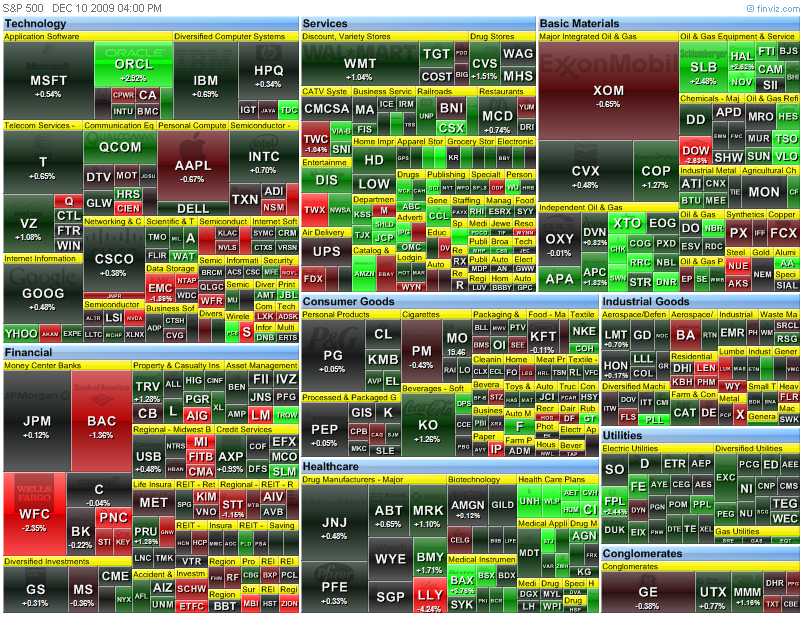
Market wrap - 4:20
Bad job numbers - the market didn't care. All is good in the world.
Dow 10,406 69 0.67%
Nasdaq 2,191 7 0.33%
S&P 500 1,102 6 0.58%
GlobalDow 1,957 +6 +0.29%
Gold 1,126 +6 +0.49%
Oil 70.48 -0.13 -0.18%



International trade - 8:30
Full report here
U.S. Census Bureau
U.S. Bureau of Economic Analysis
NEWS
U.S. Department of Commerce * Washington, DC 20230
U.S. INTERNATIONAL TRADE IN GOODS AND SERVICES
October 2009
Goods and Services
The U.S. Census Bureau and the U.S. Bureau of Economic Analysis, through the Department
of Commerce, announced today that total October exports of $136.8 billion and imports
of $169.8 billion resulted in a goods and services deficit of $32.9 billion, down
from $35.7 billion in September, revised. October exports were $3.5 billion more
than September exports of $133.4 billion. October imports were $0.7 billion more
than September imports of $169.0 billion.
In October, the goods deficit decreased $2.6 billion from September to $44.8 billion,
and the services surplus increased $0.2 billion to $11.9 billion. Exports of goods
increased $3.2 billion to $93.5 billion, and imports of goods increased $0.7 billion
to $138.4 billion. Exports of services increased $0.2 billion to $43.3 billion, and
imports of services increased $0.1 billion to $31.4 billion.
In October, the goods and services deficit decreased $26.5 billion from October 2008.
Exports were down $12.9 billion, or 8.6 percent, and imports were down $39.3 billion,
or 18.8 percent.
Goods (Census basis)
The September to October increase in exports of goods reflected increases in capital
goods ($1.2 billion); consumer goods ($1.0 billion); other goods ($0.6 billion);
industrial supplies and materials ($0.4 billion); automotive vehicles, parts, and
engines ($0.4 billion); and foods, feeds, and beverages ($0.2 billion).
The September to October increase in imports of goods reflected increases in capital
goods ($1.1 billion); consumer goods ($1.0 billion); automotive vehicles, parts, and
engines ($0.4 billion); and foods, feeds, and beverages ($0.2 billion). Decreases
occurred in industrial supplies and materials ($1.8 billion) and other goods ($0.4
billion).
The October 2008 to October 2009 decrease in exports of goods reflected decreases in
industrial supplies and materials ($3.9 billion); capital goods ($3.8 billion);
automotive vehicles, parts, and engines ($2.1 billion); and foods, feeds, and beverages
($0.7 billion). Increases occurred in consumer goods ($0.4 billion) and other goods
($0.1 billion).
The October 2008 to October 2009 decrease in imports of goods reflected decreases in
industrial supplies and materials ($25.0 billion); capital goods ($5.2 billion);
consumer goods ($3.7 billion); automotive vehicles, parts, and engines ($1.2 billion);
foods, feeds, and beverages ($0.7 billion); and other goods ($0.7 billion).
Services
Services exports increased $0.2 billion from September to October. The increase was
more than accounted for by increases in other private services (which includes items
such as business, professional, and technical services, insurance services, and
financial services), other transportation (which includes freight and port services),
and passenger fares. A decrease in transfers under U.S. military sales contracts was
partly offsetting.
Services imports increased $0.1 billion from September to October. The increase was
mostly accounted for by an increase in passenger fares. Changes in the other categories
of services imports were small.
The October 2008 to October 2009 decrease in exports of services was $2.6 billion.
The largest decreases were in travel ($1.1 billion), other transportation ($0.8 billion),
and royalties and license fees ($0.6 billion).
The October 2008 to October 2009 decrease in imports of services was $2.5 billion.
Decreases occurred in other transportation ($1.6 billion), passenger fares ($0.8
billion), and travel ($0.5 billion).
Goods and Services Moving Average
For the three months ending in October, exports of goods and services averaged $133.3
billion, while imports of goods and services averaged $166.3 billion, resulting in an
average trade deficit of $33.0 billion. For the three months ending in September, the
average trade deficit was $32.5 billion, reflecting average exports of $130.8 billion
and average imports of $163.3 billion.
Selected Not Seasonally Adjusted Goods Details
The October figures show surpluses, in billions of dollars, with Hong Kong $1.6 ($1.9
for September), Australia $1.3 ($0.9), Singapore $0.9 ($0.3), and Egypt $0.4 ($0.3).
Deficits were recorded, in billions of dollars, with China $22.7 ($22.1), OPEC $5.8
($7.9), European Union $4.9 ($5.5), Mexico $4.6 ($4.6), Japan $4.4 ($4.1), Canada $2.0
($1.5), Venezuela $1.7 ($2.0), Nigeria $1.4 ($1.9), Taiwan $0.7 ($0.7), and Korea $0.5
($0.8).
Advanced technology products exports were $23.7 billion in October and imports were
$29.3 billion, resulting in a deficit of $5.6 billion. October exports were $3.2
billion more than the $20.5 billion in September, while October imports were $2.8
billion more than the $26.5 billion in September.
Revisions
Goods exports for September were virtually unrevised. Goods imports for September
were revised down $0.3 billion. Goods carry-over in October was $0.1 billion (0.1
percent) for exports and $0.6 billion (0.4 percent) for imports. For September,
revised export carry-over was virtually zero. For September, revised import carry-over
was $0.2 billion (0.2 percent), revised down from $0.9 billion (0.7 percent).
Services exports and imports for April 2009 through September 2009 reflect the
incorporation of more comprehensive and revised quarterly and monthly data. For
services exports, the largest monthly revisions were in other private services,
transfers under U.S. military sales contracts, and royalties and license fees.
For services imports, the largest monthly revisions were in other private services.
Services exports for September were revised up $1.5 billion to $43.1 billion. The
revision was mostly accounted for by upward revisions in other private services,
transfers under U.S. military sales contracts, and royalties and license fees.
Services imports for September were revised up $0.9 billion to $31.4 billion.
The revision was mostly accounted for by an upward revision in other private services.
Jobless claims - 8:30
Full report here
SEASONALLY ADJUSTED DATA
In the week ending Dec. 5, the advance figure for seasonally adjusted initial claims was 474,000, an increase of 17,000 from the previous week's unrevised figure of 457,000. The 4-week moving average was 473,750, a decrease of 7,750 from the previous week's revised average of 481,500.
The advance seasonally adjusted insured unemployment rate was 3.9 percent for the week ending Nov. 28, a decrease of 0.2 percentage point from the prior week's unrevised rate of 4.1 percent.
The advance number for seasonally adjusted insured unemployment during the week ending Nov. 28 was 5,157,000, a decrease of 303,000 from the preceding week's revised level of 5,460,000. The 4-week moving average was 5,416,500, a decrease of 123,500 from the preceding week's revised average of 5,540,000.
The fiscal year-to-date average for seasonally adjusted insured unemployment for all programs is 5.767 million.
UNADJUSTED DATA
The advance number of actual initial claims under state programs, unadjusted, totaled 664,865 in the week ending Dec. 5, an increase of 204,703 from the previous week. There were 759,531 initial claims in the comparable week in 2008.
The advance unadjusted insured unemployment rate was 4.1 percent during the week ending Nov. 28, an increase of 0.5 percentage point from the prior week. The advance unadjusted number for persons claiming UI benefits in state programs totaled 5,373,871, an increase of 591,085 from the preceding week. A year earlier, the rate was 3.4 percent and the volume was 4,493,526.
Extended benefits were available in Alabama, Alaska, Arizona, California, Colorado, Connecticut, Delaware, the District of Columbia, Florida, Georgia, Idaho, Illinois, Indiana, Kansas, Kentucky, Maine, Massachusetts, Michigan, Minnesota, Missouri, Nevada, New Hampshire, New Jersey, New Mexico, New York, North Carolina, Ohio, Oregon, Pennsylvania, Puerto Rico, Rhode Island, South Carolina, Tennessee, Texas, Vermont, Virginia, Washington, West Virginia, and Wisconsin during the week ending Nov. 21.
Initial claims for UI benefits by former Federal civilian employees totaled 1,780 in the week ending Nov. 28, a decrease of 488 from the prior week. There were 1,372 initial claims by newly discharged veterans, a decrease of 963 from the preceding week.
There were 23,344 former Federal civilian employees claiming UI benefits for the week ending Nov. 21, a decrease of 1,177 from the previous week. Newly discharged veterans claiming benefits totaled 33,605, a decrease of 2,753 from the prior week.
States reported 4,178,780 persons claiming EUC (Emergency Unemployment Compensation) benefits for the week ending Nov. 21, an increase of 327,729 from the prior week. There were 729,256 claimants in the comparable week in 2008. EUC weekly claims include first, second, and third tier activity.
The highest insured unemployment rates in the week ending Nov. 21 were in Puerto Rico (6.1 percent), Oregon (5.6), Alaska (5.5), Nevada (5.1), Wisconsin (4.9), Washington (4.8), Michigan (4.7), Pennsylvania (4.7), Arkansas (4.5), Idaho (4.5), and North Carolina (4.5).
The largest increases in initial claims for the week ending Nov. 28 were in Wisconsin (+8,067), Kansas (+3,825), Missouri (+3,307), Iowa (+2,789), and Indiana (+2,162), while the largest decreases were in California (-28,672), Texas (-9,519), North Carolina (-8,873), Florida (-7,214), and Illinois (-6,610).
More at link with formatted tables
Pre-market - Thursday, December 10
Futures up slightly waiting on some important data at 8:30
DJIA INDEX 10,370.00 40.00
S&P 500 1,100.90 5.30
NASDAQ 100 1,800.75 8.25
BOE Announcement 7:00 AM ET
International Trade 8:30 AM ET
Jobless Claims 8:30 AM ET
RBC CASH Index 9:00 AM ET
Quarterly Services Survey 10:00 AM ET
EIA Natural Gas Report 10:30 AM ET
3-Month Bill Announcement 11:00 AM ET
6-Month Bill Announcement 11:00 AM ET
52-Week Bill Announcement 11:00 AM ET
Elizabeth Duke Speaks 12:45 PM ET
Tim Geithner Speaks 12:45 PM ET
30-Yr Bond Auction 1:00 PM ET
Treasury Budget 2:00 PM ET
Money Supply 4:30 PM ET
Today's earnings reports.
Before open:
CIEN CIENA Corp. Technology Communication Equipment
COST Costco Wholesale Corporation Services Discount, Variety Stores
CUB Cubic Corp. Technology Scientific & Technical Instruments
DG Dollar General Corp. Services Discount, Variety Stores
FSC Fifth Street Finance Corp. Financial Credit Services
GIL Gildan Activewear Inc. Consumer Goods Textile - Apparel Clothing
LAKE Lakeland Industries Inc. Healthcare Medical Appliances & Equipment
MEI Methode Electronics Inc. Technology Diversified Electronics
OPTT Ocean Power Technologies, Inc Utilities Electric Utilities
PPHM Peregrine Pharmaceuticals Inc. Healthcare Biotechnology
SFD Smithfield Foods Inc. Consumer Goods Meat Products
TITN Titan Machinery, Inc. Services Specialty Retail, Other
UNFI United Natural Foods, Inc. Services Food Wholesale
After close:
CPII CPI International, Inc. Technology Diversified Electronics
CRI Carter's, Inc. Consumer Goods Textile - Apparel Clothing
ESL Esterline Technologies Corp. Industrial Goods Aerospace/Defense Products & Services
HRLY Herley Industries Inc. Technology Scientific & Technical Instruments
IRET Investors Real Estate Trust Financial REIT - Retail
LTRE Learning Tree International Inc. Services Education & Training Services
NSM National Semiconductor Corporation Technology Semiconductor - Broad Line
WEDC White Electronic Designs Corp. Technology Semiconductor - Broad Line
Wednesday, December 9, 2009
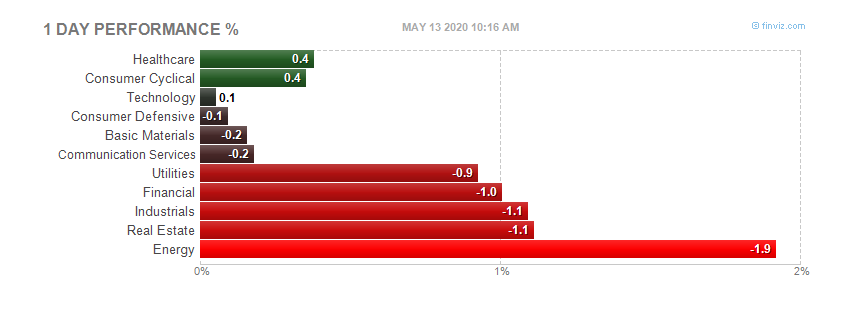
Market wrap - 4:15
Another wild day in the market. Lot's of volatility, dollar strong, then weak, stocks followed the dollar all day. Getting old.
Dow 10,337 51 0.50%
Nasdaq 2,184 11 0.49%
S&P 500 1,096 4 0.37%
Gold 1,121 -22 -1.96%
Oil 70.85 -1.95 -2.68%




Pre-market - Wednesday - 7:50
Futures up slightly today on a weaker dollar overnight.
DJIA INDEX 10,310.00 39.00
S&P 500 1,095.40 5.40
NASDAQ 100 1,777.50 9.00
Today's economic calendar:
MBA Purchase Applications 7:00 AM ET
Wholesale Trade 10:00 AM ET
EIA Petroleum Status Report 10:30 AM ET
10-Yr Note Auction 1:00 PM ET
Today's earnings reports:
Before open:
HITK Hi Tech Pharmacal Co. Inc. Healthcare Drugs - Generic
JTX Jackson Hewitt Tax Service Inc. Services Personal Services
MOV Movado Group Inc. Consumer Goods Recreational Goods, Other
POWL Powell Industries, Inc. Industrial Goods Industrial Electrical Equipment
After close:
ALOG Analogic Corporation Technology Scientific & Technical Instruments
BWY BWAY Holding Company Consumer Goods Packaging & Containers
FCEL FuelCell Energy Inc. Industrial Goods Industrial Electrical Equipment
GEF Greif Inc. Consumer Goods Packaging & Containers
ISSC Innovative Solutions & Support Inc. Technology Business Software & Services
LULU Lululemon Athletica Inc. Consumer Goods Textile - Apparel Clothing
OHB Orleans Homebuilders Inc. Industrial Goods Residential Construction
OXM Oxford Industries Inc. Consumer Goods Textile - Apparel Clothing
PLL Pall Corp. Industrial Goods Diversified Machinery
SGU Star Gas Partners LP Services Specialty Retail, Other
STRM Streamline Health Solutions, Inc. Technology Healthcare Information Services
Tuesday, December 8, 2009
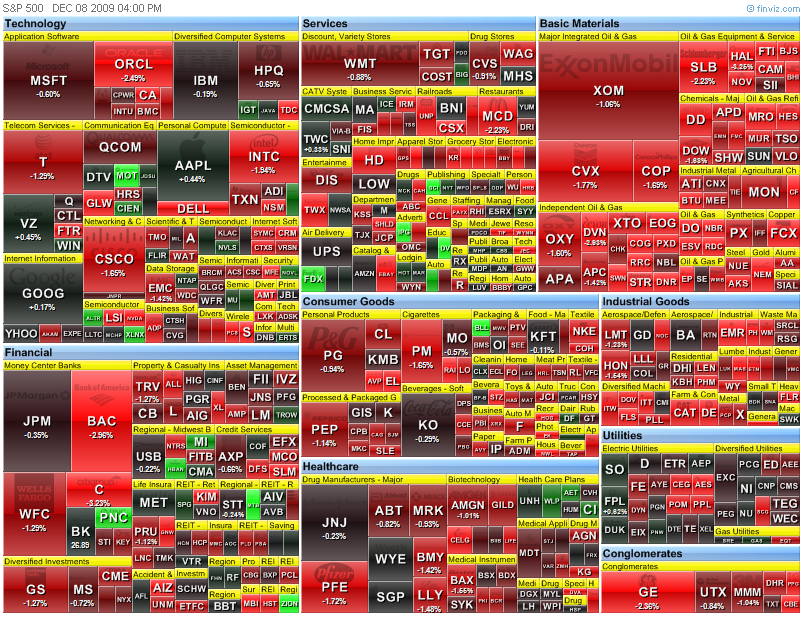
Market wrap - 4:15
The market had another rough day today. Dollar strong all day, bad earnings from Kroger and lower sales numbers from McDonalds.
Dow 10,286 -104 -1.00%
Nasdaq 2,173 -17 -0.76%
S&P 500 1,092 -11 -1.03%
GlobalDow 1,956 -21 -1.05%
Gold 1,143 -21 -1.77%
Oil 72.68 -1.31 -1.77%


Pre-market - Tuesday - December 8, 2009
Futures down pretty good this morning.
DJIA INDEX 10,325.00 -66.00
S&P 500 1,096.00 -7.70
NASDAQ 100 1,769.00 -15.00
Today's economic reports:
ICSC-Goldman Store Sales 7:45 AM ET
Redbook 8:55 AM ET
Bank of Canada Announcement 9:00 AM ET
4-Week Bill Auction 11:30 AM ET
3-Yr Note Auction 1:00 PM ET
Today's earnings reports.
Before open:
AZO AutoZone Inc. Services Auto Parts Stores
BF-B Brown-Forman Corporation Consumer Goods Beverages - Wineries & Distillers
BNS The Bank Of Nova Scotia Financial Money Center Banks
GIGM GigaMedia Ltd. Technology Internet Software & Services
HRB H&R Block, Inc. Services Personal Services
IPSU Imperial Sugar Co. Consumer Goods Confectioners
MGAM Multimedia Games Inc. Services Gaming Activities
MTN Vail Resorts Inc. Services Resorts & Casinos
SAFM Sanderson Farms Inc. Consumer Goods Meat Products
TLB The Talbots Inc. Services Apparel Stores
TTC Toro Co. Industrial Goods Small Tools & Accessories
After close:
AVAV AeroVironment, Inc. Industrial Goods Aerospace/Defense Products & Services
CHP C&D Technologies, Inc. Technology Diversified Electronics
CKR CKE Restaurants Inc. Services Restaurants
CMRO Comarco, Inc. Technology Communication Equipment
CMTL Comtech Telecommunications Corp. Technology Communication Equipment
COO The Cooper Companies Inc. Healthcare Medical Instruments & Supplies
FCE-A Forest City Enterprises Inc. Financial Property Management
MIND Mitcham Industries Inc. Services Rental & Leasing Services
MW The Men's Wearhouse, Inc. Services Apparel Stores
NCS NCI Building Systems Inc. Industrial Goods General Building Materials
ODC Oil-Dri Corp. of America Basic Materials Specialty Chemicals
PLAB Photronics Inc. Technology Semiconductor - Integrated Circuits
SAI SAIC, Inc. Industrial Goods Aerospace/Defense Products & Services
Monday, December 7, 2009
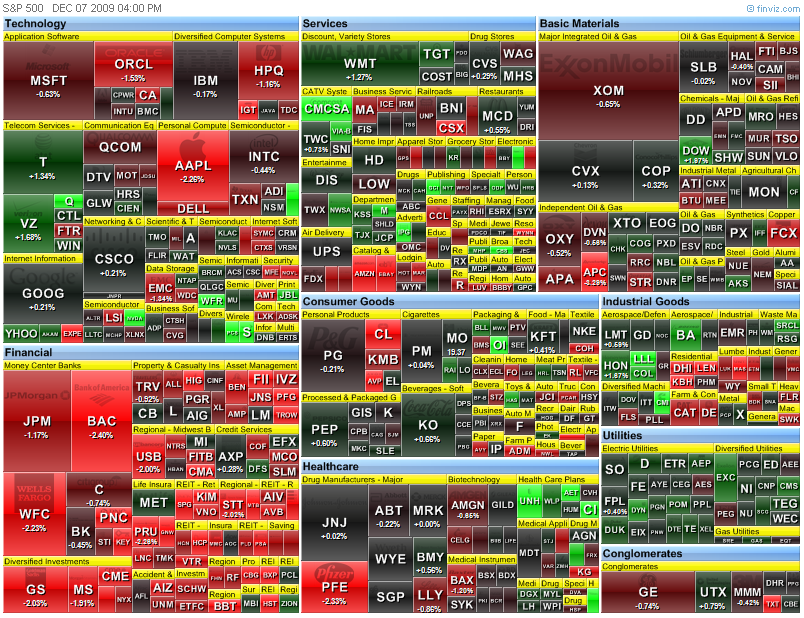
Market wrap - 5:15
Dow 10,390 1 0.01%
Nasdaq 2,190 -5 -0.22%
S&P 500 1,103 -3 -0.25%
GlobalDow 1,976 -2 -0.11%
Gold 1,164 -6 -0.47%
Oil 74.10 -1.54 -2.04%


Pre-market - Monday, December 7, 2009
Futures down a bit this morning, not sure why, perhaps the stronger dollar.
DJIA INDEX 10,364.00 -36.00
S&P 500 1,103.50 -4.60
NASDAQ 100 1,787.75 -7.25
Today's economic calendar:
4-Week Bill Announcement 11:00 AM ET
3-Month Bill Auction 11:30 AM ET
6-Month Bill Auction 11:30 AM ET
Ben Bernanke Speaks 12:00 PM ET
Consumer Credit 3:00 PM ET
Today's earnings reports:
Before open:
BTH Blyth, Inc. Consumer Goods Personal Products
CMM China Mass Media Corp. Services Advertising Agencies
GRB Gerber Scientific Inc. Industrial Goods Diversified Machinery
KMGB KMG Chemicals Inc. Basic Materials Specialty Chemicals
LAYN Layne Christensen Co. Industrial Goods Heavy Construction
After close:
CASY Casey's General Stores Inc. Services Grocery Stores
EFUT e-Future Information Technology Inc. Technology Business Software & Services
FMCN Focus Media Holding Ltd. Services Advertising Agencies
MLNK ModusLink Global Solutions, Inc. Technology Internet Software & Services
PBY Pep Boys - Manny, Moe & Jack Services Auto Parts Stores
REXI Resource America Inc. Financial Asset Management
Friday, December 4, 2009
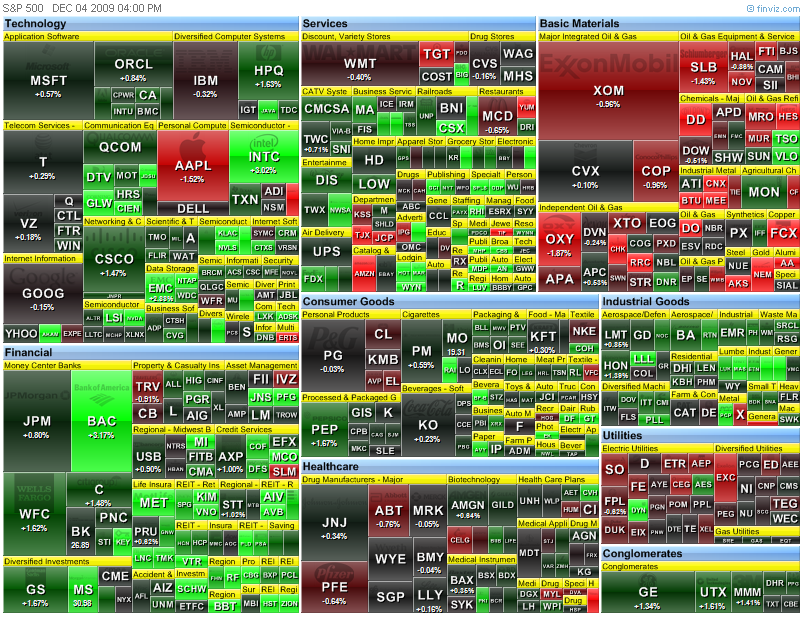
Market wrap - 4:15
Market ramped up on the opening bell due to extraordinary employment report (the one seemingly nobody believes)to sell off during the day. The dollar was strong all day and Gold just got bitchslapped.
Dow 10,388 22 0.21%
Nasdaq 2,194 21 0.98%
S&P 500 1,106 6 0.54%
GlobalDow 1,975 -8 -0.38%
Gold 1,169 -49 -4.05%
Oil 75.60 -0.99 -1.29%


Pre-market - 8:00
Futures up a little waiting on the employment report.
DJIA INDEX 10,372.00 20.00
S&P 500 1,099.90 1.90
NASDAQ 100 1,782.00 1.75
Today's economic reports:
Employment Situation 8:30 AM ET
Charles Plosser Speaks 10:00 AM ET
Factory Orders 10:00 AM ET
James Bullard Speaks 1:15 PM ET
Treasury STRIPS 3:00 PM ET
Today's earnings reports:
Before open:
BIG Big Lots Inc. Services Discount, Variety Stores
RY Royal Bank of Canada Financial Money Center Banks
SIRO Sirona Dental Systems Inc. Healthcare Medical Appliances & Equipment
After close:
FMCN Focus Media Holding Ltd. Services Advertising Agencies
Thursday, December 3, 2009
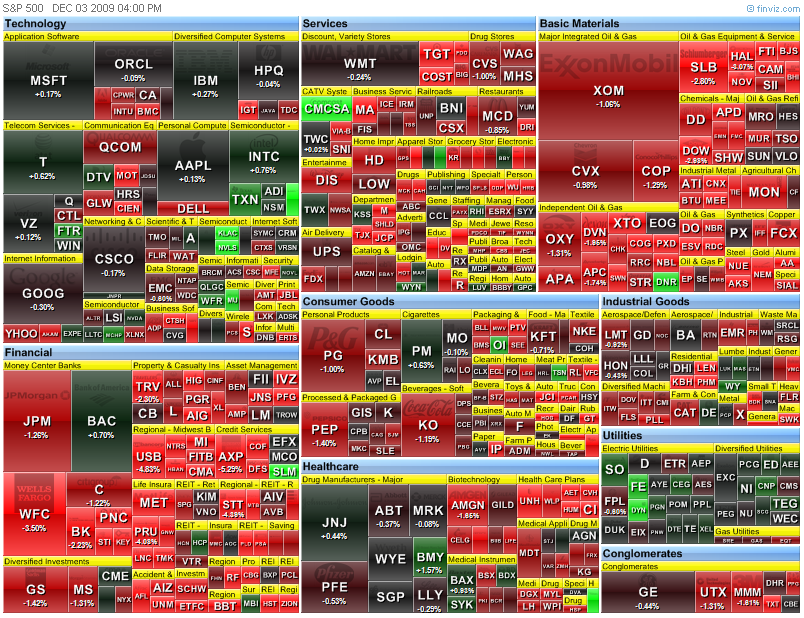
Market wrap - 4:30
Pretty uneventful day until the last hour when the market decided to sell off. Not sure why, rising dollar, Bernanke testimony, or tomorrows employment report. But something spooked it.
Dow 10,366 -87 -0.83%
Nasdaq 2,173 -12 -0.54%
S&P 500 1,100 -9 -0.84%
Gold 1,218 +5 +0.43%
Oil 75.99 -0.14 -0.18%


ISM Non-manufacturing - 10:00
Full report here - late, link didn't work, and this did move the market.
November 2009 Non-Manufacturing ISM Report On Business®
NMI (Non-Manufacturing Index) at 48.7%
DO NOT CONFUSE THIS NATIONAL REPORT with the various regional purchasing reports released across the country. The national report's information reflects the entire United States, while the regional reports contain primarily regional data from their local vicinities. Also, the information in the regional reports is not used in calculating the results of the national report. The information compiled in this report is for the month of November 2009.
Business Activity Index at 49.6%
New Orders Index at 55.1%
Employment Index at 41.6%
(Tempe, Arizona) — Economic activity in the non-manufacturing sector contracted in November after two consecutive months of expansion, say the nation's purchasing and supply executives in the latest Non-Manufacturing ISM Report On Business®.
The report was issued today by Anthony Nieves, C.P.M., CFPM, chair of the Institute for Supply Management™ Non-Manufacturing Business Survey Committee; and senior vice president — supply management for Hilton Worldwide. "The NMI (Non-Manufacturing Index) registered 48.7 percent in November, 1.9 percentage points lower than the 50.6 percent registered in October, indicating contraction in the non-manufacturing sector after two consecutive months of expansion. The Non-Manufacturing Business Activity Index decreased 5.6 percentage points to 49.6 percent, reflecting contraction after three consecutive months of growth. The New Orders Index decreased 0.5 percentage point to 55.1 percent, and the Employment Index increased 0.5 percentage point to 41.6 percent. The Prices Index increased 4.8 percentage points to 57.8 percent in November, indicating an increase in prices paid from October. According to the NMI, six non-manufacturing industries reported growth in November. Respondents' comments remain cautious about business conditions and reflect concern over the length of time for economic recovery."
INDUSTRY PERFORMANCE (Based on the NMI)
The six industries reporting growth in November based on the NMI composite index — listed in order — are: Other Services; Health Care & Social Assistance; Construction; Finance & Insurance; Retail Trade; and Information. The 11 industries reporting contraction in November — listed in order — are: Real Estate, Rental & Leasing; Management of Companies & Support Services; Mining; Arts, Entertainment & Recreation; Public Administration; Accommodation & Food Services; Educational Services; Wholesale Trade; Transportation & Warehousing; Professional, Scientific & Technical Services; and Utilities.
WHAT RESPONDENTS ARE SAYING ...
* "Capital markets remain very tight; lenders are not releasing funds for development projects, limiting expansion." (Accommodation & Food Services)
* "Fourth quarter still looking grim, but potential upturn for Q1 2010." (Professional, Scientific & Technical Services)
* "No one trusts that the recovery is real. Seems everything and everyone is in a holding pattern." (Public Administration)
* "Business is still flat." (Wholesale Trade)
* "U.S. business remains better than 2007 levels, although it's been through personnel and cost reductions that we are now profitable. Business continues to be about 8 percent below 2008 levels." (Real Estate, Rental & Leasing)
 * Non-Manufacturing ISM Report On Business® data is seasonally adjusted for Business Activity, New Orders, Prices and Employment. Manufacturing ISM Report On Business® data is seasonally adjusted for New Orders, Production, Employment, Supplier Deliveries and Inventories.
** Number of months moving in current direction.
COMMODITIES REPORTED UP / DOWN IN PRICE, and IN SHORT SUPPLY
Commodities Up in Price
Beef; Cheese (4); Diesel Fuel; #1 Diesel Fuel; #2 Diesel Fuel; Fuel (2); Gasoline; Laboratory Equipment; Masks [for TB/H1N1 use] (2); and Pharmacy Supplies.
Commodities Down in Price
Alloys (2); and Carbon Pipe.
Commodities in Short Supply
Masks [for TB/H1N1 use] (2) is the only commodity reported in short supply.
Note: The number of consecutive months the commodity is listed is indicated after each item.
* Non-Manufacturing ISM Report On Business® data is seasonally adjusted for Business Activity, New Orders, Prices and Employment. Manufacturing ISM Report On Business® data is seasonally adjusted for New Orders, Production, Employment, Supplier Deliveries and Inventories.
** Number of months moving in current direction.
COMMODITIES REPORTED UP / DOWN IN PRICE, and IN SHORT SUPPLY
Commodities Up in Price
Beef; Cheese (4); Diesel Fuel; #1 Diesel Fuel; #2 Diesel Fuel; Fuel (2); Gasoline; Laboratory Equipment; Masks [for TB/H1N1 use] (2); and Pharmacy Supplies.
Commodities Down in Price
Alloys (2); and Carbon Pipe.
Commodities in Short Supply
Masks [for TB/H1N1 use] (2) is the only commodity reported in short supply.
Note: The number of consecutive months the commodity is listed is indicated after each item.
 * Non-Manufacturing ISM Report On Business® data is seasonally adjusted for Business Activity, New Orders, Prices and Employment. Manufacturing ISM Report On Business® data is seasonally adjusted for New Orders, Production, Employment, Supplier Deliveries and Inventories.
** Number of months moving in current direction.
COMMODITIES REPORTED UP / DOWN IN PRICE, and IN SHORT SUPPLY
Commodities Up in Price
Beef; Cheese (4); Diesel Fuel; #1 Diesel Fuel; #2 Diesel Fuel; Fuel (2); Gasoline; Laboratory Equipment; Masks [for TB/H1N1 use] (2); and Pharmacy Supplies.
Commodities Down in Price
Alloys (2); and Carbon Pipe.
Commodities in Short Supply
Masks [for TB/H1N1 use] (2) is the only commodity reported in short supply.
Note: The number of consecutive months the commodity is listed is indicated after each item.
* Non-Manufacturing ISM Report On Business® data is seasonally adjusted for Business Activity, New Orders, Prices and Employment. Manufacturing ISM Report On Business® data is seasonally adjusted for New Orders, Production, Employment, Supplier Deliveries and Inventories.
** Number of months moving in current direction.
COMMODITIES REPORTED UP / DOWN IN PRICE, and IN SHORT SUPPLY
Commodities Up in Price
Beef; Cheese (4); Diesel Fuel; #1 Diesel Fuel; #2 Diesel Fuel; Fuel (2); Gasoline; Laboratory Equipment; Masks [for TB/H1N1 use] (2); and Pharmacy Supplies.
Commodities Down in Price
Alloys (2); and Carbon Pipe.
Commodities in Short Supply
Masks [for TB/H1N1 use] (2) is the only commodity reported in short supply.
Note: The number of consecutive months the commodity is listed is indicated after each item.
Elizibeth Warren - America with no middle class - 8:50
This is a pretty good article IMHO. A must read for anyone interested in what is going on. Forget the source, just read what Ms. Warren has to say, she is one of the good ones.
Full link here, which I suggest you use. There are many links to backup her claims, and charts I cannot replicate here.
America Without a Middle Class
Can you imagine an America without a strong middle class? If you can, would it still be America as we know it?
Today, one in five Americans is unemployed, underemployed or just plain out of work. One in nine families can't make the minimum payment on their credit cards. One in eight mortgages is in default or foreclosure. One in eight Americans is on food stamps. More than 120,000 families are filing for bankruptcy every month. The economic crisis has wiped more than $5 trillion from pensions and savings, has left family balance sheets upside down, and threatens to put ten million homeowners out on the street.
Families have survived the ups and downs of economic booms and busts for a long time, but the fall-behind during the busts has gotten worse while the surge-ahead during the booms has stalled out. In the boom of the 1960s, for example, median family income jumped by 33% (adjusted for inflation). But the boom of the 2000s resulted in an almost-imperceptible 1.6% increase for the typical family. While Wall Street executives and others who owned lots of stock celebrated how good the recovery was for them, middle class families were left empty-handed.
The crisis facing the middle class started more than a generation ago. Even as productivity rose, the wages of the average fully-employed male have been flat since the 1970s.
 But core expenses kept going up. By the early 2000s, families were spending twice as much (adjusted for inflation) on mortgages than they did a generation ago -- for a house that was, on average, only ten percent bigger and 25 years older. They also had to pay twice as much to hang on to their health insurance.
To cope, millions of families put a second parent into the workforce. But higher housing and medical costs combined with new expenses for child care, the costs of a second car to get to work and higher taxes combined to squeeze families even harder. Even with two incomes, they tightened their belts. Families today spend less than they did a generation ago on food, clothing, furniture, appliances, and other flexible purchases -- but it hasn't been enough to save them. Today's families have spent all their income, have spent all their savings, and have gone into debt to pay for college, to cover serious medical problems, and just to stay afloat a little while longer.
But core expenses kept going up. By the early 2000s, families were spending twice as much (adjusted for inflation) on mortgages than they did a generation ago -- for a house that was, on average, only ten percent bigger and 25 years older. They also had to pay twice as much to hang on to their health insurance.
To cope, millions of families put a second parent into the workforce. But higher housing and medical costs combined with new expenses for child care, the costs of a second car to get to work and higher taxes combined to squeeze families even harder. Even with two incomes, they tightened their belts. Families today spend less than they did a generation ago on food, clothing, furniture, appliances, and other flexible purchases -- but it hasn't been enough to save them. Today's families have spent all their income, have spent all their savings, and have gone into debt to pay for college, to cover serious medical problems, and just to stay afloat a little while longer.
 Through it all, families never asked for a handout from anyone, especially Washington. They were left to go on their own, working harder, squeezing nickels, and taking care of themselves. But their economic boats have been taking on water for years, and now the crisis has swamped millions of middle class families.
The contrast with the big banks could not be sharper. While the middle class has been caught in an economic vise, the financial industry that was supposed to serve them has prospered at their expense. Consumer banking -- selling debt to middle class families -- has been a gold mine. Boring banking has given way to creative banking, and the industry has generated tens of billions of dollars annually in fees made possible by deceptive and dangerous terms buried in the fine print of opaque, incomprehensible, and largely unregulated contracts.
And when various forms of this creative banking triggered economic crisis, the banks went to Washington for a handout. All the while, top executives kept their jobs and retained their bonuses. Even though the tax dollars that supported the bailout came largely from middle class families -- from people already working hard to make ends meet -- the beneficiaries of those tax dollars are now lobbying Congress to preserve the rules that had let those huge banks feast off the middle class.
Pundits talk about "populist rage" as a way to trivialize the anger and fear coursing through the middle class. But they have it wrong. Families understand with crystalline clarity that the rules they have played by are not the same rules that govern Wall Street. They understand that no American family is "too big to fail." They recognize that business models have shifted and that big banks are pulling out all the stops to squeeze families and boost revenues. They understand that their economic security is under assault and that leaving consumer debt effectively unregulated does not work.
Families are ready for change. According to polls, large majorities of Americans have welcomed the Obama Administration's proposal for a new Consumer Financial Protection Agency (CFPA). The CFPA would be answerable to consumers -- not to banks and not to Wall Street. The agency would have the power to end tricks-and-traps pricing and to start leveling the playing field so that consumers have the tools they need to compare prices and manage their money. The response of the big banks has been to swing into action against the Agency, fighting with all their lobbying might to keep business-as-usual. They are pulling out all the stops to kill the agency before it is born. And if those practices crush millions more families, who cares -- so long as the profits stay high and the bonuses keep coming.
America today has plenty of rich and super-rich. But it has far more families who did all the right things, but who still have no real security. Going to college and finding a good job no longer guarantee economic safety. Paying for a child's education and setting aside enough for a decent retirement have become distant dreams. Tens of millions of once-secure middle class families now live paycheck to paycheck, watching as their debts pile up and worrying about whether a pink slip or a bad diagnosis will send them hurtling over an economic cliff.
America without a strong middle class? Unthinkable, but the once-solid foundation is shaking.
Elizabeth Warren is the Leo Gottlieb Professor of Law at Harvard and is currently the Chair of the Congressional Oversight Panel.
Through it all, families never asked for a handout from anyone, especially Washington. They were left to go on their own, working harder, squeezing nickels, and taking care of themselves. But their economic boats have been taking on water for years, and now the crisis has swamped millions of middle class families.
The contrast with the big banks could not be sharper. While the middle class has been caught in an economic vise, the financial industry that was supposed to serve them has prospered at their expense. Consumer banking -- selling debt to middle class families -- has been a gold mine. Boring banking has given way to creative banking, and the industry has generated tens of billions of dollars annually in fees made possible by deceptive and dangerous terms buried in the fine print of opaque, incomprehensible, and largely unregulated contracts.
And when various forms of this creative banking triggered economic crisis, the banks went to Washington for a handout. All the while, top executives kept their jobs and retained their bonuses. Even though the tax dollars that supported the bailout came largely from middle class families -- from people already working hard to make ends meet -- the beneficiaries of those tax dollars are now lobbying Congress to preserve the rules that had let those huge banks feast off the middle class.
Pundits talk about "populist rage" as a way to trivialize the anger and fear coursing through the middle class. But they have it wrong. Families understand with crystalline clarity that the rules they have played by are not the same rules that govern Wall Street. They understand that no American family is "too big to fail." They recognize that business models have shifted and that big banks are pulling out all the stops to squeeze families and boost revenues. They understand that their economic security is under assault and that leaving consumer debt effectively unregulated does not work.
Families are ready for change. According to polls, large majorities of Americans have welcomed the Obama Administration's proposal for a new Consumer Financial Protection Agency (CFPA). The CFPA would be answerable to consumers -- not to banks and not to Wall Street. The agency would have the power to end tricks-and-traps pricing and to start leveling the playing field so that consumers have the tools they need to compare prices and manage their money. The response of the big banks has been to swing into action against the Agency, fighting with all their lobbying might to keep business-as-usual. They are pulling out all the stops to kill the agency before it is born. And if those practices crush millions more families, who cares -- so long as the profits stay high and the bonuses keep coming.
America today has plenty of rich and super-rich. But it has far more families who did all the right things, but who still have no real security. Going to college and finding a good job no longer guarantee economic safety. Paying for a child's education and setting aside enough for a decent retirement have become distant dreams. Tens of millions of once-secure middle class families now live paycheck to paycheck, watching as their debts pile up and worrying about whether a pink slip or a bad diagnosis will send them hurtling over an economic cliff.
America without a strong middle class? Unthinkable, but the once-solid foundation is shaking.
Elizabeth Warren is the Leo Gottlieb Professor of Law at Harvard and is currently the Chair of the Congressional Oversight Panel.
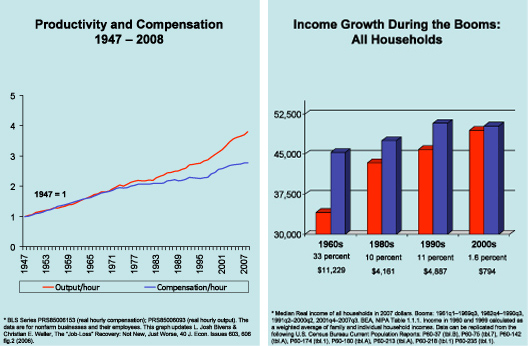 But core expenses kept going up. By the early 2000s, families were spending twice as much (adjusted for inflation) on mortgages than they did a generation ago -- for a house that was, on average, only ten percent bigger and 25 years older. They also had to pay twice as much to hang on to their health insurance.
To cope, millions of families put a second parent into the workforce. But higher housing and medical costs combined with new expenses for child care, the costs of a second car to get to work and higher taxes combined to squeeze families even harder. Even with two incomes, they tightened their belts. Families today spend less than they did a generation ago on food, clothing, furniture, appliances, and other flexible purchases -- but it hasn't been enough to save them. Today's families have spent all their income, have spent all their savings, and have gone into debt to pay for college, to cover serious medical problems, and just to stay afloat a little while longer.
But core expenses kept going up. By the early 2000s, families were spending twice as much (adjusted for inflation) on mortgages than they did a generation ago -- for a house that was, on average, only ten percent bigger and 25 years older. They also had to pay twice as much to hang on to their health insurance.
To cope, millions of families put a second parent into the workforce. But higher housing and medical costs combined with new expenses for child care, the costs of a second car to get to work and higher taxes combined to squeeze families even harder. Even with two incomes, they tightened their belts. Families today spend less than they did a generation ago on food, clothing, furniture, appliances, and other flexible purchases -- but it hasn't been enough to save them. Today's families have spent all their income, have spent all their savings, and have gone into debt to pay for college, to cover serious medical problems, and just to stay afloat a little while longer.
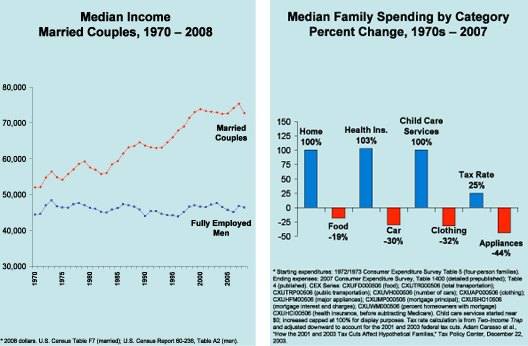 Through it all, families never asked for a handout from anyone, especially Washington. They were left to go on their own, working harder, squeezing nickels, and taking care of themselves. But their economic boats have been taking on water for years, and now the crisis has swamped millions of middle class families.
The contrast with the big banks could not be sharper. While the middle class has been caught in an economic vise, the financial industry that was supposed to serve them has prospered at their expense. Consumer banking -- selling debt to middle class families -- has been a gold mine. Boring banking has given way to creative banking, and the industry has generated tens of billions of dollars annually in fees made possible by deceptive and dangerous terms buried in the fine print of opaque, incomprehensible, and largely unregulated contracts.
And when various forms of this creative banking triggered economic crisis, the banks went to Washington for a handout. All the while, top executives kept their jobs and retained their bonuses. Even though the tax dollars that supported the bailout came largely from middle class families -- from people already working hard to make ends meet -- the beneficiaries of those tax dollars are now lobbying Congress to preserve the rules that had let those huge banks feast off the middle class.
Pundits talk about "populist rage" as a way to trivialize the anger and fear coursing through the middle class. But they have it wrong. Families understand with crystalline clarity that the rules they have played by are not the same rules that govern Wall Street. They understand that no American family is "too big to fail." They recognize that business models have shifted and that big banks are pulling out all the stops to squeeze families and boost revenues. They understand that their economic security is under assault and that leaving consumer debt effectively unregulated does not work.
Families are ready for change. According to polls, large majorities of Americans have welcomed the Obama Administration's proposal for a new Consumer Financial Protection Agency (CFPA). The CFPA would be answerable to consumers -- not to banks and not to Wall Street. The agency would have the power to end tricks-and-traps pricing and to start leveling the playing field so that consumers have the tools they need to compare prices and manage their money. The response of the big banks has been to swing into action against the Agency, fighting with all their lobbying might to keep business-as-usual. They are pulling out all the stops to kill the agency before it is born. And if those practices crush millions more families, who cares -- so long as the profits stay high and the bonuses keep coming.
America today has plenty of rich and super-rich. But it has far more families who did all the right things, but who still have no real security. Going to college and finding a good job no longer guarantee economic safety. Paying for a child's education and setting aside enough for a decent retirement have become distant dreams. Tens of millions of once-secure middle class families now live paycheck to paycheck, watching as their debts pile up and worrying about whether a pink slip or a bad diagnosis will send them hurtling over an economic cliff.
America without a strong middle class? Unthinkable, but the once-solid foundation is shaking.
Elizabeth Warren is the Leo Gottlieb Professor of Law at Harvard and is currently the Chair of the Congressional Oversight Panel.
Through it all, families never asked for a handout from anyone, especially Washington. They were left to go on their own, working harder, squeezing nickels, and taking care of themselves. But their economic boats have been taking on water for years, and now the crisis has swamped millions of middle class families.
The contrast with the big banks could not be sharper. While the middle class has been caught in an economic vise, the financial industry that was supposed to serve them has prospered at their expense. Consumer banking -- selling debt to middle class families -- has been a gold mine. Boring banking has given way to creative banking, and the industry has generated tens of billions of dollars annually in fees made possible by deceptive and dangerous terms buried in the fine print of opaque, incomprehensible, and largely unregulated contracts.
And when various forms of this creative banking triggered economic crisis, the banks went to Washington for a handout. All the while, top executives kept their jobs and retained their bonuses. Even though the tax dollars that supported the bailout came largely from middle class families -- from people already working hard to make ends meet -- the beneficiaries of those tax dollars are now lobbying Congress to preserve the rules that had let those huge banks feast off the middle class.
Pundits talk about "populist rage" as a way to trivialize the anger and fear coursing through the middle class. But they have it wrong. Families understand with crystalline clarity that the rules they have played by are not the same rules that govern Wall Street. They understand that no American family is "too big to fail." They recognize that business models have shifted and that big banks are pulling out all the stops to squeeze families and boost revenues. They understand that their economic security is under assault and that leaving consumer debt effectively unregulated does not work.
Families are ready for change. According to polls, large majorities of Americans have welcomed the Obama Administration's proposal for a new Consumer Financial Protection Agency (CFPA). The CFPA would be answerable to consumers -- not to banks and not to Wall Street. The agency would have the power to end tricks-and-traps pricing and to start leveling the playing field so that consumers have the tools they need to compare prices and manage their money. The response of the big banks has been to swing into action against the Agency, fighting with all their lobbying might to keep business-as-usual. They are pulling out all the stops to kill the agency before it is born. And if those practices crush millions more families, who cares -- so long as the profits stay high and the bonuses keep coming.
America today has plenty of rich and super-rich. But it has far more families who did all the right things, but who still have no real security. Going to college and finding a good job no longer guarantee economic safety. Paying for a child's education and setting aside enough for a decent retirement have become distant dreams. Tens of millions of once-secure middle class families now live paycheck to paycheck, watching as their debts pile up and worrying about whether a pink slip or a bad diagnosis will send them hurtling over an economic cliff.
America without a strong middle class? Unthinkable, but the once-solid foundation is shaking.
Elizabeth Warren is the Leo Gottlieb Professor of Law at Harvard and is currently the Chair of the Congressional Oversight Panel.
Productivity and Costs - 8:30
Full report here
PRODUCTIVITY AND COSTS
Third Quarter 2009, Revised
Nonfarm business sector labor productivity increased at an 8.1 percent
annual rate during the third quarter of 2009, the U.S. Bureau of Labor
Statistics reported today (tables A and 2). This was the largest gain in
productivity since the third quarter of 2003, and reflects a 2.9 percent
increase in output and a 4.8 percent decline in hours worked. (All
quarterly percent changes in this release are seasonally adjusted annual
rates.)
Labor productivity is calculated by dividing an index of real output by an
index of the combined hours worked of all persons, including employees,
proprietors, and unpaid family workers. The productivity measures released
today were based on more recent and more complete data than were available
for the preliminary report issued last month (see Revised measures).
Unit labor costs in nonfarm businesses fell 2.5 percent in the third
quarter of 2009, as productivity grew at a faster rate (8.1 percent) than
hourly compensation (5.4 percent). Unit labor costs declined 1.4 percent
over the last four quarters (tables A and 2). BLS defines unit labor costs
as the ratio of hourly compensation to labor productivity; increases in
hourly compensation tend to increase unit labor costs and increases in
output per hour tend to reduce them.
Manufacturing sector productivity grew 13.4 percent in the third quarter
of 2009, as output rose 8.4 percent and hours worked fell 4.4 percent
(tables A and 3). The third quarter gain in manufacturing productivity was
the largest in the series, which begins in the second quarter of 1987.
Over the last four quarters, manufacturing productivity grew 3.0 percent.
Manufacturing unit labor costs fell 6.1 percent in the third quarter of
2009, but rose 3.0 percent over the last four quarters.
The data sources and methods used in the preparation of the manufacturing
output series differ from those used in preparing the business and nonfarm
business output series, and these measures are not directly comparable.
See Technical Notes for more information on data sources.
Revised measures
Table B presents previous and revised productivity and related measures
for the major sectors: business, nonfarm business and manufacturing, for
the second and third quarters of 2009.
In the third quarter of 2009, nonfarm business productivity was revised
down from 9.5 percent to 8.1 percent, reflecting a downward revision to
output and an upward revision to hours. Unit labor costs declined 2.5
percent rather than falling 5.2 percent as previously reported; this
upward revision was due both to the downward revision to productivity and
the 1.6 percentage-point upward revision to hourly compensation. In the
manufacturing sector, upward revisions to both output and hours affected
productivity, which was revised slightly down by 0.2 percentage point.
In the second quarter of 2009, nonfarm business productivity was not
revised. However, unit labor costs were revised to show zero growth during
the second quarter rather than decreasing 6.1 percent as previously
reported. This upward revision to unit labor costs was due solely to the
large upward revision to hourly compensation. In the manufacturing sector,
second quarter productivity was not revised; unit labor costs were revised
upward by 1.3 percentage points.
More at link with formatted tables
Jobless claims - 8:30
Full report here
UNEMPLOYMENT INSURANCE WEEKLY CLAIMS REPORT
SEASONALLY ADJUSTED DATA
In the week ending Nov. 28, the advance figure for seasonally adjusted initial claims was 457,000, a decrease of 5,000 from the previous week's revised figure of 462,000. The 4-week moving average was 481,250, a decrease of 14,250 from the previous week's revised average of 495,500.
The advance seasonally adjusted insured unemployment rate was 4.1 percent for the week ending Nov. 21, unchanged from the prior week's unrevised rate of 4.1 percent.
The advance number for seasonally adjusted insured unemployment during the week ending Nov. 21 was 5,465,000, an increase of 28,000 from the preceding week's revised level of 5,437,000. The 4-week moving average was 5,541,500, a decrease of 75,750 from the preceding week's revised average of 5,617,250.
The fiscal year-to-date average for seasonally adjusted insured unemployment for all programs is 5.832 million.
UNADJUSTED DATA
The advance number of actual initial claims under state programs, unadjusted, totaled 460,989 in the week ending Nov. 28, a decrease of 78,263 from the previous week. There were 535,730 initial claims in the comparable week in 2008.
The advance unadjusted insured unemployment rate was 3.6 percent during the week ending Nov. 21, a decrease of 0.3 percentage point from the prior week. The advance unadjusted number for persons claiming UI benefits in state programs totaled 4,787,291, a decrease of 296,052 from the preceding week. A year earlier, the rate was 2.7 percent and the volume was 3,652,990.
Extended benefits were available in Alabama, Alaska, Arizona, California, Colorado, Connecticut, Delaware, the District of Columbia, Florida, Georgia, Idaho, Illinois, Indiana, Kansas, Kentucky, Maine, Massachusetts, Michigan, Minnesota, Missouri, Nevada, New Hampshire, New Jersey, New Mexico, New York, North Carolina, Ohio, Oregon, Pennsylvania, Puerto Rico, Rhode Island, South Carolina, Tennessee, Texas, Vermont, Virginia, Washington, West Virginia, and Wisconsin during the week ending Nov. 14.
Initial claims for UI benefits by former Federal civilian employees totaled 2,269 in the week ending Nov. 21, a decrease of 101 from the prior week. There were 2,330 initial claims by newly discharged veterans, an increase of 368 from the preceding week.
There were 24,523 former Federal civilian employees claiming UI benefits for the week ending Nov. 14, an increase of 1,389 from the previous week. Newly discharged veterans claiming benefits totaled 36,359, an increase of 1,752 from the prior week.
States reported 3,859,553 persons claiming EUC (Emergency Unemployment Compensation) benefits for the week ending Nov. 14, an increase of 265,300 from the prior week. There were 777,393 claimants in the comparable week in 2008. EUC weekly claims include first, second, and third tier activity.
The highest insured unemployment rates in the week ending Nov. 14 were in Puerto Rico (6.1 percent), Oregon (5.9), Alaska (5.5), California (5.2), Nevada (5.2), Michigan (5.1), Pennsylvania (5.0), Wisconsin (5.0), North Carolina (4.8), and Washington (4.7).
The largest increases in initial claims for the week ending Nov. 21 were in California (+14,796), Illinois (+6,168), North Carolina (+5,557), Pennsylvania (+5,285), and Texas (+3,500), while the largest decreases were in Michigan (-1,242), Indiana (-987), Hawaii (-195), Oregon (-167), and the Virgin Islands (-10).
Pre-market - 7:50
Futures up on last nights news about BAC paying back TARP money - an of course a weaker dollar overnight.
DJIA INDEX 10,467.00 28.00
S&P 500 1,111.10 3.20
NASDAQ 100 1,793.75 2.25
Today's economic reports:
Chain Store Sales
Monster Employment Index
ECB Announcement 7:45 AM ET - rate unchanged
Jobless Claims 8:30 AM ET
Productivity and Costs 8:30 AM ET
30-Yr Bond Announcement 9:00 AM ET
ISM Non-Mfg Index 10:00 AM ET
EIA Natural Gas Report 10:30 AM ET
3-Month Bill Announcement 11:00 AM ET
6-Month Bill Announcement 11:00 AM ET
3-Yr Note Announcement 11:00 AM ET
10-Yr Note Announcement 11:00 AM ET
Eric Rosengren Speaks 12:30 PM ET
Money Supply 4:30 PM ET
Today's earnings reports.
Before open:
APWR A-Power Energy Generation Systems, Ltd. Utilities Electric Utilities
CM Canadian Imperial Bank of Commerce Financial Money Center Banks
CUB Cubic Corp. Technology Scientific & Technical Instruments
DLM Del Monte Foods Co. Consumer Goods Processed & Packaged Goods
FLOW Flow International Corp. Industrial Goods Machine Tools & Accessories
MDNU Medical Nutrition USA, Inc. Healthcare Drug Related Products
RSC REX Stores Corp. Services Electronics Stores
STST Argon ST, Inc. Technology Scientific & Technical Instruments
TD Toronto-Dominion Bank Financial Money Center Banks
TOL Toll Brothers Inc. Industrial Goods Residential Construction
TUTR Plato Learning, Inc. Services Business Services
UTIW UTI Worldwide, Inc. Services Air Delivery & Freight Services
After close:
AMSWA American Software, Inc. Technology Application Software
ARST ArcSight, Inc. Technology Business Software & Services
AVAV AeroVironment, Inc. Industrial Goods Aerospace/Defense Products & Services
AVGO Avago Technologies Limited Technology Semiconductor - Broad Line
CMTL Comtech Telecommunications Corp. Technology Communication Equipment
CPWM Cost Plus Inc. Services Department Stores
CRI Carter's, Inc. Consumer Goods Textile - Apparel Clothing
DMND Diamond Foods, Inc. Consumer Goods Processed & Packaged Goods
LAVA Magma Design Automation Inc. Technology Business Software & Services
LQDT Liquidity Services, Inc. Technology Internet Software & Services
MENT Mentor Graphics Corp. Technology Technical & System Software
MRVL Marvell Technology Group Ltd. Technology Semiconductor - Integrated Circuits
NOVL Novell Inc. Technology Security Software & Services
OHB Orleans Homebuilders Inc. Industrial Goods Residential Construction
ULTA Ulta Salon, Cosmetics & Fragrance, Inc. Services Personal Services
XETA XETA Technologies Inc. Technology Communication Equipment
Wednesday, December 2, 2009
Market wrap - 4:15
Mixed day in the market, not much happening.
Dow 10,453 -19 -0.18%
Nasdaq 2,185 9 0.42%
S&P 500 1,109 0 0.03%
GlobalDow 1,984 +6 +0.29%
Gold 1,213 +13 +1.07%
Oil 76.62 -1.77 -2.26%



Beige Book - 2:00
Full report here
Prepared at the Federal Reserve Bank of New York and based on information collected on or before November 20, 2009. This document summarizes comments received from businesses and other contacts outside the Federal Reserve and is not a commentary on the views of Federal Reserve officials.
Reports from the twelve Federal Reserve Districts indicate that economic conditions have generally improved modestly since the last report. Eight Districts indicated some pickup in activity or improvement in conditions, while the remaining four--Philadelphia, Cleveland, Richmond, and Atlanta--reported that conditions were little changed and/or mixed.
Consumer spending was reported to have picked up moderately since the last report, for both general merchandise and vehicles; a number of Districts noted relatively robust sales of used autos. Most Districts indicated that non-auto retailers were holding lean inventories going into the holiday season. Tourism activity varied across Districts. Manufacturing conditions were said to be, on balance, steady to moderately improving across most of the country, while conditions in the nonfinancial service sector generally strengthened somewhat, though with some variation across Districts and across industries. Residential real estate conditions were somewhat improved from very low levels, on balance, led by the lower end of the market. Most Districts reported some pickup in home sales, though prices were generally said to be flat or declining modestly; residential construction was characterized as weak, but some Districts did note some pickup in activity. Commercial real estate markets and construction activity were depicted as very weak and, in many cases, deteriorating.
Financial institutions generally reported steady to weaker loan demand, continued tight credit standards, and steady or deteriorating loan quality. In the agricultural sector, the fall harvest was delayed in the eastern half of the nation due to excessively wet conditions during October and early November. Most energy-producing Districts noted a slight uptick in activity in the sector since the last report. Labor market conditions remained weak since the last report, though there were signs of stabilization and scattered signs of improvement. While some Districts reported upward pressure on commodity prices, they saw little or no indication of upward wage pressures or of any significant increase in prices of finished goods.
Consumer Spending and Tourism
Consumer spending strengthened since the last report, with sales of both general merchandise and autos improving across much of the country. Non-auto sales were reported to have picked up in the New York, Philadelphia, Cleveland, Richmond, Atlanta, Kansas City, and San Francisco Districts; sales were described as steady or mixed in the Boston, Chicago, Minneapolis, and Dallas Districts. St. Louis described retail sales as below expectations and down from a year earlier. Auto sales generally improved since the last report, in some cases rebounding from a brief dip after the "cash-for-clunkers" program ended. Increased vehicle sales were reported from New York, Philadelphia, Richmond, Chicago, St. Louis, and Dallas, while sales were described as flat or mixed in the Cleveland, Minneapolis, Kansas City, and San Francisco Districts. A number of Districts reported that used vehicles have been selling better than new ones.
Most Districts also noted that retailers were holding leaner inventories this holiday season, though some indicate that retailers have recently become more optimistic about the holiday-season outlook. Auto dealers' inventories, largely depleted during the cash-for-clunkers program, have been or are being rebuilt.
Tourism was mixed across those Districts reporting. Travel and tourism--especially leisure travel--was described as robust or improved in the New York, Dallas, and San Francisco Districts. Atlanta and Kansas City characterized tourism as sluggish, while Richmond and Minneapolis described it as mixed; Richmond noted that tourism has been adversely affected by severe and damaging coastal storms, while Kansas City characterized the outlook as "grim." New York indicated that business travel remained sluggish, but Minneapolis and Dallas note a slight pickup.
Nonfinancial Services
Activity in the service sector generally picked up since the last report, though results were mixed across Districts and across service industries. New York and Philadelphia reported that service-sector activity overall remained steady to up slightly, while St. Louis noted expanding activity. The information technology industry was reported to be showing improvement in the Boston, Minneapolis, and Kansas City Districts. A pickup in activity at staffing firms was reported by Boston and Dallas, whereas New York noted that activity remained sluggish. Strength in health services was noted in the Boston and Richmond Districts. Shipping activity was characterized as flat in the Cleveland, Atlanta, and Kansas City District, while Dallas reports some gain; however, Dallas and Atlanta both noted particular weakness in rail shipping activity. Professional and business support firms reportedly registered some improvement in the St. Louis and Minneapolis Districts but flat to declining activity in Richmond and San Francisco.
Manufacturing
Most Districts reported mixed to moderately improving manufacturing conditions since the last report. New York, Philadelphia, Cleveland, Minneapolis, Kansas City, and San Francisco all noted modest increases in manufacturing activity within their Districts. Manufacturing conditions in the Boston and Dallas Districts were characterized as mixed, with some improvement noted for biopharmaceuticals companies in Boston and high-tech manufacturing firms in Dallas. By contrast, Richmond and Chicago both reported that manufacturing activity had leveled off since the last report, while activity continued to decline in the Atlanta and St. Louis Districts, although at a somewhat slower pace than the last report. Tighter credit limited the ability of customers to place new orders in the Richmond District, while in the Chicago District, contacts noted a slowdown in the restocking of inventories. Increases in activity related to the transportation industry were cited in the Chicago, St. Louis, Cleveland, and Kansas City Districts, although such activity was mixed in the Dallas District and reported as declining in the San Francisco District. Several Districts noted an uptick in food-related production.
Many Districts reported that their contacts were optimistic about the near-term outlook. Manufacturers in the Boston, New York, Philadelphia, Atlanta, Minneapolis, and Kansas City Districts expected business conditions to improve in the coming months, while producers in the Cleveland District expressed uncertainty about near-term conditions. The outlook in the Dallas District was mixed, with most manufacturers expressing cautious optimism about the near term and construction-related manufacturers expressing pessimism about the future largely due to expectations of prolonged weakness in commercial real estate.
Real Estate and Construction
Home sales and construction activity improved across much of the nation, though prices were generally said to be flat or still declining somewhat. A majority of Districts reported that the lower-priced segment of the housing market has outperformed the high end. Increases in sales activity were reported in the Boston, Cleveland, Richmond, Atlanta, Chicago, Minneapolis, Kansas City, Dallas, and San Francisco Districts, whereas sales were described as steady or mixed in the New York and Philadelphia Districts. Multifamily housing markets deteriorated further in the New York and Chicago Districts. More broadly, a number of eastern Districts reported continued declines in home prices--specifically, Boston, New York, Philadelphia, and Richmond. In contrast, prices were said to have firmed somewhat in the Dallas and San Francisco Districts and stabilized in the Chicago and Kansas City Districts. Most reports maintained that the lower end of the market has outperformed the higher end: New York, Philadelphia, Richmond, Atlanta, Minneapolis, and Kansas City all noted relative weakness at the high end of the market, with relative strength at the lower end; in most cases, this strength was largely attributed to the homebuyer tax credit (which was recently reinstated and expanded to include existing owners).
Despite the firming in sales, the level of new residential construction activity was generally characterized as weak, though recent trends have been mixed--Atlanta, Kansas City, and Dallas noted some pickup in home construction, whereas the Chicago and St. Louis Districts reported declines. Residential construction was described as flat or stabilizing by Cleveland, Minneapolis, and San Francisco.
Commercial real estate conditions were widely characterized as weak and, in many cases, deteriorating further. Market conditions were reported to have weakened in virtually all Districts, with rising vacancy rates, downward pressure on rents, and little, if any, new development. Expectations for 2010 were also quite low. Boston characterized the commercial real estate outlook as "bleak," Dallas noted that construction was at "historically low levels," and Kansas City described the sector as "distressed." Still, some Districts noted scattered signs of encouragement: Cleveland and Chicago referenced public-works projects as a source of increased business, Richmond noted signs of increased leasing activity from the health and education sectors, Atlanta indicated a modest pickup in new development projects, Minneapolis noted some recently started hotel and retail development, and San Francisco cited slight improvement in availability of financing for new development.
Banking and Finance
Banks reported steady to softer conditions in most Districts. Loan demand was said to have weakened in the New York, Philadelphia, Cleveland, St. Louis, Kansas City, and Dallas Districts. New York noted particular weakness in demand for home mortgage loans, whereas Richmond and St. Louis reported this to be the strongest segment of late. For the most part, the weakness appears to have been concentrated in the commercial sector, though Boston and Chicago reported some pickup in commercial real estate lending--largely refinancing. Credit quality showed signs of deteriorating in the New York, Philadelphia, Dallas, and San Francisco Districts but was described as stable or mixed in Cleveland, Chicago, and Kansas City, with Chicago reporting some improvement outside of commercial real estate. Increasingly tight credit standards were reported in the New York, Richmond, Chicago, St. Louis, Dallas, and San Francisco--largely on commercial loans.
Agriculture and Natural Resources
Excessively wet conditions during October and early November were reported in a number of Districts. As a result, the fall harvest was delayed in many parts of the Richmond, Atlanta, Chicago, St. Louis, Minneapolis, and Kansas City Districts. Flooding from Tropical Storm Ida and a November "nor'easter" damaged crops and delayed planting throughout the Richmond District, and Virginia health officials closed fishing in all Chesapeake Bay tributaries and temporarily banned the harvesting of shellfish due to potential storm water contamination. By contrast, rainfall in the Dallas District helped alleviate drought conditions experienced in many parts of the region. Contacts in the Chicago, Minneapolis, and Kansas City Districts noted that corn and soybean prices rallied over the past month, although a wide variation in margins was expected for crop farms due to differences in input costs. Losses for livestock operations occurred in the Chicago and Kansas City Districts.
Most energy-producing Districts reported a slight uptick in activity in extraction industries since the last report. Contacts in the Cleveland, Atlanta, Dallas, Minneapolis, Kansas City, and San Francisco Districts noted steady to increasing oil and natural gas production within their regions, albeit from low levels of production observed earlier this year. Contacts in the Cleveland District also reported that a sharp decline in coal production had leveled out since the last report. In general, oil prices increased somewhat, while reports on the price of natural gas were mixed due in large part to differences in inventory levels across Districts. Mining activity in the Minneapolis District increased.
Employment, Wages, and Prices
Labor market conditions remained weak since the last report, with further layoffs, sluggish hiring, and high levels of unemployment in most Districts. However, contacts in the Atlanta, Cleveland, and Richmond Districts reported that the pace of job cuts generally slowed in their regions, and most contacts in the Dallas District reported stable employment levels. Despite generally weak employment conditions, some signs of improvement were noted. For example, contacts in Boston reported that they were beginning to hire and reverse pay cuts or freezes that were implemented earlier in the year, and contacts in the St. Louis District reported that the service sector had started to expand recently. Expectations for the holiday season were mixed across Districts, with contacts in the New York and Dallas Districts reporting lighter-than-normal seasonal hiring and/or increases in the hours of existing employees, as opposed to hiring temporary workers, to meet the seasonal demand. On the other hand, most retailers in the Richmond District have hired the usual number of seasonal workers this year.
Districts generally reported little or no upward wage pressures, while some Districts noted upward pressure in commodity prices, and most Districts reported stable selling prices. Wages were largely reported to be holding steady in the Boston, Cleveland, Richmond, Chicago, Minneapolis, Kansas City, Dallas, and San Francisco Districts. Most Districts reported stable prices overall, although some reported higher input prices, largely for energy and other commodities used in production, with a limited ability to raise selling prices. Prices were reported as moderately lower in the Kansas City District, and downward price pressures were cited for some professional services and intermodal transportation firms in the Dallas District. Some makers of food products and chemicals in the Philadelphia District reported raising prices, and the prices of computer memory chips continued to firm in the San Francisco District. Retailers in several Districts indicated that they have managed inventory levels in an effort to prevent the steep price discounting that occurred last year, however, some promotional price discounting is expected through the holiday season.
Pre-market - Wednesday, December 2
Futures just plain flat today. Not worth posting - just flat.
Today's economic news:
MBA Purchase Applications 7:00 AM ET
Challenger Job-Cut Report 7:30 AM ET
ADP Employment Report 8:15 AM ET
Tim Geithner Speaks 9:30 AM ET
EIA Petroleum Status Report 10:30 AM ET
Beige Book 2:00 PM ET
Before open:
CHRS Charming Shoppes Inc. Services Apparel Stores
DSGX Descartes Systems Group Inc. Technology Business Software & Services
GIII G-III Apparel Group, Ltd. Consumer Goods Textile - Apparel Clothing
JOSB Jos. A Bank Clothiers Inc. Services Apparel Stores
PTRY Pantry Inc. Services Grocery Stores
SYNO Synovis Life Technologies Inc. Healthcare Medical Appliances & Equipment
After close:
ARO Aeropostale Inc. Services Apparel Stores
ATCO American Technology Corp. Technology Diversified Electronics
CWST Casella Waste Systems Inc. Industrial Goods Waste Management
DDMX Dynamex Inc. Services Trucking
JAS Jo-Ann Stores, Inc. Services Specialty Retail, Other
PSS Collective Brands, Inc. Services Apparel Stores
SEAC SeaChange International Inc. Technology Processing Systems & Products
SIGM Sigma Designs, Inc. Technology Semiconductor - Specialized
SNPS Synopsys Inc. Technology Technical & System Software
Tuesday, December 1, 2009
Market wrap - 6:30
Just another day in the casino. Large gap up this morning, traded a bit higher during the day, only to sell off a bit in the last hour and a half. Notice GS & AAPL, the leaders since March.
Dow 10,472 127 1.23%
Nasdaq 2,176 31 1.46%
S&P 500 1,109 +13 +1.21%
Gold 1,200 +18 +1.51%
Oil 77.93 +1.09 +1.41%


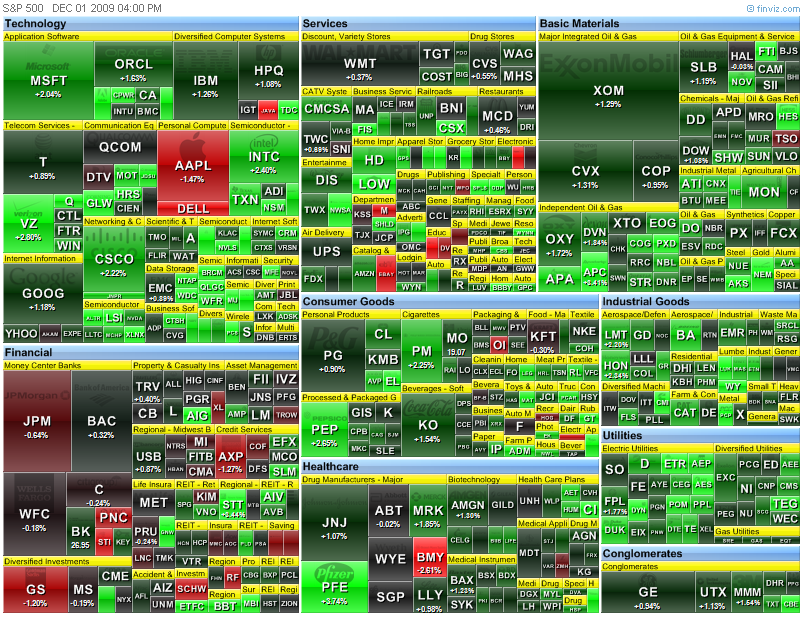
ISM manufacturing - 10:00 - late because link did not work
Full report here
November 2009 Manufacturing ISM Report On Business®
PMI at 53.6%
DO NOT CONFUSE THIS NATIONAL REPORT with the various regional purchasing reports released across the country. The national report's information reflects the entire United States, while the regional reports contain primarily regional data from their local vicinities. Also, the information in the regional reports is not used in calculating the results of the national report. The information compiled in this report is for the month of November 2009.
New Orders, Production and Employment Growing
Inventories Contracting
Supplier Deliveries Slower
(Tempe, Arizona) — Economic activity in the manufacturing sector expanded in November for the fourth consecutive month, and the overall economy grew for the seventh consecutive month, say the nation's supply executives in the latest Manufacturing ISM Report On Business®.
The report was issued today by Norbert J. Ore, CPSM, C.P.M., chair of the Institute for Supply Management™ Manufacturing Business Survey Committee. "The manufacturing sector grew for the fourth consecutive month in November. While the rate of growth slowed when compared to October, the signs are still encouraging for continuing growth as both new orders and production are still at very positive levels, and the Prices Index fell 10 points, signaling less inflationary pressure on manufacturers' costs. Overall, the recovery in manufacturing is continuing, but many are still struggling based on their comments."
PERFORMANCE BY INDUSTRY
In November, 12 of the 18 manufacturing industries reported growth. The industries — listed in order — are: Apparel, Leather & Allied Products; Printing & Related Support Activities; Petroleum & Coal Products; Miscellaneous Manufacturing; Electrical Equipment, Appliances & Components; Transportation Equipment; Chemical Products; Computer & Electronic Products; Food, Beverage & Tobacco Products; Paper Products; Fabricated Metal Products; and Machinery. The five industries reporting contraction in November are: Wood Products; Furniture & Related Products; Nonmetallic Mineral Products; Primary Metals; and Plastics & Rubber Products.
WHAT RESPONDENTS ARE SAYING ...
* "Becoming concerned about the value of the U.S. dollar." (Apparel, Leather & Allied Products)
* "Low value of the dollar driving commodity costs higher." (Food, Beverage & Tobacco Products)
* "Demand from automotive manufacturers remains strong and building." (Fabricated Metal Products)
* "Capital construction seems to be picking up, and we are seeing more jobs that are bid out." (Electrical Equipment, Appliances & Components)
* "Steady increase in business." (Primary Metals)
 COMMODITIES REPORTED UP/DOWN IN PRICE and IN SHORT SUPPLY
Commodities Up in Price
Aluminum (5); Copper (6); Copper Based Products (5); Natural Gas (2); Oil; and Steel (5).
Commodities Down in Price
No commodities are reported down in price.
Commodities in Short Supply
Electronic Components is the only commodity reported in short supply.
Note: The number of consecutive months the commodity is listed is indicated after each item.
PMI
Manufacturing growth decelerated in November as the PMI registered 53.6 percent, a decrease of 2.1 percentage points when compared to October's reading of 55.7 percent. This continues the recovery in the sector, but at a slower rate of growth. A reading above 50 percent indicates that the manufacturing economy is generally expanding; below 50 percent indicates that it is generally contracting.
A PMI in excess of 41.2 percent, over a period of time, generally indicates an expansion of the overall economy. Therefore, the PMI indicates growth for the seventh consecutive month in the overall economy, as well as expansion in the manufacturing sector for the fourth consecutive month. Ore stated, "The past relationship between the PMI and the overall economy indicates that the average PMI for January through November (45.4 percent) corresponds to a 1.3 percent increase in real gross domestic product (GDP). However, if the PMI for November (53.6 percent) is annualized, it corresponds to a 3.9 percent increase in real GDP annually."
THE LAST 12 MONTHS
COMMODITIES REPORTED UP/DOWN IN PRICE and IN SHORT SUPPLY
Commodities Up in Price
Aluminum (5); Copper (6); Copper Based Products (5); Natural Gas (2); Oil; and Steel (5).
Commodities Down in Price
No commodities are reported down in price.
Commodities in Short Supply
Electronic Components is the only commodity reported in short supply.
Note: The number of consecutive months the commodity is listed is indicated after each item.
PMI
Manufacturing growth decelerated in November as the PMI registered 53.6 percent, a decrease of 2.1 percentage points when compared to October's reading of 55.7 percent. This continues the recovery in the sector, but at a slower rate of growth. A reading above 50 percent indicates that the manufacturing economy is generally expanding; below 50 percent indicates that it is generally contracting.
A PMI in excess of 41.2 percent, over a period of time, generally indicates an expansion of the overall economy. Therefore, the PMI indicates growth for the seventh consecutive month in the overall economy, as well as expansion in the manufacturing sector for the fourth consecutive month. Ore stated, "The past relationship between the PMI and the overall economy indicates that the average PMI for January through November (45.4 percent) corresponds to a 1.3 percent increase in real gross domestic product (GDP). However, if the PMI for November (53.6 percent) is annualized, it corresponds to a 3.9 percent increase in real GDP annually."
THE LAST 12 MONTHS

 COMMODITIES REPORTED UP/DOWN IN PRICE and IN SHORT SUPPLY
Commodities Up in Price
Aluminum (5); Copper (6); Copper Based Products (5); Natural Gas (2); Oil; and Steel (5).
Commodities Down in Price
No commodities are reported down in price.
Commodities in Short Supply
Electronic Components is the only commodity reported in short supply.
Note: The number of consecutive months the commodity is listed is indicated after each item.
PMI
Manufacturing growth decelerated in November as the PMI registered 53.6 percent, a decrease of 2.1 percentage points when compared to October's reading of 55.7 percent. This continues the recovery in the sector, but at a slower rate of growth. A reading above 50 percent indicates that the manufacturing economy is generally expanding; below 50 percent indicates that it is generally contracting.
A PMI in excess of 41.2 percent, over a period of time, generally indicates an expansion of the overall economy. Therefore, the PMI indicates growth for the seventh consecutive month in the overall economy, as well as expansion in the manufacturing sector for the fourth consecutive month. Ore stated, "The past relationship between the PMI and the overall economy indicates that the average PMI for January through November (45.4 percent) corresponds to a 1.3 percent increase in real gross domestic product (GDP). However, if the PMI for November (53.6 percent) is annualized, it corresponds to a 3.9 percent increase in real GDP annually."
THE LAST 12 MONTHS
COMMODITIES REPORTED UP/DOWN IN PRICE and IN SHORT SUPPLY
Commodities Up in Price
Aluminum (5); Copper (6); Copper Based Products (5); Natural Gas (2); Oil; and Steel (5).
Commodities Down in Price
No commodities are reported down in price.
Commodities in Short Supply
Electronic Components is the only commodity reported in short supply.
Note: The number of consecutive months the commodity is listed is indicated after each item.
PMI
Manufacturing growth decelerated in November as the PMI registered 53.6 percent, a decrease of 2.1 percentage points when compared to October's reading of 55.7 percent. This continues the recovery in the sector, but at a slower rate of growth. A reading above 50 percent indicates that the manufacturing economy is generally expanding; below 50 percent indicates that it is generally contracting.
A PMI in excess of 41.2 percent, over a period of time, generally indicates an expansion of the overall economy. Therefore, the PMI indicates growth for the seventh consecutive month in the overall economy, as well as expansion in the manufacturing sector for the fourth consecutive month. Ore stated, "The past relationship between the PMI and the overall economy indicates that the average PMI for January through November (45.4 percent) corresponds to a 1.3 percent increase in real gross domestic product (GDP). However, if the PMI for November (53.6 percent) is annualized, it corresponds to a 3.9 percent increase in real GDP annually."
THE LAST 12 MONTHS

Pending home sales - 10:00
Full report here
Pending home sales have risen for nine months in a row, a first for the series of the index since its inception in 2001, according to the National Association of Realtors®.
The Pending Home Sales Index,* a forward-looking indicator based on contracts signed in October, increased 3.7 percent to 114.1 from 110.0 in September, and is 31.8 percent above October 2008 when it was 86.6. The rise from a year ago is the biggest annual increase ever recorded for the index, which is at the highest level since March 2006 when it was 115.2.
Lawrence Yun, NAR chief economist, said home sales are experiencing a pendulum swing. “Keep in mind that housing had been underperforming over most of the past year. Based on the demographics of our growing population, existing-home sales should be in the range of 5.5 million to 6.0 million annually, but we were well below the 5-million mark before the home buyer tax credit stimulus,” he said. “This means the tax credit is helping unleash a pent-up demand from a large pool of financially qualified renters, much more than borrowing sales from the future.
The PHSI in the Northeast surged 19.9 percent to 100.2 in October and is 44.2 percent above a year ago. In the Midwest the index rose 11.6 percent to 109.6 and is 36.6 percent higher than October 2008. Pending home sales in the South increased 5.4 percent to an index of 115.4, which is 31.6 percent above a year ago. In the West the index fell 11.2 percent to 127.7 but is 21.9 percent above October 2008.
Yun cautioned that home sales could dip in the months ahead. “The expanded tax credit has only been available for the past three weeks, but the time between when buyers start looking at homes until they close on a sale can take anywhere from three to five months. Given the lag time, we could see a temporary decline in closed existing-home sales from December until early spring when we get another surge, but the weak job market remains a major concern and could slow the recovery process.
“Still, as inventories continue to decline and balance is gradually restored between buyers and sellers, we should reach self-sustaining housing conditions and firming home prices in most areas around the middle of 2010. That would mean broad wealth stabilization for the vast number of middle-class families,” Yun said.
The National Association of Realtors®, “The Voice for Real Estate,” is America’s largest trade association, representing 1.2 million members involved in all aspects of the residential and commercial real estate industries.
Construction spending - 10:00
Full report here
OCTOBER 2009 CONSTRUCTION AT $910.8 BILLION ANNUAL RATE
The U.S. Census Bureau of the Department of Commerce announced today that construction spending during October 2009 was estimated at a seasonally adjusted annual rate of $910.8 billion, nearly the same as (±1.6%)* the revised September estimate of $910.4 billion. The October figure is 14.4 percent (±1.6%) below the October 2008 estimate of $1,064.1 billion. During the first 10 months of this year, construction spending amounted to $794.0 billion, 12.6 percent (±1.1%) below the $908.9 billion for the same period in 2008.
PRIVATE CONSTRUCTION
Spending on private construction was at a seasonally adjusted annual rate of $589.0 billion, 0.3 percent (±1.1%)* above the revised September estimate of $587.2 illion. Residential construction was at a seasonally adjusted annual rate of $250.3 billion in October, 4.4 percent (±1.3%) above the revised September estimate of $239.7 billion. Nonresidential construction was at a seasonally adjusted annual rate of $338.6 billion in October, 2.5 percent (±1.1%) below the revised September estimate of $347.5 billion.
PUBLIC CONSTRUCTION
In October, the estimated seasonally adjusted annual rate of public construction spending was $321.8 billion, 0.4 percent (±2.4%)* below the revised September estimate of $323.2 billion. Educational construction was at a seasonally adjusted
annual rate of $85.7 billion, 1.1 percent (±2.9%)* above the revised September estimate of $84.7 billion. Highway construction was at a seasonally adjusted annual rate of $87.2 billion, 0.3 percent (±6.6%)* below the revised September estimate of $87.4 billion.
Pre-market - Tuesday - December 1
Futures up on a falling dollar
DJIA INDEX 10,400.00 66.00
S&P 500 1,102.80 8.00
NASDAQ 100 1,781.00 13.50
Today's economic reports:
Motor Vehicle Sales
ICSC-Goldman Store Sales 7:45 AM ET
Redbook 8:55 AM ET
ISM Mfg Index 10:00 AM ET
Construction Spending 10:00 AM ET
Pending Home Sales Index 10:00 AM ET
4-Week Bill Auction 11:30 AM ET
Today's earnings reports:
Before open:
BECN Beacon Roofing Supply Inc. Services Building Materials Wholesale
GIGM GigaMedia Ltd. Technology Internet Software & Services
ISLE Isle of Capri Casinos Inc. Services Resorts & Casinos
LDR Landauer Inc. Services Research Services
NPD China Nepstar Chain Drugstore Ltd. Services Drug Stores
SPLS Staples, Inc. Services Specialty Retail, Other
THO Thor Industries Inc. Consumer Goods Recreational Vehicles
UTI Universal Technical Institute Inc. Services Education & Training Services
After close:
CFI Culp Inc. Industrial Goods Textile Industrial
CPRT Copart Inc. Services Auto Dealerships
GAME Shanda Games Limited Services Entertainment - Diversified
LTXC LTX-Credence Corporation Technology Semiconductor Equipment & Materials
SNDA Shanda Interactive Entertainment Ltd. Technology Internet Software & Services
Market wrap - a day late -
Dow 10,345 35 0.34%
Nasdaq 2,145 6 0.29%
S&P 500 1,096 4 0.38%
GlobalDow1,961 +21 +1.07%
Gold 1,183 8 0.64%
Oil 78.05 0.83 1.07%


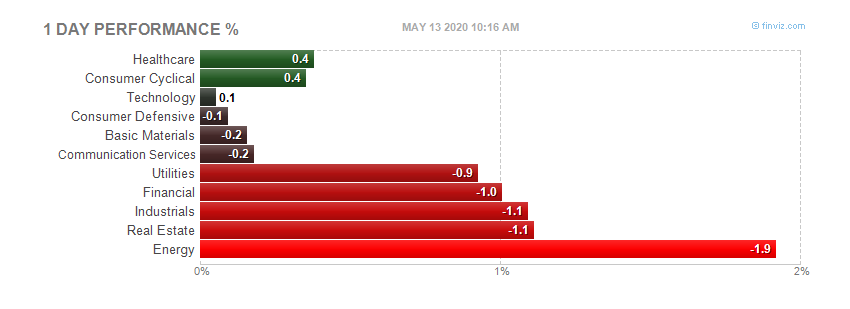
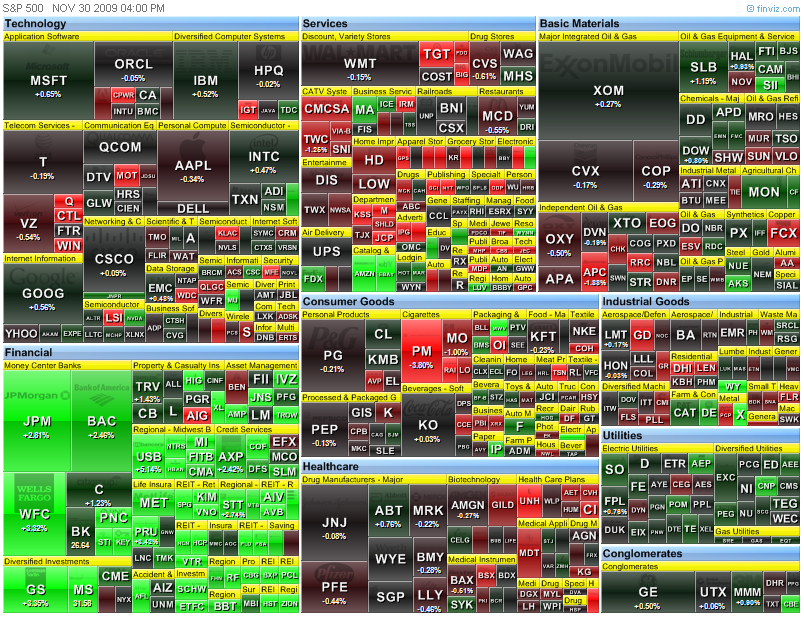
Monday, November 30, 2009
Chicago PMI - 9:45
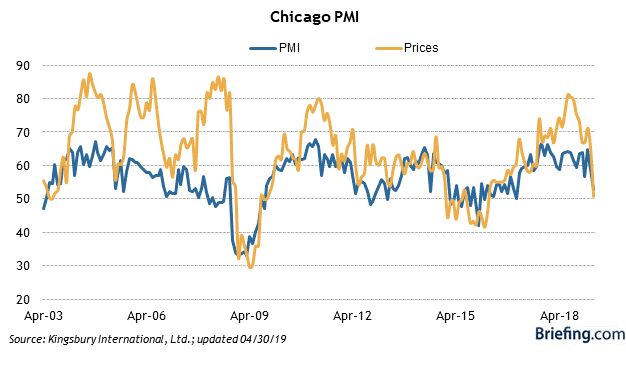 Highlights
* The Chicago PMI index jumped over the 50 point threshold for the first time since September 2008 as the index grew to 54.2 in October. The consensus expected the index to increase slightly to 49.0 from 46.1 and remain in the contraction phase.
* The production index increased to 63.9 from 47.2 and orders rose to 61.4 from 46.3.
* Inventories continued to contract and have gotten worse over the last month as the index declined to 32.2 from 38.9.
* The only other sector that continued to contract was employment, which declined to 38.3 from 38.8.
* Other components of the index showed the manufacturing sector strengthening including order backlogs, which increased to 41.9 from 36.7 and prices paid, which declined to 48.6 from 51.3.
Key Factors
* The entire index showed signs of a sustainable expansionary cycle.
* Unlike last month's national index, where production grew on the anticipation of new orders that never came in, production and new orders posted strong growth and entered an expansionary phase in the Chicago region.
Big Picture
* The Chicago PMI has little overall economic value, and is only watched by the financial markets because it is usually released one day in advance of the similar national ISM manufacturing survey. A significant move in this regional survey will therefore sometimes be seen as having predictive value for the ISM index.
Highlights
* The Chicago PMI index jumped over the 50 point threshold for the first time since September 2008 as the index grew to 54.2 in October. The consensus expected the index to increase slightly to 49.0 from 46.1 and remain in the contraction phase.
* The production index increased to 63.9 from 47.2 and orders rose to 61.4 from 46.3.
* Inventories continued to contract and have gotten worse over the last month as the index declined to 32.2 from 38.9.
* The only other sector that continued to contract was employment, which declined to 38.3 from 38.8.
* Other components of the index showed the manufacturing sector strengthening including order backlogs, which increased to 41.9 from 36.7 and prices paid, which declined to 48.6 from 51.3.
Key Factors
* The entire index showed signs of a sustainable expansionary cycle.
* Unlike last month's national index, where production grew on the anticipation of new orders that never came in, production and new orders posted strong growth and entered an expansionary phase in the Chicago region.
Big Picture
* The Chicago PMI has little overall economic value, and is only watched by the financial markets because it is usually released one day in advance of the similar national ISM manufacturing survey. A significant move in this regional survey will therefore sometimes be seen as having predictive value for the ISM index.
Pre-market - Monday, November 30, 2009
Futures down slightly on the Dubai worries.
DJIA INDEX 10,280.00 -12.00
S&P 500 1,087.70 -1.80
NASDAQ 100 1,757.25 -2.00
Today's economic reports:
Chicago PMI9:45 AM ET
4-Week Bill Announcement 11:00 AM ET
3-Month Bill Auction 11:30 AM ET
6-Month Bill Auction 11:30 AM ET
Farm Prices 3:00 PM ET
Today's earnings reports.
Before open:
NRGY Inergy, L.P. Services Specialty Retail, Other
PATR Patriot Transportation Holding Inc. Services Trucking
TLVT Telvent Git S.A. Technology Computer Based Systems
UNFY Unify Corp. Technology Business Software & Services
After close:
GES Guess? Inc. Services Apparel Stores
LTON Linktone Ltd. Technology Wireless Communications
OVTI OmniVision Technologies Inc. Technology Semiconductor - Integrated Circuits
SNS Steak n Shake Co. Services Restaurants
SOFOD Sonic Foundry Inc. Technology Application Software
ZOLT Zoltek Companies Inc. Industrial Goods Industrial Electrical Equipment
Subscribe to:
Posts (Atom)

