Thursday, November 19, 2009
Mortgage delinquencies hit record-high in 3Q - 10:45
From Yahoo & AP
Mortgage delinquencies hit record-high in 3Q
Delinquencies and foreclosures set 9th straight record in 3rd quarter as layoffs keep rising
* By Alan Zibel, AP Real Estate Writer
* On 10:05 am EST, Thursday November 19, 2009
WASHINGTON (AP) -- More than 14 percent of American homeowners with a mortgage were either behind on their payments or in foreclosure at the end of September, a record-high for the ninth straight quarter and a problem that could threaten the economic recovery.
The Mortgage Bankers Association's report Thursday adds to fears that the housing market and broader recovery could be thwarted by the continuing surge in home loan defaults, especially as the unemployment rate keeps rising. Lost jobs, rather than the shady loans made during the housing boom, are now the main reason homeowners fall behind on their mortgages.
After three years of plunging prices, the housing market started to rebound this summer. While optimists hope the worst is over, pessimists say there are simply too many foreclosed properties that have yet to be dumped on the market and expect further price declines.
About 4 million homeowners were either in foreclosure or at least three months behind on their mortgage payments as of September, according to the mortgage bankers group. Even if a quarter of those borrowers are able to stay in their homes, "there's a lot of potential inventory coming into the market next year," said Jay Brinkmann, chief economist with the Mortgage Bankers Association.
Those foreclosures will push home prices downward, especially in the hardest-hit California and Florida cities, places that are also coping with soaring unemployment, he said.
The record-high foreclosure numbers are being driven by borrowers with traditional fixed-rate mortgages, rather than the shady subprime loans with adjustable rates that kicked off the mortgage crisis.
Fixed-rate loans made to so-called prime borrowers with good credit histories caused nearly 33 percent of new foreclosures in the July-September quarter, compared with 21 percent a year ago.
Subprime loans with adjustable rates have fallen to 16 percent of new foreclosures from 35 percent a year earlier.
Loans backed by the Federal Housing Administration also show increasing signs of trouble. More than 18 percent of FHA borrowers are at least one payment behind or in foreclosure.
Among states, the worst of the trouble is still concentrated in California, Nevada, Arizona and Florida, which accounted for 44 percent of new foreclosures in the country. Nearly 13 percent of all loans in Florida were in foreclosure, the highest in the U.S., followed by Nevada at more than 9 percent.


Philly Fed - 10:00
Full report here
November 2009 Business Outlook Survey
Activity in the region's manufacturing sector is picking up, according to firms polled for this month's Business Outlook Survey. Indexes for general activity, new orders, and shipments all improved this month. The overall level of employment was mostly steady this month, and the average work hours index was positive for the first time in more than two years. The region's manufacturing executives expect increasing activity over the next six months, although expectations have moderated somewhat in the last several months. Low rates of current capacity utilization are suppressing capital spending plans.
Indicators Suggest Activity Is Picking Up
The survey's broadest measure of manufacturing conditions, the diffusion index of current activity, increased from a reading of 11.5 in October to 16.7 this month. The index has now remained positive for four consecutive months (see Chart). The percentage of firms reporting increases in activity this month (29 percent) exceeded the percentage reporting decreases (12 percent). Other broad indicators suggest similar improvement this month. The current new orders index also remained positive for the fourth consecutive month and increased nine points. The current shipments index increased 12 points. The current inventory index, although still negative, increased 15 points, from -31.8 in October to -17.3 this month. Indexes for unfilled orders and delivery times remained negative.
Labor market conditions have been stabilizing in recent months. The current employment index increased six points, from -6.8 to near zero. The percentage of firms reporting employment increases and decreases were essentially the same this month (14 percent). The workweek index edged seven points higher in November to its first positive reading in 23 months.
Prices of Manufactured Goods Are Near Steady
Recently reported declines in prices for manufactured goods were not as widespread this month. The prices received index increased three points, to -1.5, suggesting nearly steady prices for manufactured goods this month. Still, firms continue to report higher prices for purchased inputs. The prices paid index, which had been increasing for three consecutive months, fell back six points this month, to 14.9.
Manufacturers Are Generally Optimistic
The future general activity index remained positive for the 11th consecutive month but decreased from 39.8 in September to 36.8, its lowest reading since April (see Chart). Despite lower readings in recent months, indicators of future activity remain near levels not seen since 2004. Indexes for future new orders and shipments declined this month, falling five points and nine points, respectively. For the seventh consecutive month, the percentage of firms expecting employment to increase over the next six months exceeded the percentage expecting declines (27 percent versus 19 percent).
In this month's special questions, firms were asked about their current capacity utilization and capital spending plans (see Special Questions). Over 58 percent of the firms indicated that their current capacity utilization rate was less than 70 percent; only 8 percent of firms reported utilization rates lower than 70 percent before the beginning of the recession. The percentage of firms that indicated capital spending on plant and equipment would be lower next year (41 percent) substantially exceeded the percentage that indicated capital spending would be higher (16 percent). Firms indicated, on average, that capacity utilization would need to increase to nearly 84 percent before they would be inclined to increase spending to increase capacity at their plant.
Summary
According to respondents to the November Business Outlook Survey, manufacturing conditions are improving. The survey's indicators for general activity, new orders, and shipments were higher this month. Employment was nearly flat this month, and more firms reported an increase in work hours. Firms still expect continued improvement over the next six months, although future indicators suggest that optimism has waned somewhat in recent months. Capital spending plans are being held back by low plant utilization rates.
More at link with formatted tables
Leading indicators - 10:00
Full report here
Released: Thursday, November 19, 2009
The Conference Board Leading Economic Index™ (LEI) for the U.S. increased 0.3 percent in October, following a 1.0 percent gain in September, and a 0.4 percent rise in August.
Download a PDF of the technical notes for underlying detail, diffusion indexes, components, contributions and graphs.
Download a PDF of the press release with graph and summary table.
Says Ataman Ozyildirim, Economist at The Conference Board: “After half a year of consecutive increases, the month-to-month growth of the LEI is stabilizing and the gains continue to be broad-based. Meanwhile, the coincident economic index has been essentially flat since June, after declining since November 2007. The composite indexes suggest the recovery is unfolding and economic activity should continue improving in the near term.”
Says Ken Goldstein, Economist at The Conference Board: “The data indicates that economic recovery is finally setting in. We can expect slow growth through the first half of 2010. The pace of growth, however, will depend critically on how much demand picks up, and how soon.”
The Conference Board Coincident Economic Index™ (CEI) for the U.S. was unchanged in October, following a 0.1 percent decline in September, and a 0.1 percent increase in August. The Conference Board Lagging Economic Index™ (LAG) declined 0.2 percent in October, following a 0.5 percent decline in September, and a 0.4 percent decline in August.
The next release is scheduled for December 17, 2009 at 10 A.M. ET.
Interview with Elizabeth Warren on CNBC - 9:30
Pretty good interview with Elizabeth Warren on CNBC about TARP and the economy.
Jobless claims - 8:30 am
Full report here
UNEMPLOYMENT INSURANCE WEEKLY CLAIMS REPORT
SEASONALLY ADJUSTED DATA
In the week ending Nov. 14, the advance figure for seasonally adjusted initial claims was 505,000, unchanged from the previous week's revised figure of 505,000. The 4-week moving average was 514,000, a decrease of 6,500 from the previous week's revised average of 520,500.
The advance seasonally adjusted insured unemployment rate was 4.3 percent for the week ending Nov. 7, unchanged from the prior week's unrevised rate of 4.3 percent.
The advance number for seasonally adjusted insured unemployment during the week ending Nov. 7 was 5,611,000, a decrease of 39,000 from the preceding week's revised level of 5,650,000. The 4-week moving average was 5,711,500, a decrease of 83,500 from the preceding week's revised average of 5,795,000.
The fiscal year-to-date average for seasonally adjusted insured unemployment for all programs is 5.992 million.
UNADJUSTED DATA
The advance number of actual initial claims under state programs, unadjusted, totaled 479,295 in the week ending Nov. 14, a decrease of 53,132 from the previous week. There were 513,000 initial claims in the comparable week in 2008.
The advance unadjusted insured unemployment rate was 3.7 percent during the week ending Nov. 7, a decrease of 0.1 percentage point from the prior week. The advance unadjusted number for persons claiming UI benefits in state programs totaled 4,881,874, a decrease of 79,243 from the preceding week. A year earlier, the rate was 2.6 percent and the volume was 3,521,971.
Extended benefits were available in Alabama, Alaska, Arizona, California, Colorado, Connecticut, Delaware, the District of Columbia, Florida, Georgia, Idaho, Illinois, Indiana, Kansas, Kentucky, Maine, Massachusetts, Michigan, Minnesota, Missouri, Nevada, New Hampshire, New Jersey, New Mexico, New York, North Carolina, Ohio, Oregon, Pennsylvania, Puerto Rico, Rhode Island, South Carolina, Tennessee, Texas, Vermont, Virginia, Washington, West Virginia, and Wisconsin during the week ending Oct. 31.
Initial claims for UI benefits by former Federal civilian employees totaled 2,331 in the week ending Nov. 7, a decrease of 62 from the prior week. There were 2,480 initial claims by newly discharged veterans, an increase of 199 from the preceding week.
There were 24,799 former Federal civilian employees claiming UI benefits for the week ending Oct. 31, an increase of 2,273 from the previous week. Newly discharged veterans claiming benefits totaled 34,919, an increase of 699 from the prior week.
States reported 3,622,091 persons claiming EUC (Emergency Unemployment Compensation) benefits for the week ending Oct. 31, an increase of 101,838 from the prior week. There were 772,645 claimants in the comparable week in 2008. EUC weekly claims include both first and second tier activity.
The highest insured unemployment rates in the week ending Oct. 31 were in Puerto Rico (6.1 percent), Oregon (5.5), Nevada (5.2), Alaska (5.0), California (5.0), Arkansas (4.9), Wisconsin (4.9), Michigan (4.8), Pennsylvania (4.8), and Washington (4.7).
The largest increases in initial claims for the week ending Nov. 7 were in Michigan (+6,001), New Jersey (+4,153), Pennsylvania (+3,552), New York (+3,508), and Ohio (+3,292), while the largest decreases were in Florida (-1,915), Arkansas (-734), Oregon (-274), South Carolina (-116), and West Virginia (-19).
More at link with formatted tables
Pre-market - Thursday - November 19, 2009
Futures down pretty good this morning. Important data to come out at 8:30.
DJIA INDEX 10,330.00 -74.00
S&P 500 1,098.10 -10.40
NASDAQ 100 1,785.75 -14.75
Today's economic reports:
Jobless Claims 8:30 AM ET
Leading Indicators 10:00 AM ET
Philadelphia Fed Survey 10:00 AM ET
EIA Natural Gas Report 10:30 AM ET
3-Month Bill Announcement 11:00 AM ET
6-Month Bill Announcement 11:00 AM ET
2-Yr Note Announcement 11:00 AM ET
5-Yr Note Announcement 11:00 AM ET
7-Yr Note Announcement 11:00 AM ET
Money Supply4:30 PM ET
Today's earnings reports.
Before open:
BKE Buckle Inc. Services Apparel Stores
BONT Bon-Ton Stores Inc. Services Department Stores
BRC Brady Corp. Services Business Services
CATO Cato Corp. Services Apparel Stores
CMED China Medical Technologies Inc. Healthcare Medical Instruments & Supplies
CMRG Casual Male Retail Group, Inc. Services Apparel Stores
DKS Dick's Sporting Goods Inc. Services Sporting Goods Stores
DWCH Datawatch Corp. Technology Business Software & Services
GME GameStop Corp. Services Electronics Stores
HP Helmerich & Payne Inc. Basic Materials Oil & Gas Drilling & Exploration
IGLD Internet Gold Golden Lines Ltd. Technology Diversified Communication Services
KLIC Kulicke & Soffa Industries Inc. Technology Semiconductor Equipment & Materials
NJR New Jersey Resources Corp. Utilities Gas Utilities
NWY New York & Company Inc. Services Apparel Stores
PDCO Patterson Companies Inc. Services Medical Equipment Wholesale
PLCE The Children's Place Retail Stores, Inc. Services Apparel Stores
RAVN Raven Industries Inc. Technology Printed Circuit Boards
ROST Ross Stores Inc. Services Apparel Stores
SBH Sally Beauty Holdings Inc. Services Specialty Retail, Other
SCHS School Specialty Inc. Services Wholesale, Other
SCMR Sycamore Networks Inc. Technology Networking & Communication Devices
SCVL Shoe Carnival Inc. Services Apparel Stores
SHLD Sears Holdings Corporation Services Department Stores
SI Siemens AG Technology Telecom Services - Foreign
SMRT Stein Mart Inc. Services Apparel Stores
SSI Stage Stores Inc. Services Apparel Stores
STP Suntech Power Holdings Co. Ltd. Technology Diversified Electronics
TDG TransDigm Group Incorporated Industrial Goods Aerospace/Defense Products & Services
TSL Trina Solar Ltd. Technology Semiconductor - Specialized
TWMC Trans World Entertainment Corporation Services Music & Video Stores
WSM Williams-Sonoma Inc. Services Home Furnishing Stores
After market closes:
ADCT ADC Telecommunications Inc. Technology Communication Equipment
APWR A-Power Energy Generation Systems, Ltd. Utilities Electric Utilities
ARUN Aruba Networks, Inc. Technology Computer Peripherals
BAMM Books-A-Million Inc. Services Specialty Retail, Other
CENT Central Garden & Pet Co. Services Wholesale, Other
CHRD Chordiant Software, Inc. Technology Technical & System Software
DBRN Dress Barn Inc. Services Apparel Stores
DELL Dell Inc. Technology Personal Computers
EFUT e-Future Information Technology Inc. Technology Business Software & Services
FL Foot Locker Inc. Services Apparel Stores
GFF Griffon Corporation Industrial Goods General Building Materials
GPS Gap Inc. Services Apparel Stores
HIBB Hibbett Sports, Inc. Services Sporting Goods Stores
INTU Intuit Inc. Technology Application Software
MTSC MTS Systems Corp. Technology Scientific & Technical Instruments
OHB Orleans Homebuilders Inc. Industrial Goods Residential Construction
OMER Omeros Corporation Healthcare Drug Manufacturers - Major
TSCM TheStreet.com, Inc. Technology Internet Information Providers
VRGY Verigy, Ltd. Technology Semiconductor Equipment & Materials
WTSLA Wet Seal Inc. Services Apparel Stores
ZUMZ Zumiez, Inc. Services Apparel Stores
Wednesday, November 18, 2009
Market wrap - 4:30
Just a slow no volume day - again.
Dow 10,426 -11 -0.11%
Nasdaq 2,193 -11 -0.48%
S&P 500 1,110 -1 -0.05%
Gold 1,141 +2 +0.17%
Oil 79.74 0.44 0.56%



Housing starts - 8:30
Full report here
NEW RESIDENTIAL CONSTRUCTION IN OCTOBER 2009
The U.S. Census Bureau and the Department of Housing and Urban Development jointly announced the following new residential construction statistics for October 2009:
BUILDING PERMITS
Privately-owned housing units authorized by building permits in October were at a seasonally adjusted annual rate of 552,000. This is 4.0 percent (±1.9%) below the revised September rate of 575,000 and is 24.3 percent (±1.9%) below the October 2008
estimate of 729,000. Single-family authorizations in October were at a rate of 451,000; this is 0.2 percent (±1.0%)* below the revised September figure of
452,000. Authorizations of units in buildings with five units or more were at a rate of 85,000 in October.
HOUSING STARTS
Privately-owned housing starts in October were at a seasonally adjusted annual rate of 529,000. This is 10.6 percent (±8.7%) below the revised September estimate of 592,000 and is 30.7 percent (±8.3%) below the October 2008 rate of 763,000. Single-family housing starts in October were at a rate of 476,000; this is 6.8 percent (±7.5%)* below the revised September figure of 511,000. The October rate for units in buildings with five units or more was 48,000.
HOUSING COMPLETIONS
Privately-owned housing completions in October were at a seasonally adjusted annual rate of 740,000. This is 1.9 percent (±12.4%)* above the revised September estimate of 726,000, but is 29.9 percent (±9.7%) below the October 2008 rate of 1,055,000.
Single-family housing completions in October were at a rate of 528,000; this is 10.7 percent (±14.5%)* above the revised September figure of 477,000. The October rate for units in buildings with five units or more was 200,000.
CPI - 8:30
Full report here
Consumer Price Index - October 2009
On a seasonally adjusted basis, the Consumer Price Index for All
Urban Consumers (CPI-U) rose 0.3 percent in October, the U.S. Bureau
of Labor Statistics reported today. The index has decreased 0.2
percent over the last 12 months on a not seasonally adjusted basis.
The seasonally adjusted all items increase largely reflected advances
in the indexes for energy and for new and used motor vehicles. The
energy index rose for the fifth time in the last six months,
advancing 1.5 percent as the indexes for gasoline, fuel oil, natural
gas, and electricity all increased. The index for all items less food
and energy rose 0.2 percent in October, the same increase as in
September. The indexes for used cars and trucks and for new vehicles
both rose sharply and together they accounted for over 90 percent of
the increase in the index for all items less food and energy. The
indexes for airline fares and medical care also increased, while the
shelter index was unchanged and the indexes for apparel and
recreation declined.
The food index also increased in October, rising 0.1 percent after
declining in two of the previous three months. The index for food
away from home increased slightly, while the food at home index was
unchanged. Within the food at home group, the index for dairy and
related products rose significantly, while the fruits and vegetables
index declined for the fourth straight month.
Consumer Price Index Data for October 2009
Food
The food index rose 0.1 percent in October after declining 0.1
percent in September. The index for food away from home increased 0.1
percent while the food at home index was unchanged. Within the food
at home group, the index for dairy and related products rose 1.0
percent in October after a 0.5 percent increase in September, and the
index for other food at home advanced 0.3 percent. These increases
were offset by a 0.7 percent decline in the fruits and vegetables
index and 0.2 percent decreases in the indexes for meats, poultry,
fish, and eggs and for nonalcoholic beverages. The index for cereals
and bakery products was unchanged in October. Over the past 12
months, the food index has declined 0.6 percent with the food at home
index down 2.8 percent.
Energy
The energy index rose 1.5 percent in October after increasing 0.6
percent in September. The index for energy commodities rose 1.9
percent, with the gasoline index increasing 1.6 percent. (Before
seasonal adjustment, gasoline prices fell 0.8 percent in October.)
The index for fuel oil rose 6.3 percent. The index for energy
services, which increased 0.1 percent in September, rose 0.9 percent
in October. The electricity index increased 0.6 percent while the
index for natural gas rose 1.9 percent in October after declining 1.7
percent in September. Over the past 12 months, the energy index has
fallen 14.0 percent with the gasoline index declining 17.9 percent.
All items less food and energy
The index for all items less food and energy rose 0.2 percent in
October, the same increase as in September. Most of the advance was
due to increases in transportation indexes. The new vehicles index
rose 1.6 percent and the index for used cars and trucks rose 3.4
percent, its third consecutive substantial increase. The index for
airline fares rose for the fourth straight month, increasing 1.7
percent in October. Outside of the transportation group, the changes
within all items less food and energy were largely modest. The
medical care index rose 0.2 percent in October after increasing 0.4
percent in September. The shelter index was unchanged in October, as
it was in September. The rent index decreased 0.1 percent, the index
for owners' equivalent rent was unchanged, and the index for lodging
away from home rose 0.4 percent. Posting declines in October were the
indexes for recreation and apparel, which both fell 0.4 percent. For
the past 12 months, the index for all items less food and energy has
risen 1.7 percent.
Not seasonally adjusted CPI measures
The Consumer Price Index for All Urban Consumers (CPI-U) decreased
0.2 percent over the last 12 months to an index level of 216.177
(1982-84=100). For the month, the index increased 0.1 percent prior
to seasonal adjustment.
The Consumer Price Index for Urban Wage Earners and Clerical Workers
(CPI-W) decreased 0.3 percent over the last 12 months to an index
level of 211.549 (1982-84=100). For the month, the index increased
0.1 percent prior to seasonal adjustment.
The Chained Consumer Price Index for All Urban Consumers (C-CPI-U)
decreased 0.5 percent over the last 12 months. For the month, the
index increased 0.1 percent on a not seasonally adjusted basis.
Please note that the indexes for the post-2007 period are subject to
revision.
More at link with formatted tables
Pre-market - 8:15
Futures up slightly this morning.
DJIA INDEX 10,409.00 11.00
S&P 500 1,108.80 1.40
NASDAQ 100 1,808.75 0.00
Today's economic reports:
MBA Purchase Applications 7:00 AM ET
Consumer Price Index 8:30 AM ET
Housing Starts 8:30 AM ET
EIA Petroleum Status Report 10:30 AM ET
Today's earnings reports:
Before open:
BJ BJ's Wholesale Club Inc. Services Discount, Variety Stores
CHS Chico's FAS Inc. Services Apparel Stores
CSUN China Sunergy Co. Ltd. Technology Semiconductor - Integrated Circuits
DHT DHT Maritime, Inc. Services Shipping
ESLT Elbit Systems Ltd. Industrial Goods Aerospace/Defense Products & Services
GU Gushan Environmental Energy Limited Basic Materials Specialty Chemicals
NM Navios Maritime Holdings Inc. Services Shipping
PERY Perry Ellis International Inc. Consumer Goods Textile - Apparel Clothing
SMLC 012 Smile.Communications Ltd. Technology Diversified Communication Services
SOLF Solarfun Power Holdings Co. Ltd. Technology Semiconductor - Specialized
VVTV ValueVision Media Inc. Services Catalog & Mail Order Houses
After close:
CYBX Cyberonics Inc. Healthcare Medical Appliances & Equipment
DCI Donaldson Company Inc. Industrial Goods Pollution & Treatment Controls
GYMB Gymboree Corp. Services Apparel Stores
HOTT Hot Topic Inc. Services Apparel Stores
JACK Jack in the Box Inc. Services Restaurants
LTD Limited Brands Inc. Services Apparel Stores
NTAP NetApp, Inc. Technology Data Storage Devices
NTES Netease.com Inc. Technology Internet Information Providers
PETM Petsmart Inc. Services Specialty Retail, Other
PNNT Pennantpark Investment Corp. Financial Diversified Investments
PVH Phillips-Van Heusen Corp. Consumer Goods Textile - Apparel Clothing
SMTC Semtech Corp. Technology Semiconductor - Integrated Circuits
WGOV Woodward Governor Co. Industrial Goods Industrial Electrical Equipment
Tuesday, November 17, 2009
Market wrap - late - 6:40
Pretty much a draw today between the Bears and the Bulls. Volume very low.
Dow 10,437 30 0.29%
Nasdaq 2,204 6 0.27%
S&P 500 1,110 1 0.09%
Gold 1,139 0 0.00%
Oil 79.40 +0.23 +0.29%


Producer price index - 8:30
Full report here
The Producer Price Index for Finished Goods advanced 0.3 percent in October, easonally adjusted, the U.S. Bureau of Labor Statistics reported today. This increase followed a 0.6-percent decline in September and a 1.7-percent rise in August. In October, at the earlier stages of processing, prices received by manufacturers of intermediate goods moved up 0.3 percent and the crude goods index increased 5.4 percent. On an unadjusted basis, from October 2008 to October 2009, prices for finished goods fell 1.9 percent, the eleventh consecutive month of year-over-year declines. (See table A.)
See link for table A
Finished goods
The October increase in the index for finished goods can be attributed to higher prices for energy and food, both of which moved up 1.6 percent. By contrast, prices for finished goods other than foods and energy declined 0.6 percent.
Finished energy: The index for finished energy goods advanced 1.6 percent in October compared with a 2.4-percent drop in the previous month. Almost half of the increase can be traced to the gasoline index, which climbed 1.9 percent. Rising prices for residential electric power and liquefied petroleum gas also contributed to the advance in the finished energy goods index. (See table 2.)
Finished foods: Finished consumer food prices rose 1.6 percent in October after edging down 0.1 percent a month earlier. Accounting for about half of the increase, the index for fresh and dry vegetables jumped 24.2 percent. Higher prices for fresh fruits and melons also contributed to the advance in the finished consumer foods index.
Finished core: In October, the index for finished goods less foods and energy moved down 0.6 percent, its second consecutive decrease. Lower prices for light motor trucks and passenger cars led the October decline, falling 5.2 percent and 0.5 percent, respectively. In accordance with usual practice, most new-model-year passenger cars and light motor trucks were introduced into the PPI in October. (See Report on Quality Changes for 2010 Model Vehicles, USDL 09-1400.)
Intermediate goods
The Producer Price Index for Intermediate Materials, Supplies, and Components moved up 0.3 percent in October, its third straight monthly advance. The October rise can be traced to higher prices for intermediate energy goods, which climbed 2.3 percent. By contrast, the indexes for both intermediate goods less foods and energy and for intermediate foods and feeds decreased 0.2 percent. On a 12-month basis, prices for intermediate goods fell 7.5 percent in October. This is the third consecutive month of slowing year-over-year declines following a record 15.1-percent drop for the 12 months ended July 2009. (See table B.)
Intermediate energy: The index for intermediate energy goods advanced 2.3 percent in October after falling 2.1 percent in September. About one-fifth of this increase can be traced to a 5.5-percent rise in diesel fuel prices. Higher prices for natural gas to electric utilities and commercial electric power also contributed to the advance in the intermediate energy goods index. (See table 2.)
Crude goods
The Producer Price Index for Crude Materials for Further Processing increased 5.4 percent in October after falling 2.1 percent in September. For the 3-month period ending in October, crude material prices rose 7.1 percent after advancing 4.1 percent in the 3 months ending in July. The monthly October rise was broad based, with prices for crude energy materials jumping 8.3 percent, the index for crude foodstuffs and feedstuffs moving up 5.2 percent, and prices for crude nonfood materials less energy increasing 0.5 percent. (See table B.)
Crude energy: The index for crude energy materials increased 8.3 percent in October. From July to October, this index rose 9.5 percent, compared with an 11.8-percent rise in the 3 months ending in July. Accounting for about sixty percent of the monthly October increase, the natural gas index moved up 16.3 percent. Higher prices for both crude petroleum and coal also contributed to the advance in the crude energy materials index. (See table 2.)
Crude foods: The index for crude foodstuffs and feedstuffs increased 5.2 percent in October. This index moved up 2.4 percent in the most recent 3-month period compared with a 6.0-percent decline in the previous 3-month period. In October, a 9.0-percent rise in the grains index led the advance in the crude foodstuffs and feedstuffs index. Higher prices for slaughter poultry were also a factor in this increase.
Crude core: The index for crude nonfood materials less energy rose 0.5 percent in October, and 10.4 percent for the 3 months ending in October. Similarly, for the 3 months ending in July, prices climbed 10.8 percent. A major contributor to the monthly October increase was the gold ores index, which rose 5.4 percent.
See link for table B
Services Analysis
Trade industries: The Producer Price Index for the Net Output of Total Trade Industries was unchanged in October after falling in each of the previous three months. (Trade indexes measure changes in margins received by wholesalers and retailers.) In October, higher margins received by merchant wholesalers of nondurable goods and new car dealers were offset by lower margins received by merchant wholesalers of durable goods and gasoline stations with convenience
stores.
Transportation and warehousing industries: The Producer Price Index for the Net Output of Total Transportation and Warehousing Industries moved up 0.6 percent in October following a 0.7-percent decline in September. About two-thirds of this advance can be attributed to a 2.8-percent increase in prices received by the industry for scheduled passenger air transportation. The industry indexes for couriers and line-haul railroads also rose in October.
Traditional service industries: The Producer Price Index for the Net Output of Total
Traditional Service Industries advanced 0.5 percent in October after declining 0.2 percent in September. Leading this upturn, prices received by the commercial banking industry moved up 2.0 percent. The industry indexes for general medical and surgical hospitals and for investment banking and securities dealing also advanced in October.
Pre-market - Tuesday, November 17, 2009
Futures flat this morning on a rise in the dollar.
DJIA INDEX 10,363.00 -5.00
S&P 500 1,105.60 -0.70
NASDAQ 100 1,802.50 -1.00
ICSC-Goldman Store Sales 7:45 AM ET
Producer Price Index 8:30 AM ET
Redbook 8:55 AM ET
Treasury International Capital 9:00 AM ET
Industrial Production 9:15 AM ET
Jeffrey Lacker Speaks 10:00 AM ET
4-Week Bill Auction 11:30 AM ET
52-Week Bill Auction 11:30 AM ET
Housing Market Index 1:00 PM ET
Today's earnings reports:
ATV Acorn International, Inc. Services Catalog & Mail Order Houses
COV Covidien plc Healthcare Medical Instruments & Supplies
CPSL China Precision Steel, Inc. Basic Materials Steel & Iron
CSIQ Canadian Solar Inc. Technology Semiconductor - Specialized
DDS Dillard's Inc. Services Department Stores
EDAP EDAP TMS SA Healthcare Medical Appliances & Equipment
GASS StealthGas, Inc. Services Shipping
HD The Home Depot, Inc. Services Home Improvement Stores
ITRN Ituran Location & Control Ltd. Services Electronics Wholesale
JEC Jacobs Engineering Group Inc. Services Technical Services
JST Jinpan International Ltd. Technology Diversified Electronics
KEI Keithley Instruments Inc. Technology Scientific & Technical Instruments
MPEL Melco Crown Entertainment Ltd. Services Resorts & Casinos
SKS Saks Incorporated Services Department Stores
TGT Target Corp. Services Discount, Variety Stores
TJX The TJX Companies, Inc. Services Department Stores
WX WuXi PharmaTech (Cayman) Inc. Healthcare Drug Manufacturers - Major
After close:
ADSK Autodesk, Inc. Technology Technical & System Software
ALOT Astro-Med Inc. Technology Computer Peripherals
CNQR Concur Technologies, Inc. Technology Technical & System Software
CRM Salesforce.com Technology Application Software
DL China Distance Education Holdings Limited Services Education & Training Services
EJ E-House (China) Holdings Limited Financial Property Management
HNSN Hansen Medical, Inc. Healthcare Medical Appliances & Equipment
LZB La-Z-Boy Inc. Consumer Goods Home Furnishings & Fixtures
PCYO Pure Cycle Corp. Industrial Goods Heavy Construction
PLNR Planar Systems Inc. Technology Computer Peripherals
SNS Steak n Shake Co. Services Restaurants
VIT VanceInfo Technologies Inc. Technology Business Software & Services
Monday, November 16, 2009
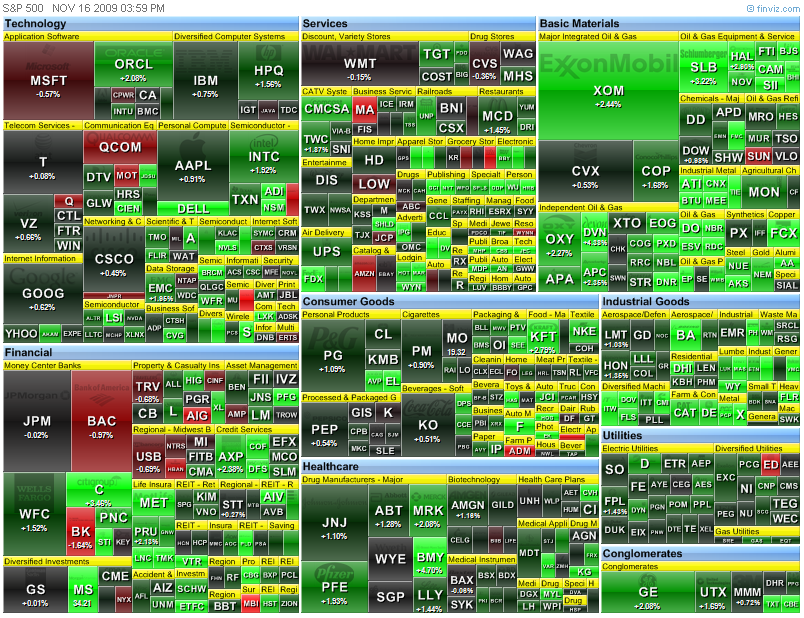
Market wrap - 4:10
The rally today started at the open and ran up all day. At the same time, the dollar was falling. Until late in the day, the dollar turned around a bit, but it finding the 75 level as resistance now, and not support. As the dollar goes, so goes the market. Trade accordingly.
Dow 10,406 +136 +1.32%
Nasdaq 2,198 30 1.38%
S&P 500 1,109 16 1.45%
Gold 1,139 +23 +2.03%
Oil 78.81 2.55 3.34%


I hope to have a Meredith Whitney and a Peter Shiff interview once they get posted on CNBC. The Whitney interview is a must see, but Shiff is on Fast Money so I'm confident they will screw it up. They are perma bull pump monkey's and Shiff is a perma bear. Fast Money does have the ability to shut you off, and they most certainly will on Shiff.
I hope to have a Meredith Whitney and a Peter Shiff interview once they get posted on CNBC. The Whitney interview is a must see, but Shiff is on Fast Money so I'm confident they will screw it up. They are perma bull pump monkey's and Shiff is a perma bear. Fast Money does have the ability to shut you off, and they most certainly will on Shiff.
Business inventories - 10:00
Full report here
 MANUFACTURING AND TRADE INVENTORIES AND SALES
September 2009
Sales. The U.S. Census Bureau announced today that the combined value of distributive trade sales and manufacturers’ shipments for September, adjusted for seasonal and trading-day differences but not for price changes, was estimated at $988.0 billion, down 0.3 percent (±0.3%)* from August 2009 and down 13.1 percent (±0.6%) from September 2008.
Inventories. Manufacturers’ and trade inventories, adjusted for seasonal variations but not for price changes, were estimated at an end-of-month level of $1,303.4 billion, down 0.4 percent (±0.1%) from August 2009 and down 13.4 percent (±0.3%) from September 2008.
Inventories/Sales Ratio. The total business inventories/sales ratio based on seasonally adjusted data at the end of September was 1.32. The September 2008 ratio was 1.32.
MANUFACTURING AND TRADE INVENTORIES AND SALES
September 2009
Sales. The U.S. Census Bureau announced today that the combined value of distributive trade sales and manufacturers’ shipments for September, adjusted for seasonal and trading-day differences but not for price changes, was estimated at $988.0 billion, down 0.3 percent (±0.3%)* from August 2009 and down 13.1 percent (±0.6%) from September 2008.
Inventories. Manufacturers’ and trade inventories, adjusted for seasonal variations but not for price changes, were estimated at an end-of-month level of $1,303.4 billion, down 0.4 percent (±0.1%) from August 2009 and down 13.4 percent (±0.3%) from September 2008.
Inventories/Sales Ratio. The total business inventories/sales ratio based on seasonally adjusted data at the end of September was 1.32. The September 2008 ratio was 1.32.
 MANUFACTURING AND TRADE INVENTORIES AND SALES
September 2009
Sales. The U.S. Census Bureau announced today that the combined value of distributive trade sales and manufacturers’ shipments for September, adjusted for seasonal and trading-day differences but not for price changes, was estimated at $988.0 billion, down 0.3 percent (±0.3%)* from August 2009 and down 13.1 percent (±0.6%) from September 2008.
Inventories. Manufacturers’ and trade inventories, adjusted for seasonal variations but not for price changes, were estimated at an end-of-month level of $1,303.4 billion, down 0.4 percent (±0.1%) from August 2009 and down 13.4 percent (±0.3%) from September 2008.
Inventories/Sales Ratio. The total business inventories/sales ratio based on seasonally adjusted data at the end of September was 1.32. The September 2008 ratio was 1.32.
MANUFACTURING AND TRADE INVENTORIES AND SALES
September 2009
Sales. The U.S. Census Bureau announced today that the combined value of distributive trade sales and manufacturers’ shipments for September, adjusted for seasonal and trading-day differences but not for price changes, was estimated at $988.0 billion, down 0.3 percent (±0.3%)* from August 2009 and down 13.1 percent (±0.6%) from September 2008.
Inventories. Manufacturers’ and trade inventories, adjusted for seasonal variations but not for price changes, were estimated at an end-of-month level of $1,303.4 billion, down 0.4 percent (±0.1%) from August 2009 and down 13.4 percent (±0.3%) from September 2008.
Inventories/Sales Ratio. The total business inventories/sales ratio based on seasonally adjusted data at the end of September was 1.32. The September 2008 ratio was 1.32.
Retail Sales - 8:30
Full report here
The U.S. Census Bureau announced today that advance estimates of U.S. retail and food services sales for October, adjusted for seasonal variation and holiday and trading-day differences, but not for price changes, were $347.5 billion, an increase of 1.4 percent (±0.5%) from the previous month, but 1.7 percent (±0.5%) below October 2008. Total sales for the August through October 2009 period were up 1.5 percent (±0.3%) from the same period a year ago. The August to September 2009 percent change was revised from -1.5 percent (±0.5%) to -2.3 percent (±0.3%).
Retail trade sales were up 1.4 percent (±0.7%) from September 2009, but 2.1 percent (±0.5%) below last year. Gasoline stations sales were down 15.0 percent (±1.3%) from October 2008 and building material and garden equipment and supplies dealers were down 15.0 percent (±1.8%) from last year.
More info at link with formatted tables
Pre-market - Monday, November 16,2009
Futures up on good news out of Japan.
DJIA INDEX 10,310.00 68.00
S&P 500 1,100.60 9.20
NASDAQ 100 1,798.25 10.00
Today's economic calendar:
Retail Sales 8:30 AM ET
Empire State Mfg Survey 8:30 AM ET
Business Inventories 10:00 AM ET
4-Week Bill Announcement 11:00 AM ET
3-Month Bill Auction 11:30 AM ET
6-Month Bill Auction 11:30 AM ET
Ben Bernanke Speaks 12:00 PM ET
Today's earnings reports:
Before market opens:
ADES ADA-ES, Inc. Industrial Goods Pollution & Treatment Controls
ADY American Dairy Inc. Consumer Goods Dairy Products
CAEI China Architectural Engineering, Inc. Industrial Goods General Contractors
COWN Cowen Group Inc. Financial Investment Brokerage - National
CYPB Cypress Bioscience, Inc. Healthcare Biotechnology
ESEA Euroseas, Ltd. Services Shipping
FLML Flamel Technologies SA Healthcare Drug Delivery
FREE FreeSeas Inc. Services Shipping
FTK Flotek Industries Inc. Basic Materials Specialty Chemicals
HAST Hastings Entertainment Inc. Services Music & Video Stores
KHD KHD Humboldt Wedag International Ltd. Services Industrial Equipment Wholesale
LOW Lowe's Companies Inc. Services Home Improvement Stores
NSSC Napco Security Technologies, Inc. Services Security & Protection Services
ORBK Orbotech Ltd. Technology Scientific & Technical Instruments
PWRD Perfect World Co., Ltd. Technology Application Software
SCR Simcere Pharmaceutical Group. Healthcare Drug Manufacturers - Other
SIHI SinoHub, Inc. Services Electronics Wholesale
SOL ReneSola Ltd. Technology Semiconductor - Integrated Circuits
WX WuXi PharmaTech (Cayman) Inc. Healthcare Drug Manufacturers - Major
ZSTN ZST Digital Networks, Inc. Technology Communication Equipment
After market closes:
ADAT Authentidate Holding Corp. Technology Internet Software & Services
ADG Allied Defense Group Inc. Industrial Goods Aerospace/Defense Products & Services
AGO Assured Guaranty Ltd. Financial Life Insurance
AOB American Oriental Bioengineering Inc. Healthcare Biotechnology
CDCS CDC Software Corporation Technology Application Software
CHINA CDC Corp. Technology Internet Software & Services
DMC Document Security Systems Inc. Services Security & Protection Services
ERI Emrise Corp. Industrial Goods Aerospace/Defense Products & Services
FC Franklin Covey Co. Consumer Goods Office Supplies
FMCN Focus Media Holding Ltd. Services Advertising Agencies
LFT Longtop Financial Technologies Limited Technology Business Software & Services
NAK Northern Dynasty Minerals Ltd. Basic Materials Gold
PSUN Pacific Sunwear of California Inc. Services Apparel Stores
RGDX Response Genetics, Inc Healthcare Diagnostic Substances
SINA Sina Corp. Technology Internet Software & Services
SPRD Spreadtrum Communications Inc. Technology Semiconductor - Broad Line
ZOOM ZOOM Technologies Inc. Technology Communication Equipment
Friday, November 13, 2009
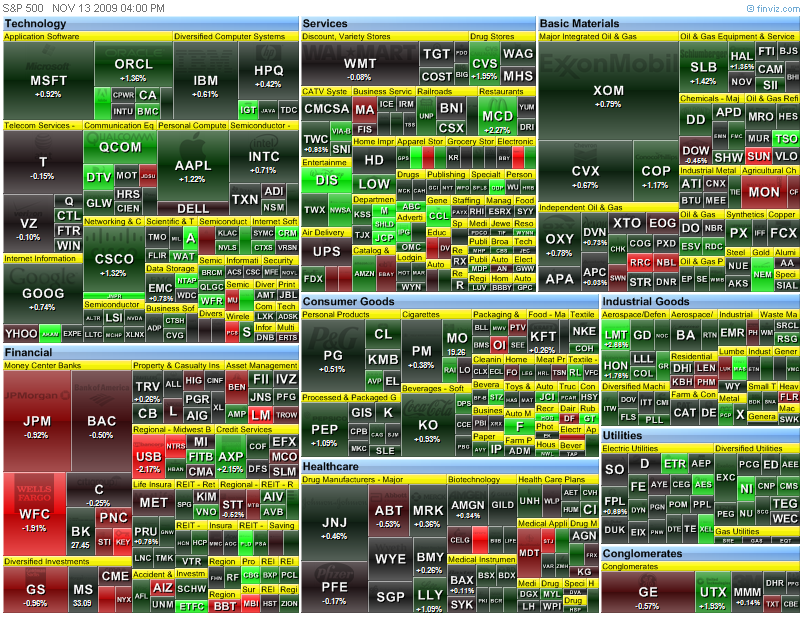
Market wrap - 4:50
Ho humm...another up day in the casino.
Dow 10,270 73 0.72%
Nasdaq 2,168 19 0.88%
S&P 500 1,093 6 0.57%
Gold 1,117 +10 +0.92%
Oil 76.32 -0.59 -0.77%


Consumer Sentiment - 10:00
From MarketWatch
WASHINGTON (MarketWatch) -- Consumer sentiment pulled back in early November, according to media reports on Friday of the Reuters/University of Michigan index. The consumer sentiment index fell to 66.0 from 70.6 in October. The decrease was unexpected. The consensus forecast of Wall Street economists was for sentiment to rise to 71.8. After hitting 73.5 in September, the index has now fallen in two straight months.
Import Export prices - 8:30
Full report here
U.S. IMPORT AND EXPORT PRICE INDEXES - OCTOBER 2009
The U.S. Import Price Index rose 0.7 percent in October, the U.S. Bureau of Labor Statistics reported today, led by a 1.8 percent increase in fuel prices. The rise followed a 0.2 percent increase in September. U.S. export prices advanced 0.3 percent in October after decreasing 0.2 percent the previous month.
Imports
All Imports: The increase in U.S. imports in October continued the recent upward trend for the index. Import prices have risen in seven of the past eight months and were up 8.1 percent over that period. Despite the recent increases, import prices declined 5.7 percent for the year ended in October driven by a 12.8 percent drop in prices between October 2008 and January 2009.
Fuel Imports: Prices for import fuel advanced 1.8 percent in October after a 1.5 percent decline the previous month. A 24.1 percent increase in natural gas prices led the overall advance in October, while petroleum prices were also a contributing factor, advancing 0.9 percent. However, the price indexes for natural gas and petroleum both declined over the past year, falling 46.4 percent and 12.2 percent,
respectively.
All Imports Excluding Fuel: Nonfuel import prices rose 0.4 percent in October as higher prices for industrial supplies and materials, finished goods, and foods, feeds, and beverages all contributed to the advance. Prices for nonfuel imports rose between 0.4 percent and 0.5 percent in each of the past three months, the largest monthly advances since a 0.6 percent increase in July 2008. The index declined 2.9
percent over the past 12 months as sharp decreases at the end of 2008 more than offset the recent rises.
Exports
All Exports: Export prices rose 0.3 percent after falling 0.2 percent in September. Rising nonagricultural prices more than offset a drop in the price index for agricultural exports. Prices of overall exports decreased 3.4 percent for the October 2008-2009 period.
Agricultural Exports: Agricultural prices fell for the third time in the past four months in October, declining 1.0 percent after recording a 3.0 percent decrease in September. Falling prices for soybeans and wheat, down 7.5 percent and 6.1 percent, respectively, continued to drive agricultural prices lower. In contrast, a 9.2 percent rise in corn prices partially offset those declines. The price index for overall agricultural prices decreased 10.0 percent for the year ended in October.
All Exports Excluding Agriculture: Prices for nonagricultural exports increased 0.3 percent in October and have risen 2.3 percent since March. Higher prices for nonagricultural industrial supplies and materials and most of the major finished goods areas contributed to the advance. Despite the recent increases, a 4.6
percent drop in prices for the final two months of 2008 drove the index down 2.7 percent over the past year.
SELECTED OCTOBER HIGHLIGHTS
Import Prices
Nonfuel Industrial Supplies and Materials: The price index for nonfuel industrial supplies and materials increased 1.6 percent in October after rising 2.8 percent the previous month. Rising prices for metals and chemicals were a major factor for the increases in both October and September.
Finished Goods: Prices for each of the major finished goods areas rose in October. Prices for automotive vehicles advanced 0.6 percent, the largest increase since a 0.6 percent rise in December 2007. The October increase was partially attributable to year-end model changeovers. The price index for consumer goods advanced 0.3 percent, the largest gain for the index since a 0.6 percent increase in April 2008. Capital goods prices advanced 0.2 percent, the largest increase since a similar 0.2 percent rise in July 2008. The increase was led by higher prices for electrical generating equipment.
Foods, Feeds, and Beverages: Prices for foods, feeds, and beverages ticked up 0.1 percent in October. The modest advance followed increases of 0.5 percent and 1.3 percent, respectively, in September and August. For October, higher prices for fruit and coffee more than offset falling meat and fish prices.
Imports by Locality of Origin: Higher fuel prices drove import prices from Canada in October, up 1.2 percent. The October increase followed advances of 0.9 percent and 1.2 percent, respectively, in the previous two months. The price indexes of imports from the European Union, Mexico, China, and Japan also rose in October - up 0.6 percent, 0.7 percent, 0.1 percent, and 0.2 percent, respectively.
Transportation Services: Import air passenger fares advanced 6.4 percent in October, the first increase since a 13.0 percent jump in June. The October advance was led by an 8.6 percent rise in European fares. Import air freight prices also increased in October, rising 1.5 percent after advancing 0.7 percent the previous month.
Export Prices
Nonagricultural Industrial Supplies and Materials: The price index for nonagricultural industrial supplies and materials increased 1.0 percent in October after ticking up a modest 0.1 percent in September. The October advance was driven by higher prices for metals, chemicals, iron and steel mill products, and
fuel.
Finished Goods: Finished goods prices were mixed in October. Prices for capital goods and for automotive vehicles rose 0.2 percent and 0.1 percent, respectively. In contrast, consumer goods prices edged down 0.1
percent.
Transportation Services: Export air passenger fares rose 4.9 percent in October following a decline of 9.1 percent in September and an increase of 9.1 percent in August. Rising prices for European fares and Latin American/Caribbean fares contributed to the October advance. In contrast, export air freight prices fell 0.2
percent in October, the first monthly decline for the index since a 1.2 percent drop in June.
Import and Export Price Index data for November 2009 are scheduled for release on Friday, December 11, 2009 at 8:30 a.m. (EST).
International Trade - 8:30
Full report
Goods and Services
The U.S. Census Bureau and the U.S. Bureau of Economic Analysis, through the department of Commerce, announced today that total September exports of $132.0 billion and imports of $168.4 billion resulted in a goods and services deficit of $36.5 billion, up from $30.8 billion in August, revised. September exports were $3.7 billion more than August exports of $128.3 billion. September imports were $9.3 billion more than August imports of $159.1 billion.
In September, the goods deficit increased $5.6 billion from August to $47.6 billion, and the services surplus was virtually unchanged at $11.1 billion. Exports of goods increased $3.5 billion to $90.3 billion, and imports of goods increased $9.1 billion to $138.0 billion. Exports of services increased $0.2 billion to $41.6 billion, and imports of services increased $0.2 billion to $30.5 billion.
In September, the goods and services deficit decreased $23.7 billion from September 2008. Exports were down $20.0 billion, or 13.2 percent, and imports were down $43.7 billion, or 20.6 percent.
Goods (Census basis)
The August to September increase in exports of goods reflected increases in capital goods ($1.7 billion); industrial supplies and materials ($1.4 billion); consumer goods ($0.5 billion); automotive vehicles, parts, and engines ($0.2 billion); and other goods ($0.2 billion). A decrease occurred in foods, feeds, and beverages ($0.4 billion).
The August to September increase in imports of goods reflected increases in industrial supplies and materials ($5.5 billion); automotive vehicles, parts, and engines ($1.7 billion); capital goods ($0.8 billion); consumer goods ($0.7 billion); and other goods ($0.5 billion). Foods, feeds, and beverages were virtually unchanged.
The September 2008 to September 2009 decrease in exports of goods reflected decreases in industrial supplies and materials ($5.2 billion); capital goods ($5.1 billion); automotive vehicles, parts, and engines ($2.6 billion); foods, feeds, and beverages ($1.5 billion); consumer goods ($0.7 billion); and other goods ($0.3 billion).
The September 2008 to September 2009 decrease in imports of goods reflected decreases in industrial supplies and materials ($22.9 billion); capital goods ($7.6 billion); consumer goods ($4.6 billion); automotive vehicles, parts, and engines ($2.2 billion); foods, feeds, and beverages ($0.8 billion); and other goods ($0.5 billion).
Services
Services exports increased $0.2 billion from August to September. The increase was mostly accounted for by increases in other private services (which includes items such as business, professional, and technical services, insurance services, and financial services) and other transportation (which includes freight and port services). Changes in the other categories of services exports were small.
Services imports increased $0.2 billion from August to September. The increase was more than accounted for by increases in other transportation and other private services. Changes in the other categories of services imports were small.
The September 2008 to September 2009 decrease in exports of services was $4.3 billion. The largest decreases were in travel ($1.4 billion), other transportation ($1.2 billion), and royalties and license fees ($0.9 billion).
The September 2008 to September 2009 decrease in imports of services was $4.0 billion. The largest decreases were in other transportation ($1.9 billion), passenger fares ($0.7 billion), and other private services ($0.5 billion). Within other private services, the largest decreases were in business, professional, and technical services and financial services.
Goods and Services Moving Average
For the three months ending in September, exports of goods and services averaged $129.4 billion, while imports of goods and services averaged $162.5 billion, resulting in an average trade deficit of $33.1 billion. For the three months ending in August, the average trade deficit was $30.1 billion, reflecting average exports of $127.1 billion and average imports of $157.1 billion.
Selected Not Seasonally Adjusted Goods Details
The September figures show surpluses, in billions of dollars, with Hong Kong $1.9 ($1.3 for August), Australia $0.9 ($1.2), Singapore $0.3 ($0.3), and Egypt $0.3 ($0.4). Deficits were recorded, in billions of dollars, with China $22.1 ($20.2), OPEC $7.9 ($6.4), European Union $5.5 ($5.4), Mexico $4.6 ($4.0), Japan $4.1 ($4.3), Venezuela $2.0 ($1.9), Nigeria $1.9 ($1.7), Canada $1.5 ($1.5), Korea $0.8 ($0.4), and Taiwan $0.7 ($0.5).
Advanced technology products exports were $20.5 billion in September and imports were $26.5 billion, resulting in a deficit of $6.0 billion. September exports were $2.0 billion more than the $18.5 billion in August, while September imports were $2.4 billion more than the $24.1 billion in August.
Revisions
Goods exports and imports for August were each revised up $0.1 billion. For August, revised export carry-over was virtually zero. For August, revised import carry-over was $0.1 billion (0.1 percent), revised down from $0.7 billion (0.5 percent). Goods carry-over in September was $0.1 billion (0.1 percent) for exports and $0.9 billion (0.7 percent) for imports.
Services exports for August were virtually unrevised at $41.5 billion. An upward revision in travel was mostly offset by a downward revision in other transportation. Services imports for August were revised up $0.1 billion to $30.3 billion. The revision was mostly accounted for by an upward revision in travel.
Pre-market - Friday, November 13, 2009
Futures up a little waiting on data at 8:30.
DJIA INDEX 10,219.00 30.00
S&P 500 1,091.50 4.20
NASDAQ 100 1,780.00 6.25
Today's earnings calendar:
International Trade 8:30 AM ET
Import and Export Prices 8:30 AM ET
Consumer Sentiment 9:55 AM ET
EIA Natural Gas Report 10:30 AM ET
Today's earnings calendar:
Before open:
A Agilent Technologies Inc. Technology Scientific & Technical Instruments
ANF Abercrombie & Fitch Co. Services Apparel Stores
ART Artio Global Investors Inc. Financial Asset Management
CRYP Cryptologic Inc. Technology Business Software & Services
ENT Enterra Energy Trust Basic Materials Oil & Gas Drilling & Exploration
ERF Enerplus Resources Fund Basic Materials Oil & Gas Drilling & Exploration
FFHL Fuwei Films (Holdings) Co., Ltd. Consumer Goods Rubber & Plastics
JCP J. C. Penney Company, Inc. Services Department Stores
MBT Mobile Telesystems OJSC Technology Wireless Communications
RMX Ready Mix, Inc. Industrial Goods Cement
SUTR Sutor Technology Group, Ltd. Basic Materials Steel & Iron
TK Teekay Corporation Services Shipping
YGE Yingli Green Energy Holding Co. Ltd. Technology Semiconductor - Integrated Circuits
After close:
CIG Companhia Energetica de Minas Gerais Utilities Electric Utilities
HTE Harvest Energy Trust Basic Materials Independent Oil & Gas
ORCD The Orchard Enterprises Inc. Services General Entertainment
PBR Petroleo Brasileiro Basic Materials Oil & Gas Drilling & Exploration
SINA Sina Corp. Technology Internet Software & Services
Thursday, November 12, 2009
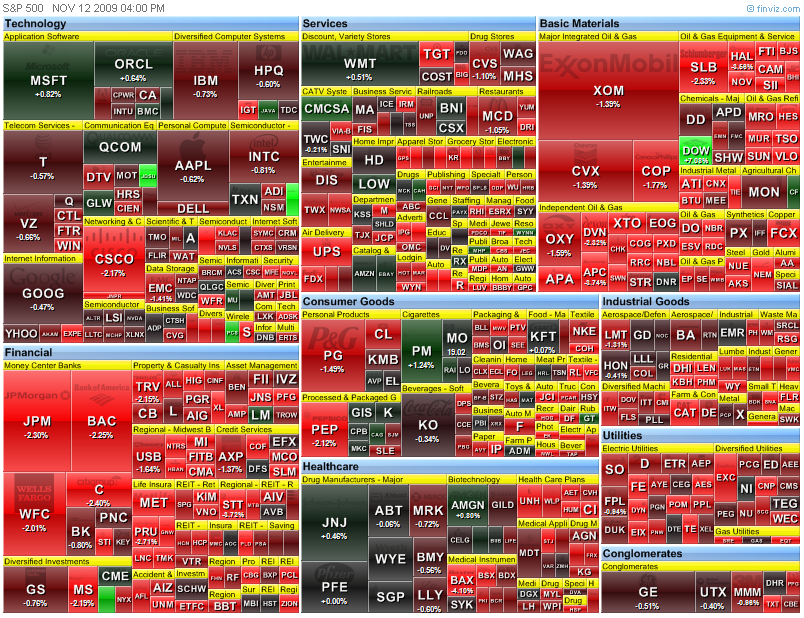
Market wrap - 4:50
Opps, no rally today. 30 year bond auction not so good, and a strong dollar wouldn't allow this to move to the upside. Also, crude and distillate inventories were not so bullish. And let's not forget that pesky 1100 (1098 by my calcs)resistance on the S&P.
Dow 10,197 -94 -0.92%
Nasdaq 2,149 -18 -0.83%
S&P 500 1,087 -11 -1.03%
Gold 1,107 -8 -0.72%
Oil 76.68 -2.34 -2.96%


Jobless claims - 8:30 am
Full report here
UNEMPLOYMENT INSURANCE WEEKLY CLAIMS REPORT
SEASONALLY ADJUSTED DATA
In the week ending Nov. 7, the advance figure for seasonally adjusted initial claims was 502,000, a decrease of 12,000 from the previous week's revised figure of 514,000. The 4-week moving average was 519,750, a decrease of 4,500 from the previous week's revised average of 524,250.
The advance seasonally adjusted insured unemployment rate was 4.3 percent for the week ending Oct. 31, unchanged from the prior week's unrevised rate of 4.4 percent.
The advance number for seasonally adjusted insured unemployment during the week ending Oct. 31 was 5,631,000, a decrease of 139,000 from the preceding week's revised level of 5,770,000. The 4-week moving average was 5,790,750, a decrease of 100,750 from the preceding week's revised average of 5,891,500.
UNADJUSTED DATA
The advance number of actual initial claims under state programs, unadjusted, totaled 529,446 in the week ending Nov. 7, an increase of 46,904 from the previous week. There were 539,787 initial claims in the comparable week in 2008.
The advance unadjusted insured unemployment rate was 3.8 percent during the week ending Oct. 31, an increase of 0.1 percentage point from the prior week. The advance unadjusted number for persons claiming UI benefits in state programs totaled 4,944,307, an increase of 10,863 from the preceding week. A year earlier, the rate was 2.6 percent and the volume was 3,460,633.
Extended benefits were available in Alabama, Alaska, Arizona, California, Colorado, Connecticut, Delaware, the District of Columbia, Florida, Georgia, Idaho, Illinois, Indiana, Kansas, Kentucky, Maine, Massachusetts, Michigan, Minnesota, Missouri, Nevada, New Hampshire, New Jersey, New Mexico, New York, North Carolina, Ohio, Oregon, Pennsylvania, Puerto Rico, Rhode Island, South Carolina, Tennessee, Texas, Vermont, Virginia, Washington, West Virginia, and Wisconsin during the week ending Oct. 24.
Initial claims for UI benefits by former Federal civilian employees totaled 2,378 in the week ending Oct. 31, an increase of 309 from the prior week. There were 2,255 initial claims by newly discharged veterans, a decrease of 252 from the preceding week.
There were 22,478 former Federal civilian employees claiming UI benefits for the week ending Oct. 24, an increase of 818 from the previous week. Newly discharged veterans claiming benefits totaled 34,254, an increase of 354 from the prior week.
States reported 3,520,151 persons claiming EUC (Emergency Unemployment Compensation) benefits for the week ending Oct. 24, an increase of 22,390 from the prior week. There were 820,503 claimants in the comparable week in 2008. EUC weekly claims include both first and second tier activity.
The highest insured unemployment rates in the week ending Oct. 24 were in Puerto Rico (6.4 percent), Oregon (5.4), Nevada (5.2), Pennsylvania (4.9), Alaska (4.8), Arkansas (4.8), California (4.8), Wisconsin (4.8), North Carolina (4.6), Michigan (4.5), and South Carolina (4.5).
The largest increases in initial claims for the week ending Oct. 31 were in Wisconsin (+1,501), Illinois (+1,390), Michigan (+1,135), Puerto Rico (+1,101), and Texas (+965), while the largest decreases were in California (-6,752), Florida (-3,409), Georgia (-2,686), New York (-2,067), and North Carolina
(-1,872).
More at link with formatted tables. (NOTE: I post these as soon as they are posted on the site. I can't help if they are a little late. Sorry.)
Pre-market - 8:00 am
Future down a bit, not sure why. This market only goes up doesn't it?
DJIA INDEX 10,211.00 -48.00 10,261.00
S&P 500 1,090.50 -5.80
NASDAQ 100 1,774.00 -9.75
Today's economic calender, and a busy one:
MBA Purchase Applicationst 7:00 AM ET
Jobless Claims 8:30 AM ET
RBC CASH Index 9:00 AM ET
EIA Petroleum Status Report 11:00 AM ET
3-Month Bill Announcement 11:00 AM ET
6-Month Bill Announcement 11:00 AM ET
52-Week Bill Announcemen t11:00 AM ET
30-Yr Bond Auction 1:00 PM ET
Today's earnings reports:
Before open:
ABV Companhia de Bebidas Das Americas (AMBEV) Consumer Goods Beverages - Brewers
ACM AECOM Technology Corporation Services Technical Services
ATK Alliant Techsystems Inc. Industrial Goods Aerospace/Defense Products & Services
BCE BCE, Inc. Technology Telecom Services - Domestic
BPHX BluePhoenix Solutions Ltd. Technology Business Software & Services
BRKS Brooks Automation Inc. Technology Semiconductor Equipment & Materials
CAAS China Automotive Systems Inc. Consumer Goods Auto Parts
CBD Companhia Brasileira de Distribuicao Services Grocery Stores
CIDM Cinedigm Digital Cinema Corp. Services Business Services
DOVR Dover Saddlery, Inc. Services Sporting Goods Stores
ECA EnCana Corp. Basic Materials Major Integrated Oil & Gas
EPM Evolution Petroleum Corp. Basic Materials Independent Oil & Gas
GASS StealthGas, Inc. Services Shipping
GBX Greenbrier Companies Services Railroads
GRS Gammon Gold, Inc. Basic Materials Gold
GSOL Global Sources Ltd. Technology Internet Information Providers
HAWK Seahawk Drilling, Inc. Basic Materials Oil & Gas Drilling & Exploration
HBE Henry Bros. Electronics, Inc. Services Security & Protection Services
HSNI HSN, Inc. Services Catalog & Mail Order Houses
INS Intelligent Systems Technology Technical & System Software
JOBS 51job Inc. Services Staffing & Outsourcing Services
KONG Kongzhong Corp. Services Business Services
KSS Kohl's Corp. Services Department Stores
LEE Lee Enterprises Inc. Services Publishing - Newspapers
MAIL IncrediMail, Ltd. Technology Business Software & Services
MMS MAXIMUS, Inc. Services Education & Training Services
MPEL Melco Crown Entertainment Ltd. Services Resorts & Casinos
NAFC Nash Finch Co. Services Food Wholesale
PFIN P&F Industries Inc. Industrial Goods Small Tools & Accessories
PIP PharmAthene, Inc. Healthcare Biotechnology
QGLY The Quigley Corporation Healthcare Drug Delivery
RLOG Rand Logistics, Inc. Services Shipping
RRST RRSat Global Communications Network Ltd. Technology Diversified Communication Services
SI Siemens AG Technology Telecom Services - Foreign
SPH Suburban Propane Partners LP Services Specialty Retail, Other
TEF Telefonica SA Technology Telecom Services - Foreign
URBN Urban Outfitters Inc. Services Apparel Stores
VCGH VCG Holding Corp. Services General Entertainment
VIVO Meridian Bioscience Inc. Healthcare Diagnostic Substances
VSCP VirtualScopics Inc. Services Staffing & Outsourcing Services
WMT Wal-Mart Stores Inc. Services Discount, Variety Stores
After close:
AFCE AFC Enterprises Inc. Consumer Goods Food - Major Diversified
ALDA Aldila Inc. Consumer Goods Sporting Goods
BEAT CardioNet, Inc. Healthcare Medical Instruments & Supplies
BIOF BioFuel Energy Corp. Basic Materials Specialty Chemicals
CPA Copa Holdings SA Services Regional Airlines
CRI Carter's, Inc. Consumer Goods Textile - Apparel Clothing
DAR Darling International Inc. Consumer Goods Cleaning Products
DIET Ediets.com Inc. Technology Internet Information Providers
DIS Walt Disney Co. Services Entertainment - Diversified
ESE ESCO Technologies Inc. Technology Scientific & Technical Instruments
FREE FreeSeas Inc. Services Shipping
FSI Flexible Solutions International Inc. Basic Materials Specialty Chemicals
GA Giant Interactive Group, Inc. Services Business Services
ICXT ICx Technologies, Inc. Technology Scientific & Technical Instruments
IILG Interval Leisure Group, Inc. Services Business Services
IRIX IRIDEX Corp. Healthcare Medical Appliances & Equipment
JMBA Jamba, Inc. Consumer Goods Processed & Packaged Goods
JOBS 51job Inc. Services Staffing & Outsourcing Services
JWN Nordstrom Inc. Services Apparel Stores
KTEC Key Technology Inc. Consumer Goods Processed & Packaged Goods
LIME Lime Energy Co. Services Business Services
MATW Matthews International Corporation Industrial Goods Metal Fabrication
MDSO Medidata Solutions, Inc. Technology Healthcare Information Services
MSCC Microsemi Corp. Technology Semiconductor - Integrated Circuits
PAL North American Palladium Ltd. Basic Materials Industrial Metals & Minerals
PSDV pSivida Corp. Healthcare Drug Delivery
QBAK Qualstar Corp. Technology Diversified Electronics
SSRX 3SBio Inc. Healthcare Biotechnology
TEAR OccuLogix Inc. Healthcare Medical Instruments & Supplies
TGB Taseko Mines Ltd. Basic Materials Copper
TSTC Telestone Technologies Corp. Technology Diversified Communication Services
URS URS Corporation Services Technical Services
VSCI Vision-Sciences Inc. Healthcare Medical Appliances & Equipment
WGL WGL Holdings Inc. Utilities Gas Utilities
WLDN Willdan Group, Inc. Services Technical Services
WPRT Westport Innovations Inc. Industrial Goods Pollution & Treatment Controls
Treasury Budget
[Report][djStar]2:00 PM ET
Money Supply
[Bullet4:30 PM ET
Wednesday, November 11, 2009
Market wrap - 5:45
Up a little in a very slow day. HP buys 3Com (COMS)after hours.
Dow 10,291 44 0.43%
Nasdaq 2,167 16 0.74%
S&P 500 1,099 6 0.50%
Gold 1,115 12 1.09%
Oil 79.27 0.23 0.29%


Pre-market - Wednesday, November 11, 2009
Futures up this morning on who knows what news.
DJIA INDEX 10,284.00
S&P 500 1,099.80 7.90
NASDAQ 100 1,786.00 13.50
Today's economic calendar:
None - Bond markets closed as well for the holiday
Today's earnings reports:
Before open:
AEZS AEterna Zentaris Inc. Healthcare Biotechnology
ALLT Allot Communications Ltd. Technology Technical & System Software
APU AmeriGas Partners LP Utilities Gas Utilities
ARA Aracruz Celulose S.A. Consumer Goods Paper & Paper Products
ATRN Atrinsic, Inc. Technology Internet Information Providers
BLD Baldwin Technology Co. Inc. Industrial Goods Diversified Machinery
CAAS China Automotive Systems Inc. Consumer Goods Auto Parts
CAE CAE Inc. Industrial Goods Aerospace/Defense Products & Services
CHLN China Housing and Land Development, Inc. Financial Property Management
CRWS Crown Crafts Inc. Consumer Goods Textile - Apparel Clothing
FLO Flowers Foods, Inc. Consumer Goods Processed & Packaged Goods
GBE Grubb & Ellis Company Financial Property Management
GLOI GlobalOptions Group, Inc. Services Management Services
ING ING GROUP NV ADS Financial Life Insurance
JCDA Jacada Ltd. Technology Internet Software & Services
M Macy's, Inc. Services Department Stores
NXST Nexstar Broadcasting Group Inc. Services Broadcasting - TV
PHC PHC Inc. Healthcare Home Health Care
UGI UGI Corp. Utilities Diversified Utilities
XRIT X-Rite, Incorporated Consumer Goods Photographic Equipment & Supplies
ZOLL ZOLL Medical Corp. Healthcare Medical Appliances & Equipment
After close:
AAP Advance Auto Parts Inc. Services Auto Parts Stores
AMAT Applied Materials Inc. Technology Semiconductor Equipment & Materials
ANW Aegean Marine Petroleum Network Inc. Services Basic Materials Wholesale
BCA CorpBanca S.A. Financial Foreign Regional Banks
CBMX CombiMatrix Corporation Healthcare Biotechnology
CGA China Green Agriculture, Inc. Basic Materials Agricultural Chemicals
CIG Companhia Energetica de Minas Gerais Utilities Electric Utilities
CPHC Canterbury Park Holding Corp. Services Gaming Activities
CSC Computer Sciences Corporation Technology Information Technology Services
CTFO China TransInfo Technology Corp. Technology Application Software
CTRP Ctrip.com International Ltd. Services Consumer Services
DAC Danaos Corporation Services Shipping
DNDN Dendreon Corp. Healthcare Biotechnology
GMCR Green Mountain Coffee Roasters Inc. Consumer Goods Processed & Packaged Goods
GRRF China GrenTech Corp. Ltd. Technology Wireless Communications
HRC Hill-Rom Holdings, Inc. Healthcare Medical Instruments & Supplies
JADE LJ International Inc. Consumer Goods Recreational Goods, Other
KONG Kongzhong Corp. Services Business Services
LTBR Lightbridge Corp. Basic Materials Synthetics
MDTH MedCath Corp. Healthcare Hospitals
MNTX Manitex International, Inc. Industrial Goods Diversified Machinery
OHB Orleans Homebuilders Inc. Industrial Goods Residential Construction
ONTY Oncothyreon Inc Healthcare Biotechnology
RA RailAmerica, Inc. Services Railroads
TTEK Tetra Tech Inc. Services Technical Services
UBET Youbet.com Inc. Services Gaming Activities
UGP Ultrapar Holdings Inc. Services Specialty Retail, Other
USHS US Home Systems Inc. Consumer Goods Home Furnishings & Fixtures
WES Western Gas Partners Lp Basic Materials Oil & Gas Pipelines
Tuesday, November 10, 2009
Market wrap - 4:25
A mixed close today in the markets, but the previous highs were not breached on the S&P.
Dow/quotes/comstock/10w!i:dji/delayed 10,247 20 0.20%
Nasdaq/quotes/comstock/10y!i:comp 2,151 -3 -0.14%
S&P 500/quotes/comstock/21z!i1:in\x 1,093 0 -0.01%
Gold/quotes/comstock/21e!f1:gc\z09 1,103 +1 +0.10%
Oil/quotes/comstock/21n!f2:cl\z09 79.14 -0.38 -0.48%
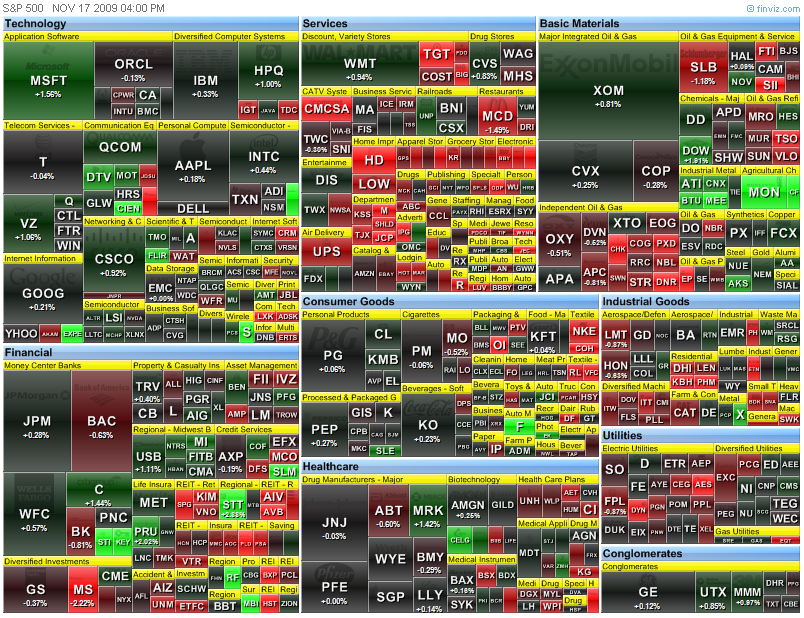
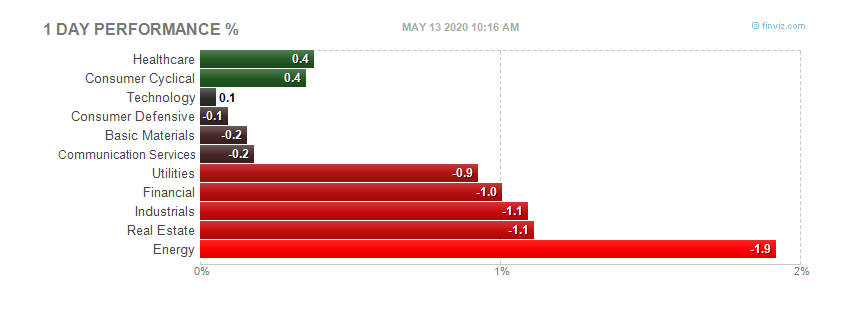
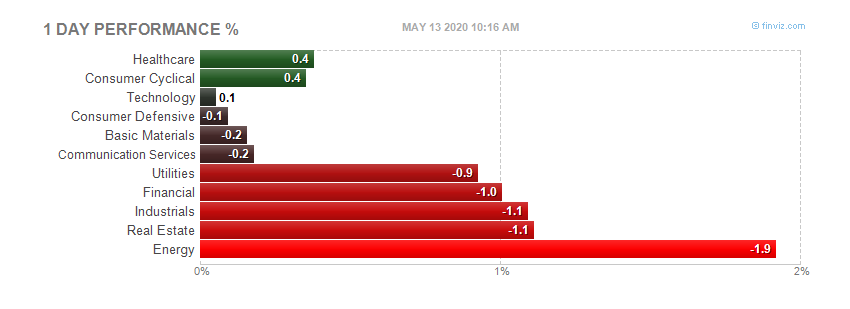
Today by sector:
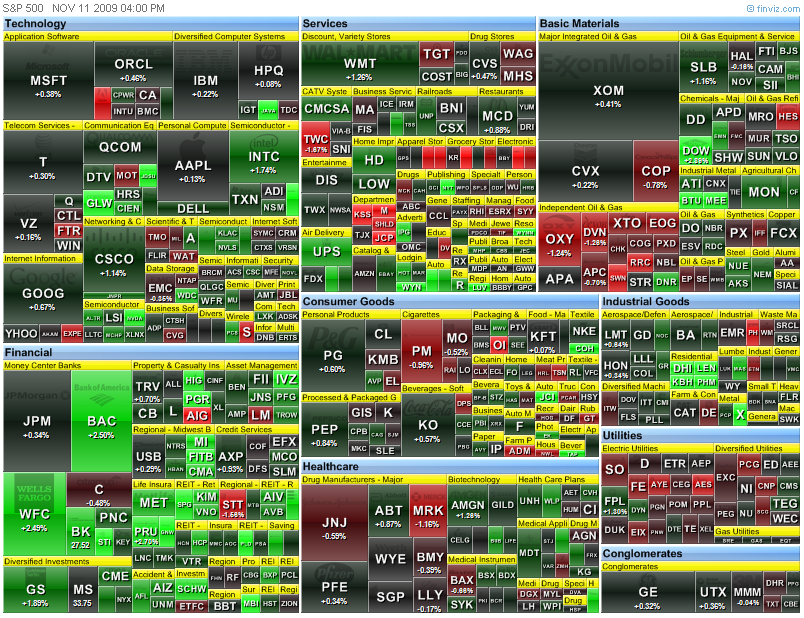
 Today's heatmap:

 Today's heatmap:

H-1B visa article in the WSJ - Interesting - 12:50
From the WSJ
By MONA SARIKA
Sudhir Kapoor, 25, got the call from his employer late last year. It was bad news: The economic downturn meant the technology company had to let him go.
He had arrived on an H-1B visa for highly skilled workers—but the layoff left two options: quickly find another job or go back home. In a few weeks, he was on a plane to Mumbai.
""I do feel bad for anyone losing a job, whether it's an American or an H-1B foreign worker. But for H-1B foreign worker, if we don't get a job, we have to go back to our home countries," said Mr. Kapoor.
As The Wall Street Journal reported late last month, this years marks the first time in a long while that H-1B visas are going unused. As of Sept. 25 -- nearly six months after the U.S. government began accepting applications for H-1s-- only 46,700 petitions had been filed. Last year, all 65,000 were spoken for on the first day.
In February, President Obama signed legislation placing certain restrictions on companies that received government bailout money, such as ensuring they did not displace American workers with H-1B visa holders. While Bank of America rescinded offers to some MBA graduates of U.S. universities as a result, it appears layoffs are more often to blame for the lack of visa renewals. As their fate becomes increasingly uncertain, a growing number of Indians in America — both temporary workers and permanent residents who only a few years ago fought to win lucrative jobs from Wall Street to Silicon Valley--are now packing up and heading home to India.
In many cases, their exodus is a bitter one. Laxmi Aiyar, who is returning to India after she was laid off by her company, says, "It is Indian talents who made America rich and prosperous. Now, they are throwing us out like a can of Pepsi."
Since nearly 40 percent of all H-1B visa holders are from India , the mounting layoffs are hitting Indian professionals particularly hard.
An estimated 16,000 to 20,000 Indian nationals have returned home, says Arvind Panagariya, an economics professor at Columbia University and a senior fellow at the Brookings Institution.
H-1B visa holders say they feel they are in a state of limbo, ready to pick up and move wherever the economy or work takes them. Lives have been disrupted, and some said they were under tremendous stress to pay back mortgage loans for buying houses and cars. Many had children born on U.S. soil and wonder how their children will adjust to Indian schools and a different way of life.
It is one of the major vulnerabilities for professionals on the H-1B visa. "The moment you don't work, you're out of status, you have no grace period," said immigration attorney Tahmina Watson. Workers can either leave the country within a matter of days, or convert to a B1/B2 tourist visa, which doesn't allow them to work, but buys them a few months to sell their homes and cars, make travel arrangements or find a new school for their children.
Some are grateful for the U.S. experience nonetheless. Niraj Sharma, a New York City consultant, was forced to pack in his entire life in the U.S. and return to India within a month. "The H-1B process was clear and we knew its limitations," he reasons. "But the work experience in the U.S. was tremendously valuable and it provides us with leverage in Asia to prosper."
Unlike previous generations who permanently settled in U.S, Mr. Sharma thinks of himself as part of a new Indian nomadic class: "If the next opportunity is in the U.K. or Africa , we will go there. …People have always moved to places of opportunity. While the U.S. will always be a beacon of opportunity, other countries have also started competing with it."
There is a difference between choosing to go back home and being forced to. H-1s have been reluctant to publicize their plight, for two reasons: They fear that most Americans are unsympathetic to their predicament, and many do not want their family and friends in India to know that their American dream didn't quite work out.
Moving back to India is unsettling for immigrants after spending years living and working in U.S. Both they and India have changed during their stint abroad. "We knew this wasn't going to be a smooth ride or piece of cake for us. The biggest worry for us was not about moving here (to Bangalore ), but about what we would do after this. Would we have to go to a different city in the U.S.? Could we go back to the Bay Area?" said Sweta Mehta, who moved last year from California, to Bangalore.
She had immigrated to the U.S. at the age of 18 to attend college. After graduating, she went to work for Intel, got married, and settled in Sacramento . However, when she and her husband got laid off, they had to leave US and move to Bangalore . Her six year-old misses her life in America . "She was asking about her friends and teachers," said Ms. Mehta.
To smooth the transition, Ms. Mehta and her family moved into an apartment complex that's popular among returnees from the US. Aside from the amenities that remind them of the U.S. , it provides a community with whom they can share stories and experiences. "It makes a difference that people have lived in U.S. ," she said. Mindful of the uncertainty, the Mehta still have their eye on returning to the U.S. -- when the economy improves.
Returnees, too, are finding it harder to get a job at an Indian company than just a few years ago. If someone has worked abroad for more than seven years, they are often found unfit to work in "resurgent India ." And managers have to tread carefully between paying them more than "locals."
Still, for the first time, the depth of the recession and bleak labor market are forcing Indian immigrants still in the U.S. to ask a question their predecessors never would have: Why stay?
"What America 's basically saying is, 'We've educated you, we've trained you, we've taught you all about our markets,'" says Vivek Wadhwa, a successful Indian-born tech entrepreneur turned Duke University professor. "'Now you have to get the hell out of here.
Mr. Wadhwa estimates the U.S. will lose at least 100,000 Indians in the next three to five years. Ironically, he says, "they're exactly the kind of people we want to be here to fuel the economic recovery."
The typical Indian professional's journey to the U.S. used to begin in one of two ways—the student visa or the H-1B.
"Our generation has benefited because America has welcomed us and we have learned so much here," said Himanshu Khare, a software professional in Boston on a H1B visa, but thinking of going back to India.
"But now the H-1B has become a distant dream, ending our great American dream. It's time for us to say goodbye to America , and hello to India "
—Mona Sarika is a graduate student and freelance writer who hails from India and currently lives in New York City.
*****
As someone who trained Indian people to take our jobs, I am not too distressed over this. American's need jobs too.
Interesting article on oil - 8:30 am
From the Guardian UK
Exclusive: Watchdog's estimates of reserves inflated says top official
 The world is much closer to running out of oil than official estimates admit, according to a whistleblower at the International Energy Agency who claims it has been deliberately underplaying a looming shortage for fear of triggering panic buying.
The senior official claims the US has played an influential role in encouraging the watchdog to underplay the rate of decline from existing oil fields while overplaying the chances of finding new reserves.
The allegations raise serious questions about the accuracy of the organisation's latest World Energy Outlook on oil demand and supply to be published tomorrow – which is used by the British and many other governments to help guide their wider energy and climate change policies.
'There's suspicion the IEA has been influenced by the US' Link to this audio
In particular they question the prediction in the last World Economic Outlook, believed to be repeated again this year, that oil production can be raised from its current level of 83m barrels a day to 105m barrels. External critics have frequently argued that this cannot be substantiated by firm evidence and say the world has already passed its peak in oil production.
Now the "peak oil" theory is gaining support at the heart of the global energy establishment. "The IEA in 2005 was predicting oil supplies could rise as high as 120m barrels a day by 2030 although it was forced to reduce this gradually to 116m and then 105m last year," said the IEA source, who was unwilling to be identified for fear of reprisals inside the industry. "The 120m figure always was nonsense but even today's number is much higher than can be justified and the IEA knows this.
"Many inside the organisation believe that maintaining oil supplies at even 90m to 95m barrels a day would be impossible but there are fears that panic could spread on the financial markets if the figures were brought down further. And the Americans fear the end of oil supremacy because it would threaten their power over access to oil resources," he added.
A second senior IEA source, who has now left but was also unwilling to give his name, said a key rule at the organisation was that it was "imperative not to anger the Americans" but the fact was that there was not as much oil in the world as had been admitted. "We have [already] entered the 'peak oil' zone. I think that the situation is really bad," he added.
The IEA acknowledges the importance of its own figures, boasting on its website: "The IEA governments and industry from all across the globe have come to rely on the World Energy Outlook to provide a consistent basis on which they can formulate policies and design business plans."
The British government, among others, always uses the IEA statistics rather than any of its own to argue that there is little threat to long-term oil supplies.
The IEA said tonight that peak oil critics had often wrongly questioned the accuracy of its figures. A spokesman said it was unable to comment ahead of the 2009 report being released tomorrow.
John Hemming, the MP who chairs the all-party parliamentary group on peak oil and gas, said the revelations confirmed his suspicions that the IEA underplayed how quickly the world was running out and this had profound implications for British government energy policy.
He said he had also been contacted by some IEA officials unhappy with its lack of independent scepticism over predictions. "Reliance on IEA reports has been used to justify claims that oil and gas supplies will not peak before 2030. It is clear now that this will not be the case and the IEA figures cannot be relied on," said Hemming.
"This all gives an importance to the Copenhagen [climate change] talks and an urgent need for the UK to move faster towards a more sustainable [lower carbon] economy if it is to avoid severe economic dislocation," he added.
The IEA was established in 1974 after the oil crisis in an attempt to try to safeguard energy supplies to the west. The World Energy Outlook is produced annually under the control of the IEA's chief economist, Fatih Birol, who has defended the projections from earlier outside attack. Peak oil critics have often questioned the IEA figures.
But now IEA sources who have contacted the Guardian say that Birol has increasingly been facing questions about the figures inside the organisation.
Matt Simmons, a respected oil industry expert, has long questioned the decline rates and oil statistics provided by Saudi Arabia on its own fields. He has raised questions about whether peak oil is much closer than many have accepted.
A report by the UK Energy Research Centre (UKERC) last month said worldwide production of conventionally extracted oil could "peak" and go into terminal decline before 2020 – but that the government was not facing up to the risk. Steve Sorrell, chief author of the report, said forecasts suggesting oil production will not peak before 2030 were "at best optimistic and at worst implausible".
But as far back as 2004 there have been people making similar warnings. Colin Campbell, a former executive with Total of France told a conference: "If the real [oil reserve] figures were to come out there would be panic on the stock markets … in the end that would suit no one."
The world is much closer to running out of oil than official estimates admit, according to a whistleblower at the International Energy Agency who claims it has been deliberately underplaying a looming shortage for fear of triggering panic buying.
The senior official claims the US has played an influential role in encouraging the watchdog to underplay the rate of decline from existing oil fields while overplaying the chances of finding new reserves.
The allegations raise serious questions about the accuracy of the organisation's latest World Energy Outlook on oil demand and supply to be published tomorrow – which is used by the British and many other governments to help guide their wider energy and climate change policies.
'There's suspicion the IEA has been influenced by the US' Link to this audio
In particular they question the prediction in the last World Economic Outlook, believed to be repeated again this year, that oil production can be raised from its current level of 83m barrels a day to 105m barrels. External critics have frequently argued that this cannot be substantiated by firm evidence and say the world has already passed its peak in oil production.
Now the "peak oil" theory is gaining support at the heart of the global energy establishment. "The IEA in 2005 was predicting oil supplies could rise as high as 120m barrels a day by 2030 although it was forced to reduce this gradually to 116m and then 105m last year," said the IEA source, who was unwilling to be identified for fear of reprisals inside the industry. "The 120m figure always was nonsense but even today's number is much higher than can be justified and the IEA knows this.
"Many inside the organisation believe that maintaining oil supplies at even 90m to 95m barrels a day would be impossible but there are fears that panic could spread on the financial markets if the figures were brought down further. And the Americans fear the end of oil supremacy because it would threaten their power over access to oil resources," he added.
A second senior IEA source, who has now left but was also unwilling to give his name, said a key rule at the organisation was that it was "imperative not to anger the Americans" but the fact was that there was not as much oil in the world as had been admitted. "We have [already] entered the 'peak oil' zone. I think that the situation is really bad," he added.
The IEA acknowledges the importance of its own figures, boasting on its website: "The IEA governments and industry from all across the globe have come to rely on the World Energy Outlook to provide a consistent basis on which they can formulate policies and design business plans."
The British government, among others, always uses the IEA statistics rather than any of its own to argue that there is little threat to long-term oil supplies.
The IEA said tonight that peak oil critics had often wrongly questioned the accuracy of its figures. A spokesman said it was unable to comment ahead of the 2009 report being released tomorrow.
John Hemming, the MP who chairs the all-party parliamentary group on peak oil and gas, said the revelations confirmed his suspicions that the IEA underplayed how quickly the world was running out and this had profound implications for British government energy policy.
He said he had also been contacted by some IEA officials unhappy with its lack of independent scepticism over predictions. "Reliance on IEA reports has been used to justify claims that oil and gas supplies will not peak before 2030. It is clear now that this will not be the case and the IEA figures cannot be relied on," said Hemming.
"This all gives an importance to the Copenhagen [climate change] talks and an urgent need for the UK to move faster towards a more sustainable [lower carbon] economy if it is to avoid severe economic dislocation," he added.
The IEA was established in 1974 after the oil crisis in an attempt to try to safeguard energy supplies to the west. The World Energy Outlook is produced annually under the control of the IEA's chief economist, Fatih Birol, who has defended the projections from earlier outside attack. Peak oil critics have often questioned the IEA figures.
But now IEA sources who have contacted the Guardian say that Birol has increasingly been facing questions about the figures inside the organisation.
Matt Simmons, a respected oil industry expert, has long questioned the decline rates and oil statistics provided by Saudi Arabia on its own fields. He has raised questions about whether peak oil is much closer than many have accepted.
A report by the UK Energy Research Centre (UKERC) last month said worldwide production of conventionally extracted oil could "peak" and go into terminal decline before 2020 – but that the government was not facing up to the risk. Steve Sorrell, chief author of the report, said forecasts suggesting oil production will not peak before 2030 were "at best optimistic and at worst implausible".
But as far back as 2004 there have been people making similar warnings. Colin Campbell, a former executive with Total of France told a conference: "If the real [oil reserve] figures were to come out there would be panic on the stock markets … in the end that would suit no one."
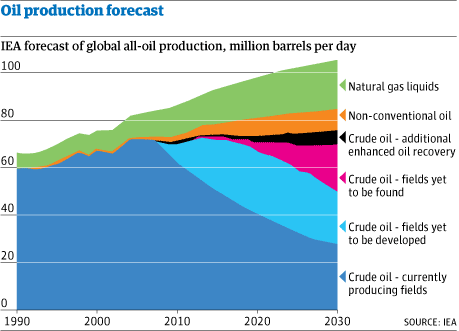 The world is much closer to running out of oil than official estimates admit, according to a whistleblower at the International Energy Agency who claims it has been deliberately underplaying a looming shortage for fear of triggering panic buying.
The senior official claims the US has played an influential role in encouraging the watchdog to underplay the rate of decline from existing oil fields while overplaying the chances of finding new reserves.
The allegations raise serious questions about the accuracy of the organisation's latest World Energy Outlook on oil demand and supply to be published tomorrow – which is used by the British and many other governments to help guide their wider energy and climate change policies.
'There's suspicion the IEA has been influenced by the US' Link to this audio
In particular they question the prediction in the last World Economic Outlook, believed to be repeated again this year, that oil production can be raised from its current level of 83m barrels a day to 105m barrels. External critics have frequently argued that this cannot be substantiated by firm evidence and say the world has already passed its peak in oil production.
Now the "peak oil" theory is gaining support at the heart of the global energy establishment. "The IEA in 2005 was predicting oil supplies could rise as high as 120m barrels a day by 2030 although it was forced to reduce this gradually to 116m and then 105m last year," said the IEA source, who was unwilling to be identified for fear of reprisals inside the industry. "The 120m figure always was nonsense but even today's number is much higher than can be justified and the IEA knows this.
"Many inside the organisation believe that maintaining oil supplies at even 90m to 95m barrels a day would be impossible but there are fears that panic could spread on the financial markets if the figures were brought down further. And the Americans fear the end of oil supremacy because it would threaten their power over access to oil resources," he added.
A second senior IEA source, who has now left but was also unwilling to give his name, said a key rule at the organisation was that it was "imperative not to anger the Americans" but the fact was that there was not as much oil in the world as had been admitted. "We have [already] entered the 'peak oil' zone. I think that the situation is really bad," he added.
The IEA acknowledges the importance of its own figures, boasting on its website: "The IEA governments and industry from all across the globe have come to rely on the World Energy Outlook to provide a consistent basis on which they can formulate policies and design business plans."
The British government, among others, always uses the IEA statistics rather than any of its own to argue that there is little threat to long-term oil supplies.
The IEA said tonight that peak oil critics had often wrongly questioned the accuracy of its figures. A spokesman said it was unable to comment ahead of the 2009 report being released tomorrow.
John Hemming, the MP who chairs the all-party parliamentary group on peak oil and gas, said the revelations confirmed his suspicions that the IEA underplayed how quickly the world was running out and this had profound implications for British government energy policy.
He said he had also been contacted by some IEA officials unhappy with its lack of independent scepticism over predictions. "Reliance on IEA reports has been used to justify claims that oil and gas supplies will not peak before 2030. It is clear now that this will not be the case and the IEA figures cannot be relied on," said Hemming.
"This all gives an importance to the Copenhagen [climate change] talks and an urgent need for the UK to move faster towards a more sustainable [lower carbon] economy if it is to avoid severe economic dislocation," he added.
The IEA was established in 1974 after the oil crisis in an attempt to try to safeguard energy supplies to the west. The World Energy Outlook is produced annually under the control of the IEA's chief economist, Fatih Birol, who has defended the projections from earlier outside attack. Peak oil critics have often questioned the IEA figures.
But now IEA sources who have contacted the Guardian say that Birol has increasingly been facing questions about the figures inside the organisation.
Matt Simmons, a respected oil industry expert, has long questioned the decline rates and oil statistics provided by Saudi Arabia on its own fields. He has raised questions about whether peak oil is much closer than many have accepted.
A report by the UK Energy Research Centre (UKERC) last month said worldwide production of conventionally extracted oil could "peak" and go into terminal decline before 2020 – but that the government was not facing up to the risk. Steve Sorrell, chief author of the report, said forecasts suggesting oil production will not peak before 2030 were "at best optimistic and at worst implausible".
But as far back as 2004 there have been people making similar warnings. Colin Campbell, a former executive with Total of France told a conference: "If the real [oil reserve] figures were to come out there would be panic on the stock markets … in the end that would suit no one."
The world is much closer to running out of oil than official estimates admit, according to a whistleblower at the International Energy Agency who claims it has been deliberately underplaying a looming shortage for fear of triggering panic buying.
The senior official claims the US has played an influential role in encouraging the watchdog to underplay the rate of decline from existing oil fields while overplaying the chances of finding new reserves.
The allegations raise serious questions about the accuracy of the organisation's latest World Energy Outlook on oil demand and supply to be published tomorrow – which is used by the British and many other governments to help guide their wider energy and climate change policies.
'There's suspicion the IEA has been influenced by the US' Link to this audio
In particular they question the prediction in the last World Economic Outlook, believed to be repeated again this year, that oil production can be raised from its current level of 83m barrels a day to 105m barrels. External critics have frequently argued that this cannot be substantiated by firm evidence and say the world has already passed its peak in oil production.
Now the "peak oil" theory is gaining support at the heart of the global energy establishment. "The IEA in 2005 was predicting oil supplies could rise as high as 120m barrels a day by 2030 although it was forced to reduce this gradually to 116m and then 105m last year," said the IEA source, who was unwilling to be identified for fear of reprisals inside the industry. "The 120m figure always was nonsense but even today's number is much higher than can be justified and the IEA knows this.
"Many inside the organisation believe that maintaining oil supplies at even 90m to 95m barrels a day would be impossible but there are fears that panic could spread on the financial markets if the figures were brought down further. And the Americans fear the end of oil supremacy because it would threaten their power over access to oil resources," he added.
A second senior IEA source, who has now left but was also unwilling to give his name, said a key rule at the organisation was that it was "imperative not to anger the Americans" but the fact was that there was not as much oil in the world as had been admitted. "We have [already] entered the 'peak oil' zone. I think that the situation is really bad," he added.
The IEA acknowledges the importance of its own figures, boasting on its website: "The IEA governments and industry from all across the globe have come to rely on the World Energy Outlook to provide a consistent basis on which they can formulate policies and design business plans."
The British government, among others, always uses the IEA statistics rather than any of its own to argue that there is little threat to long-term oil supplies.
The IEA said tonight that peak oil critics had often wrongly questioned the accuracy of its figures. A spokesman said it was unable to comment ahead of the 2009 report being released tomorrow.
John Hemming, the MP who chairs the all-party parliamentary group on peak oil and gas, said the revelations confirmed his suspicions that the IEA underplayed how quickly the world was running out and this had profound implications for British government energy policy.
He said he had also been contacted by some IEA officials unhappy with its lack of independent scepticism over predictions. "Reliance on IEA reports has been used to justify claims that oil and gas supplies will not peak before 2030. It is clear now that this will not be the case and the IEA figures cannot be relied on," said Hemming.
"This all gives an importance to the Copenhagen [climate change] talks and an urgent need for the UK to move faster towards a more sustainable [lower carbon] economy if it is to avoid severe economic dislocation," he added.
The IEA was established in 1974 after the oil crisis in an attempt to try to safeguard energy supplies to the west. The World Energy Outlook is produced annually under the control of the IEA's chief economist, Fatih Birol, who has defended the projections from earlier outside attack. Peak oil critics have often questioned the IEA figures.
But now IEA sources who have contacted the Guardian say that Birol has increasingly been facing questions about the figures inside the organisation.
Matt Simmons, a respected oil industry expert, has long questioned the decline rates and oil statistics provided by Saudi Arabia on its own fields. He has raised questions about whether peak oil is much closer than many have accepted.
A report by the UK Energy Research Centre (UKERC) last month said worldwide production of conventionally extracted oil could "peak" and go into terminal decline before 2020 – but that the government was not facing up to the risk. Steve Sorrell, chief author of the report, said forecasts suggesting oil production will not peak before 2030 were "at best optimistic and at worst implausible".
But as far back as 2004 there have been people making similar warnings. Colin Campbell, a former executive with Total of France told a conference: "If the real [oil reserve] figures were to come out there would be panic on the stock markets … in the end that would suit no one."
Pre-market - Tuesday, November 10,2009
Futures down slightly. Not to worry, liftoff at 9:30.
DJIA INDEX 10,169.00 -23.00
S&P 500 1,088.60 -3.10
NASDAQ 100 1,763.25 -3.25
Today's economic calendar:
ICSC-Goldman Store Sales 7:45 AM ET
Redbook 8:55 AM ET
4-Week Bill Auction 11:30 AM ET
10-Yr Note Auction 1:00 PM ET
Today's earnings reports.
Before open:
AKRX Akorn Inc. Healthcare Diagnostic Substances
APP American Apparel, Inc. Consumer Goods Textile - Apparel Clothing
ARM ArvinMeritor Inc. Consumer Goods Auto Parts
BZH Beazer Homes USA Inc. Industrial Goods Residential Construction
CGV Compagnie Générale de Géophysique-Veritas Basic Materials Oil & Gas Equipment & Services
CPIX Cumberland Pharmaceuticals, Inc. Healthcare Drug Manufacturers - Other
CVU CPI Aerostructures Inc. Industrial Goods Aerospace/Defense Products & Services
CYD China Yuchai International Limited Industrial Goods Diversified Machinery
DSX Diana Shipping Inc. Services Shipping
DWSN Dawson Geophysical Co. Basic Materials Oil & Gas Equipment & Services
FCFC FirstCity Financial Corp. Financial Asset Management
FOSL Fossil Inc. Consumer Goods Recreational Goods, Other
FTK Flotek Industries Inc. Basic Materials Specialty Chemicals
GIGM GigaMedia Ltd. Technology Internet Software & Services
GOLD Randgold Resources Ltd. Basic Materials Gold
GSL Global Ship Lease, Inc. Services Shipping
HEW Hewitt Associates Inc. Services Management Services
HOGS Zhongpin, Inc. Consumer Goods Meat Products
HRBN Harbin Electric, Inc. Industrial Goods Industrial Electrical Equipment
IDN Intellicheck Mobilisa, Inc. Technology Business Software & Services
JASO JA Solar Holdings Co., Ltd. Technology Semiconductor - Specialized
KERX Keryx Biopharmaceuticals Inc. Healthcare Drug Manufacturers - Major
MHLD Maiden Holdings, Ltd. Financial Insurance Brokers
ORBT Orbit International Corp. Services Electronics Wholesale
PGNX Progenics Pharmaceuticals Inc. Healthcare Biotechnology
RHIE RHI Entertainment, Inc. Services Movie Production, Theaters
SYUT Synutra International Inc. Consumer Goods Dairy Products
SYX Systemax Inc. Services Catalog & Mail Order Houses
TYC Tyco International Ltd. Industrial Goods Diversified Machinery
UPG Universal Power Group Inc. Services Electronics Wholesale
WGA Wells-Gardner Electronics Corp. Technology Diversified Electronics
After close:
AMCN AirMedia Group Inc. Services Marketing Services
AONE A123 Systems, Inc. Industrial Goods Industrial Electrical Equipment
ATO Atmos Energy Corp. Utilities Gas Utilities
BOBE Bob Evans Farms Inc. Services Restaurants
CLWR Clearwire Corporation Technology Wireless Communications
CPL CPFL Energia S.A. Utilities Foreign Utilities
EM Emdeon Inc. Services Business Services
FMCN Focus Media Holding Ltd. Services Advertising Agencies
HNSN Hansen Medical, Inc. Healthcare Medical Appliances & Equipment
HOO Cascal N V Utilities Water Utilities
INXI INX Inc. Services Computers Wholesale
ITP Intertape Polymer Group Inc. Consumer Goods Packaging & Containers
MFB Maidenform Brands, Inc. Consumer Goods Textile - Apparel Clothing
MIM MI Developments Inc. Financial Property Management
PAAS Pan American Silver Corp. Basic Materials Silver
PRGN Paragon Shipping Inc. Services Shipping
PVX Provident Energy Trust Basic Materials Independent Oil & Gas
RAH Ralcorp Holdings Inc. Consumer Goods Processed & Packaged Goods
RWC RELM Wireless Corp. Consumer Goods Electronic Equipment
SNS Steak n Shake Co. Services Restaurants
STS Supreme Industries Inc. Consumer Goods Trucks & Other Vehicles
STV China Digital TV Holding Co., Ltd. Technology Application Software
TBAC Tandy Brands Accessories Inc. Consumer Goods Textile - Apparel Footwear & Accessories
TRBR Trailer Bridge Inc. Services Shipping
ULTR Ultrapetrol (Bahamas) Ltd. Services Shipping
VM Virgin Mobile USA, Inc. Technology Wireless Communications
WTW Weight Watcher's International Inc. Services Personal Services
Monday, November 9, 2009
Market wrap - 4:40
Ho Hum...just another 200 point day in the casino. What can you say?
Dow 10,227 +204 +2.03%
Nasdaq 2,154 42 1.97%
S&P 500 1,093 24 2.22%
Gold 1,102 +6 +0.54%
Oil 79.30 2.00 2.59%
Today by sector:
 Today's heatmap:

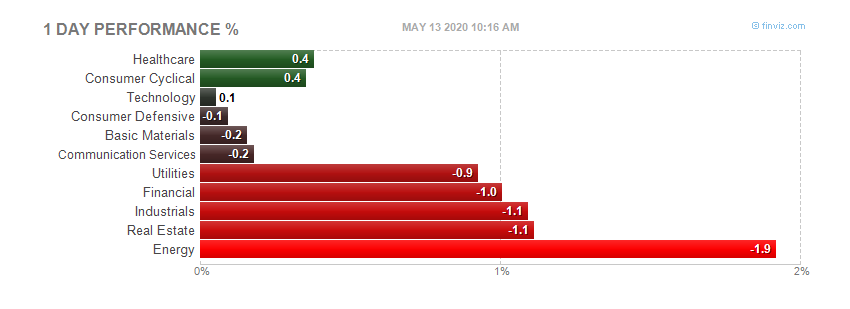 Today's heatmap:
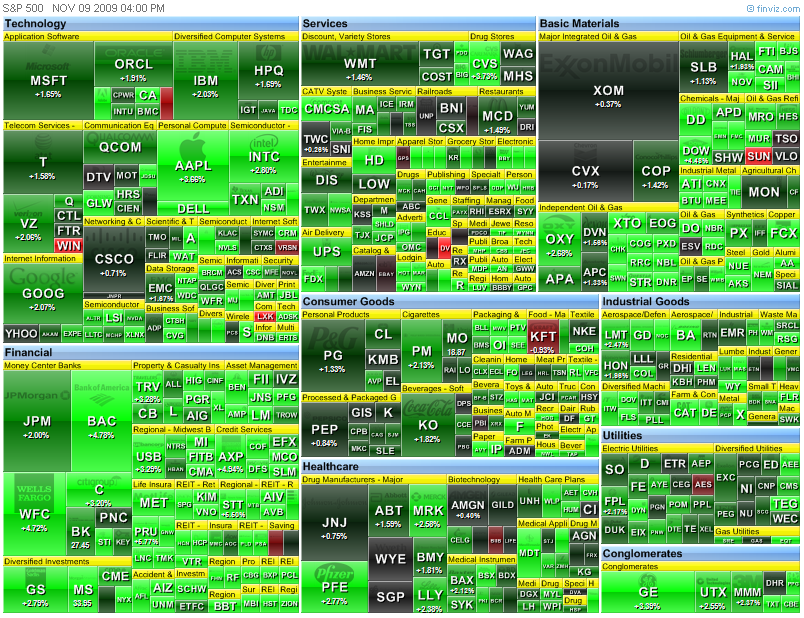
Bonus post - video from last Friday's Fast Money - Truth?
Once in a while, someone slips and makes some sense on the pumpfest channel known as CNBC. In this video, Melissa Lee corrects Rick Santelli on the market acting as a crystal ball into the future. Of course Santelli doesn't tell her what she wants to hear. Debbie Downers need not apply to the soon to be owned by someone else (Comcast)wing of the General Electric well connected propaganda channel.
Pre-market - Monday, November 9, 2009
Futures pointing upward, as dollar slide continues, and gold hits another high.
DJIA INDEX 10,072.00 94.00
S&P 500 1,077.30 11.10
NASDAQ 100 1,746.25 16.50
Today's economic calendar:
4-Week Bill Announcement 11:00 AM ET
3-Month Bill Auction 11:30 AM ET
6-Month Bill Auction 11:30 AM ET
3-Yr Note Auction 1:00 PM ET
Today's earnings report:
Before open:
AETI American Electric Technologies, Inc Industrial Goods Industrial Electrical Equipment
ALC Assisted Living Concepts Inc. Healthcare Long-Term Care Facilities
AMRI Albany Molecular Research Inc. Services Research Services
ANPI Angiotech Pharmaceuticals Inc. Healthcare Drug Manufacturers - Other
AOB American Oriental Bioengineering Inc. Healthcare Biotechnology
ATAI ATA, Inc. Services Education & Training Services
AWK American Water Works Company, Inc. Utilities Water Utilities
BPZ BPZ Resources, Inc. Basic Materials Oil & Gas Drilling & Exploration
CALP Caliper Life Sciences, Inc. Technology Scientific & Technical Instruments
CCOI Cogent Communications Group Inc. Technology Diversified Communication Services
CECE CECO Environmental Corp. Industrial Goods Pollution & Treatment Controls
CFSG China Fire & Security Group, Inc. Industrial Goods Industrial Equipment & Components
CHDX Chindex International Inc. Services Medical Equipment Wholesale
CNK Cinemark Holdings Inc. Services Movie Production, Theaters
CODI Compass Diversified Holdings Financial Diversified Investments
COMV Comverge, Inc. Technology Scientific & Technical Instruments
COWN Cowen Group Inc. Financial Investment Brokerage - National
CPBY China Information Security Technology, Inc. Technology Application Software
CRD-B Crawford & Co. Financial Insurance Brokers
CRE Care Investment Trust Inc. Financial Mortgage Investment
CRME Cardiome Pharma Corp. Healthcare Drug Manufacturers - Other
CYTX Cytori Therapeutics, Inc. Healthcare Biotechnology
DISH Dish Network Corp. Services CATV Systems
DX Dynex Capital Inc. Financial Mortgage Investment
ELOS Syneron Medical Ltd. Healthcare Medical Appliances & Equipment
ENER Energy Conversion Devices, Inc. Technology Semiconductor - Specialized
ENG ENGlobal Corp. Services Technical Services
EVEP EV Energy Partners LP Basic Materials Oil & Gas Drilling & Exploration
EVK Ever-Glory International Group, Inc. Consumer Goods Textile - Apparel Clothing
GIB CGI Group, Inc. Technology Internet Software & Services
GNET Global Traffic Network Inc. Technology Information & Delivery Services
GTN Gray Television Inc. Services Broadcasting - TV
GTXI GTX Inc. Healthcare Biotechnology
HPT Hospitality Properties Trust Financial REIT - Retail
HWCC Houston Wire & Cable Company Services Industrial Equipment Wholesale
HWK Hawk Corp. Industrial Goods Aerospace/Defense Products & Services
KDE 4 Kids Entertainment Inc. Services Consumer Services
KGS Quicksilver Gas Services LP. Basic Materials Oil & Gas Drilling & Exploration
KWK Quicksilver Resources Inc. Basic Materials Independent Oil & Gas
LINTA Liberty Media Interactive Services Entertainment - Diversified
MFN Minefinders Corp. Ltd. Basic Materials Industrial Metals & Minerals
NHP Nationwide Health Properties Inc. Financial REIT - Healthcare Facilities
NNI Nelnet Inc. Financial Credit Services
NOOF New Frontier Media Inc. Services Movie Production, Theaters
NTG NATCO Group Inc. Basic Materials Oil & Gas Drilling & Exploration
NTT Nippon Telegraph & Telephone Corp. Technology Telecom Services - Foreign
NWPX Northwest Pipe Co. Basic Materials Steel & Iron
PCAP Patriot Capital Funding, Inc. Financial Diversified Investments
PMFG PMFG, Inc. Industrial Goods Diversified Machinery
PRST Presstek Inc. Industrial Goods Diversified Machinery
RGNC Regency Energy Partners LP Basic Materials Oil & Gas Pipelines
ROK Rockwell Automation Inc. Industrial Goods Industrial Electrical Equipment
ROS Rostelecom OAO Technology Telecom Services - Foreign
RURL Rural/Metro Corp. Services Consumer Services
SATS EchoStar Corp. Technology Communication Equipment
SPP Sappi Limited Consumer Goods Paper & Paper Products
SRE Sempra Energy Utilities Gas Utilities
STRL Sterling Construction Co. Inc. Industrial Goods Heavy Construction
SWWC Southwest Water Co. Utilities Water Utilities
TA TravelCenters of America LLC Services Specialty Retail, Other
TBSI TBS International Limited Services Shipping
TLP Transmontaigne Partners L.P. Basic Materials Oil & Gas Pipelines
TRGL Toreador Resources Corp. Basic Materials Independent Oil & Gas
TRS TriMas Corporation Industrial Goods Industrial Equipment & Components
TSO Tesoro Corporation Basic Materials Oil & Gas Refining & Marketing
TTI TETRA Technologies Inc. Basic Materials Oil & Gas Equipment & Services
TWP Trex Co. Inc. Industrial Goods Lumber, Wood Production
URRE Uranium Resources, Inc. Basic Materials Industrial Metals & Minerals
VRNM Verenium Corporation Basic Materials Specialty Chemicals
VSR Versar Inc. Services Technical Services
WCRX Warner Chilcott plc Healthcare Drug Manufacturers - Other
WEL Boots & Coots, Inc. Basic Materials Oil & Gas Equipment & Services
WIN Windstream Corporation Technology Telecom Services - Domestic
WNR Western Refining Inc. Basic Materials Oil & Gas Refining & Marketing
XIN Xinyuan Real Estate Company Ltd. Industrial Goods Residential Construction
XPO Express-1 Expedited Solutions Inc Services Trucking
After close:
ACAD ACADIA Pharmaceuticals, Inc. Healthcare Biotechnology
AIS Antares Pharma Inc. Healthcare Medical Instruments & Supplies
ALXA Alexza Pharmaceuticals Inc. Healthcare Drug Manufacturers - Other
ANCI American Caresource Holdings, Inc. Healthcare Specialized Health Services
AOI Alliance One International, Inc. Consumer Goods Tobacco Products, Other
ARCI Appliance Recycling Centers of America Inc. Consumer Goods Appliances
ARNA Arena Pharmaceuticals, Inc. Healthcare Drug Manufacturers - Other
ARRY Array BioPharma, Inc. Healthcare Medical Laboratories & Research
AVCA Advocat Inc. Healthcare Long-Term Care Facilities
AXAS Abraxas Petroleum Corp. Basic Materials Independent Oil & Gas
BIDZ BIDZ.com, Inc. Services Catalog & Mail Order Houses
BJGP BMP Sunstone Corporation Healthcare Drug Related Products
BTN Ballantyne Strong, Inc Consumer Goods Photographic Equipment & Supplies
CAST ChinaCast Education Corporation Services Education & Training Services
CCO Clear Channel Outdoor Holdings Inc. Services Marketing Services
CDCS CDC Software Corporation Technology Application Software
CLCT Collectors Universe Inc. Services Business Services
CLNE Clean Energy Fuels Corp. Utilities Gas Utilities
CPST Capstone Turbine Corp. Industrial Goods Industrial Electrical Equipment
CSCX Cardiac Science Corporation Healthcare Medical Instruments & Supplies
DFR Deerfield Capital Corp. Financial Mortgage Investment
DGI DigitalGlobe, Inc. Technology Diversified Communication Services
DGW Duoyuan Global Water Inc. Industrial Goods Pollution & Treatment Controls
DIVX DivX, Inc. Technology Multimedia & Graphics Software
DTSI DTS Inc. Consumer Goods Electronic Equipment
EPE Enterprise GP Holdings L.P. Basic Materials Oil & Gas Refining & Marketing
ERTS Electronic Arts Inc. Technology Multimedia & Graphics Software
ESC Emeritus Corp. Healthcare Long-Term Care Facilities
FLL Full House Resorts Inc. Services Resorts & Casinos
FLR Fluor Corporation Industrial Goods Heavy Construction
FRPT Force Protection Inc. Consumer Goods Trucks & Other Vehicles
FXEN FX Energy Inc. Basic Materials Oil & Gas Drilling & Exploration
GEOI GeoResources, Inc. Basic Materials Independent Oil & Gas
GSS Golden Star Resources, Ltd. Basic Materials Gold
HEV Ener1, Inc. Industrial Goods Industrial Electrical Equipment
HMIN Home Inns & Hotels Management Inc. Services Lodging
HOLX Hologic Inc. Healthcare Medical Appliances & Equipment
HQS HQ Sustainable Maritime Industries Inc. Services Business Services
HR Healthcare Realty Trust Inc. Financial REIT - Healthcare Facilities
HTE Harvest Energy Trust Basic Materials Independent Oil & Gas
IMMR Immersion Corporation Technology Computer Peripherals
INTX Intersections Inc. Financial Credit Services
IPAR Inter Parfums Inc. Consumer Goods Personal Products
JAVA Sun Microsystems Inc. Technology Diversified Computer Systems
KEYN Keynote Systems Inc. Technology Internet Software & Services
LGF Lions Gate Entertainment Corp. Services Movie Production, Theaters
LYV Live Nation, Inc. Services General Entertainment
MBI MBIA Inc. Financial Surety & Title Insurance
MDR McDermott International Inc. Industrial Goods Heavy Construction
MIDD Middleby Corp. Industrial Goods Diversified Machinery
MLR Miller Industries Inc. Consumer Goods Auto Parts
MR Mindray Medical International Limited Healthcare Medical Instruments & Supplies
MWE MarkWest Energy Partners LP Basic Materials Oil & Gas Drilling & Exploration
NLS Nautilus Inc. Consumer Goods Sporting Goods
NP Neenah Paper, Inc. Consumer Goods Paper & Paper Products
NTY NBTY, Inc. Healthcare Drug Related Products
OPXT Opnext, Inc. Technology Semiconductor - Broad Line
PANL Universal Display Corp. Technology Computer Peripherals
PCLN Priceline.com Inc. Services General Entertainment
PGH Pengrowth Energy Trust Basic Materials Oil & Gas Drilling & Exploration
PIKE Pike Electric Corporation Industrial Goods General Contractors
QGEN Qiagen NV Healthcare Biotechnology
RAX Rackspace Hosting, Inc Technology Internet Software & Services
RENT Rentrak Corporation Services Movie Production, Theaters
RZ Raser Technologies, Inc. Industrial Goods Industrial Electrical Equipment
SDTH Shengdatech, Inc. Basic Materials Specialty Chemicals
SF Stifel Financial Corp. Financial Investment Brokerage - Regional
SGK Schawk Inc. Services Marketing Services
SHS Sauer-Danfoss Inc. Industrial Goods Diversified Machinery
SLW Silver Wheaton Corp. Basic Materials Silver
SLXP Salix Pharmaceuticals Ltd. Healthcare Drug Related Products
SOLR GT Solar International, Inc. Technology Semiconductor - Specialized
SQNM Sequenom Inc. Healthcare Biotechnology
TEAM TechTeam Global Inc. Technology Information Technology Services
TIXC Tix Corporation Services General Entertainment
TKTM Ticketmaster Entertainment, Inc. Services Business Services
TLCR Talecris Biotherapeutics Holdings Corp. Healthcare Biotechnology
TMRK Terremark Worldwide, Inc. Technology Telecom Services - Foreign
TXIC Tongxin International, Ltd. Consumer Goods Auto Parts
UNCA Unica Corp. Technology Business Software & Services
UTK UTEK Corporation Services Business Services
WAVX Wave Systems Corp. Technology Computer Peripherals
Subscribe to:
Posts (Atom)

