
Wednesday, October 14, 2009
Retail Sales - 8:30 am
Full report here
ADVANCE MONTHLY SALES FOR RETAIL TRADE AND FOOD SERVICES
SEPTEMBER 2009
Special Notice - Beginning with the December 11, 2009 release for November 2009, estimates in this release will be based on a new sample. A new sample for the Advance Monthly Retail Trade Survey is selected about once every two and a half years. For further information on the sample revision, see our website at http://www.census.gov/retail.
The U.S. Census Bureau announced today that advance estimates of U.S. retail and food services sales for September, adjusted for seasonal variation and holiday and trading-day differences, but not for price changes, were $344.7 billion, a decrease of 1.5 percent (±0.5%) from the previous month and 5.7 percent (±0.7%) below September 2008. Total sales for the July through September 2009 period were down 6.6 percent (±0.3%) from the same period a year ago. The July to August 2009 percent change was revised from +2.7 percent (±0.5%) to +2.2 percent (±0.2%).
Retail trade sales were down 1.7 percent (±0.7%) from August 2009 and 6.4 percent (±0.7%) below last year. Gasoline stations sales were down 25.3 percent (±1.3%) from September 2008 and building material and garden equipment and supplies dealers were down 13.0 percent (±2.0%) from last year.
The advance estimates are based on a subsample of the Census Bureau's full retail and food services sample. A stratified random sampling method is used to select approximately 5,000 retail and food services firms whose sales are then weighted and benchmarked to represent the complete universe of over three million retail and food services firms. Responding firms account for approximately 65% of the MARTS dollar volume estimate. For an explanation of the measures of sampling variability included in this report, please see the Reliability of Estimates section on the last page of this publication.
Percent Change in Retail and Food Services Sales
(Estimates adjusted for seasonal variation, holiday, and trading-day differences, but not for price changes)


Pre-market - Wednesday, October 14, 2009
Futures up big after a good report from JP Morgan
DJIA INDEX 9,921.00 112.00
S&P 500 1,083.30 14.50
NASDAQ 100 1,750.75 24.00
Today's economic reports:
MBA Purchase Applications 7:00 AM ET
Retail Sales 8:30 AM ET
Import and Export Prices 8:30 AM ET
Business Inventories 10:00 AM ET
4-Week Bill Auction 1:00 PM ET
FOMC Minutes 2:00 PM ET
Today's earnings reports:
Before open:
ABT Abbott Laboratories Healthcare Drug Manufacturers - Major
ADTN ADTRAN Inc. Technology Communication Equipment
ASML ASML Holding N.V. Technology Semiconductor Equipment & Materials
CBSH Commerce Bancshares Inc. Financial Regional - Southwest Banks
GWW W.W. Grainger, Inc. Services Industrial Equipment Wholesale
HST Host Hotels & Resorts Inc. Financial REIT - Hotel/Motel
JPM JPMorgan Chase & Co. Financial Money Center Banks
LCRY LeCroy Corp. Technology Scientific & Technical Instruments
LUFK Lufkin Industries Inc. Basic Materials Oil & Gas Equipment & Services
MTOX MEDTOX Scientific Inc. Healthcare Medical Laboratories & Research
PGR Progressive Corp. Financial Property & Casualty Insurance
After close:
ATR AptarGroup, Inc. Consumer Goods Rubber & Plastics
CCK Crown Holdings Inc. Consumer Goods Packaging & Containers
DTLK Datalink Corp. Technology Business Software & Services
LSTR Landstar System Inc. Services Trucking
OHB Orleans Homebuilders Inc. Industrial Goods Residential Construction
PLCM Polycom, Inc. Technology Processing Systems & Products
SPTN Spartan Stores Inc. Services Food Wholesale
STLD Steel Dynamics Inc. Basic Materials Steel & Iron
STLY Stanley Furniture Co. Inc. Consumer Goods Home Furnishings & Fixtures
WDFC WD-40 Co. Basic Materials Specialty Chemicals
XLNX Xilinx Inc. Technology Semiconductor - Specialized
ZEP Zep, Inc. Consumer Goods Cleaning Products
Tuesday, October 13, 2009
Pre-market - Tuesday, October 13, 2009
Futures up slightly as earnings season goes into full swing:
DJIA INDEX 9,836.00 17.00
S&P 500 1,073.70 2.20
NASDAQ 100 1,731.75 4.00
Today's economic calendar:
ICSC-Goldman Store Sales 7:45 AM ET
Redbook 8:55 AM ET
4-Week Bill Announcement 11:00 AM ET
3-Month Bill Auction 1:00 PM ET
6-Month Bill Auction 1:00 PM ET
William Dudley Speaks 1:15 PM ET
Treasury Budget 2:00 PM ET
Today's earnings reports:
Before open:
DPZ Domino's Pizza, Inc. Services Restaurants
GIGM GigaMedia Ltd. Technology Internet Software & Services
HTLD Heartland Express Inc. Services Trucking
JNJ Johnson & Johnson Healthcare Drug Manufacturers - Major
KMGB KMG Chemicals Inc. Basic Materials Specialty Chemicals
After close:
ALTR Altera Corp. Technology Semiconductor - Specialized
CSX CSX Corp. Services Railroads
EXFO EXFO Electro Optical Engineering Inc. Technology Communication Equipment
HCSG Healthcare Services Group Inc. Services Business Services
IMMR Immersion Corporation Technology Computer Peripherals
INTC Intel Corporation Technology Semiconductor - Broad Line
LLTC Linear Technology Corp. Technology Semiconductor - Specialized
OZRK Bank of the Ozarks, Inc. Financial Regional - Southeast Banks
VOXX Audiovox Corp. Services Electronics Wholesale
Monday, October 12, 2009
Market wrap - 4:00 pm
On a very slow and uneventful day, with the bond market closed, Canadian holiday, and Japan closed, on virtually no volume:
Dow 9,886 +21 +0.21%
Nasdaq 2,139 0 -0.01%
S&P 500 1,076 5 0.44%
Gold 1,058 +9 +0.85%
Oil 73.15 1.50 2.09%
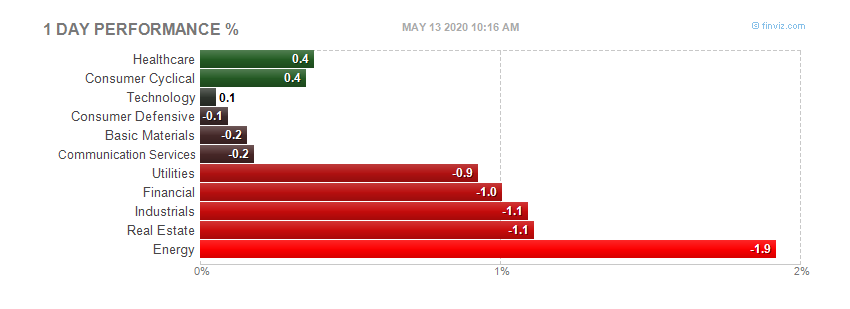
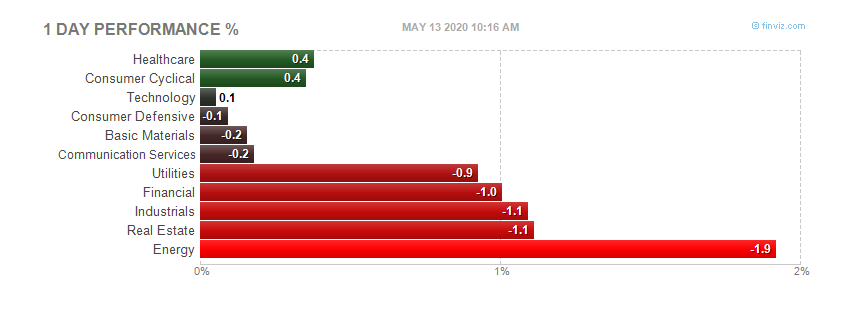
Today by sector:
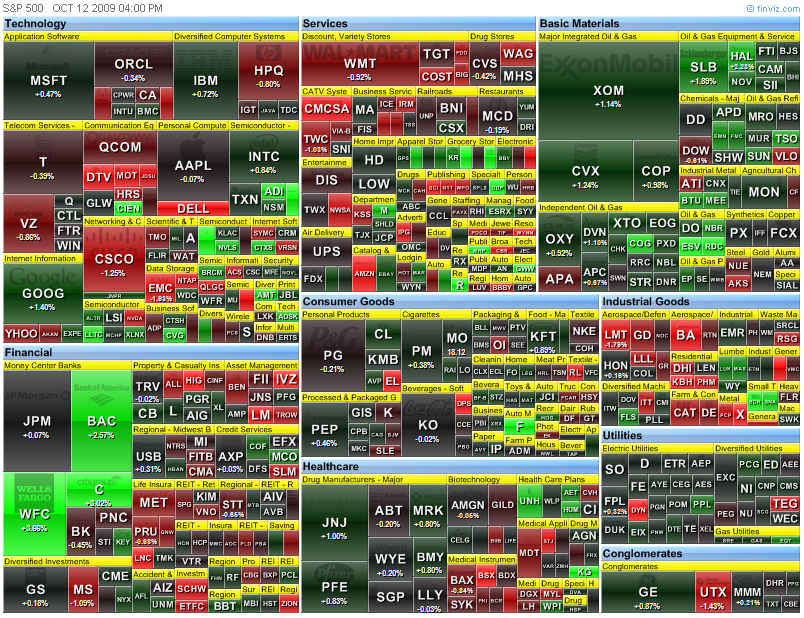
 Today's heatmap:

 Today's heatmap:
Pre-market - Monday, October 12, 2009
Futures up this morning before earning season starts full swing
DJIA INDEX 9,864.00 57.00
S&P 500 1,075.00 6.90
NASDAQ 100 1,735.50 10.00
Today's economic calendar:
Bond market closed
No significant events
Today's earnings reports:
Before open:
FAST
After close:
ELS
Friday, October 9, 2009
International Trade - 8:30 am
Full report here
U.S. INTERNATIONAL TRADE IN GOODS AND SERVICES
August 2009
Goods and Services
The U.S. Census Bureau and the U.S. Bureau of Economic Analysis, through the Department of Commerce, announced today that total August exports of $128.2 billion and imports of $158.9 billion resulted in a goods and services deficit of $30.7 billion, down from $31.9 billion in July, revised. August exports were $0.2 billion more than July exports of $128.0 billion. August imports were $0.9 billion less than July imports of $159.8 billion.
In August, the goods deficit decreased $0.8 billion from July to $41.9 billion, and the services surplus increased $0.3 billion to $11.2 billion. Exports of goods were virtually unchanged at $86.8 billion, and imports of goods decreased $0.8 billion to $128.7 billion. Exports of services increased $0.2 billion to $41.4 billion, and imports of services decreased $0.1 billion to $30.2 billion.
In August, the goods and services deficit decreased $30.2 billion from August 2008. Exports were down $33.4 billion, or 20.7 percent, and imports were down $63.6 billion, or 28.6 percent.
Goods (Census basis)
The July to August decrease in exports of goods reflected decreases in capital goods ($1.3 billion), other goods ($0.4 billion), and consumer goods ($0.1 billion). Increases occurred in industrial supplies and materials ($0.9 billion); automotive vehicles, parts, and engines ($0.5 billion); and foods, feeds, and beverages ($0.1 billion).
The July to August decrease in imports of goods reflected decreases in industrial supplies and materials ($1.0 billion); consumer goods ($0.7 billion); other goods ($0.2 billion); foods, feeds, and beverages ($0.1 billion); and capital goods ($0.1 billion). An increase occurred in automotive vehicles, parts, and engines ($1.2 billion).
The August 2008 to August 2009 decrease in exports of goods reflected decreases in industrial supplies and materials ($11.3 billion); capital goods ($9.5 billion); automotive vehicles, parts, and engines ($3.0 billion); foods, feeds, and beverages ($2.0 billion); consumer goods ($1.6 billion); and other goods ($1.0 billion).
The August 2008 to August 2009 decrease in imports of goods reflected decreases in industrial supplies and materials ($36.1 billion); capital goods ($8.0 billion); consumer goods ($7.2 billion); automotive vehicles, parts, and engines ($4.7 billion); foods, feeds, and beverages ($1.1 billion); and other goods ($0.7 billion).
Services
Services exports increased $0.2 billion from July to August. The increase was more than accounted for by increases in travel, other transportation (which includes freight and port services), and other private services (which includes items such as business, professional, and technical services, insurance services, and financial services). A decrease in transfers under U.S. military sales contracts was partly offsetting. Changes in other categories of services exports were small.
Services imports decreased $0.1 billion from July to August. The decrease was more than accounted for by a decrease in other transportation. An increase in travel was partly offsetting. Changes in other categories of services imports were small.
The August 2008 to August 2009 decrease in exports of services was $5.6 billion. The largest decreases were in travel ($2.0 billion), other transportation ($1.5 billion), and royalties and license fees ($0.9 billion).
The August 2008 to August 2009 decrease in imports of services was $5.5 billion. The largest decreases were in other transportation ($2.2 billion), royalties and license fees ($1.2 billion), and passenger fares ($0.7 billion).
Goods and Services Moving Average
For the three months ending in August, exports of goods and services averaged $127.0 billion, while imports of goods and services averaged $157.1 billion, resulting in an average trade deficit of $30.0 billion. For the three months ending in July, the average trade deficit was $28.6 billion, reflecting average exports of $125.1 billion and average imports of $153.6 billion.
Selected Not Seasonally Adjusted Goods Details
The August figures show surpluses, in billions of dollars, with Hong Kong $1.3 ($1.3 for July), Australia $1.2 ($0.7), Egypt $0.4 ($0.2), and Singapore $0.3 ($0.7). Deficits were recorded, in billions of dollars, with China $20.2 ($20.4), OPEC $6.4 ($6.9), European Union $5.4 ($8.0), Japan $4.3 ($3.9), Mexico $4.0 ($2.9), Venezuela $1.9 ($2.3), Nigeria $1.7 ($1.7), Canada $1.5 ($2.1), Taiwan $0.5 ($0.7), and Korea $0.4 ($1.0).
Advanced technology products exports were $18.5 billion in August and imports were $24.1 billion, resulting in a deficit of $5.6 billion. August exports were $1.5 billion less than the $20.0 billion in July, while August imports were $2.4 billion less than the $26.6 billion in July.
Revisions
Goods exports and imports for July were each revised up $0.1 billion. For July, revised export carry-over was virtually zero, revised down from $0.1 billion (0.1 percent). For July, revised import carry-over was $0.1 billion (0.1 percent), revised down from $0.6 billion (0.4 percent). Goods carry-over in August was virtually zero for exports and $0.7 billion (0.5 percent) for imports.
Services exports for July were revised up $0.3 billion to $41.2 billion. The revision was mostly accounted for by upward revisions in travel, other private services, and passenger fares. Services imports for July were revised up $0.2 billion to $30.3 billion. The revision was mostly accounted for by upward revisions in travel and passenger fares.
More at link with formatted tables
Pre-market - Friday, October 9, 2009
Futures about even at 7:30 am.
DJIA INDEX 9,743.00 -4.00
S&P 500 1,063.30 -0.50
NASDAQ 100 1,712.00 -4.50
Today's economic calendar:
International Trade 8:30 AM ET
Today's earnings reports:
Before open:
CMN Cantel Medical Corp. Healthcare Medical Instruments & Supplies
After close = NONE
Thursday, October 8, 2009

The dollar - good article from the WSJ
Full article here
By DAVID MALPASS
If you want to know why the dollar has been falling this week and gold hit a new high, look no further than the weak jobs numbers last Friday and the weak communique issued over the weekend at the G-7 meeting in Istanbul. Deploring "excess volatility and disorderly movements in exchange rates" isn't exactly a ringing defense of the greenback. And 9.8% unemployment convinced markets that monetary policy will remain loose regardless of dollar weakness.
Bond buyer Bill Gross of the Pimco fund summed up the situation nicely in a recent CNBC interview. Asked whether low interest rates will weaken the dollar, the influential allocator of global capital said: "I think that's part of the administration's plan. It's obviously not announced—the 'strong dollar' is always the policy, so to speak. One of the ways a country gets out from under its debt burden is to devalue."
On the surface, the weak dollar may not look so bad, especially for Wall Street. Gold, oil, the euro and equities are all rising as much as the dollar declines. They stay even in value terms and create lots of trading volume. And high unemployment keeps the Fed on hold, so anyone with extra dollars or the connections to borrow dollars wins by buying nondollar assets.
 Investors have been playing this weak-dollar trade for years, diverting more and more dollars into commodities, foreign currencies and foreign stock markets. This is the Third-World way of asset allocation.
Corporations play this game for bigger stakes, borrowing billions in dollars to expand their foreign businesses. As the pound slid in the 1950s and '60s and the British Empire crumbled, the corporations that prospered were the ones that borrowed pounds aggressively in order to expand abroad. Though British equities rose in pound terms, they generally underperformed gold and foreign equities. At the end of empire, the giant sucking sound was from British capital and jobs moving offshore as the pound sank.
Some weak-dollar advocates believe that American workers will eventually get cheap enough in foreign-currency terms to win manufacturing jobs back. In practice, however, capital outflows overwhelm the trade flows, causing more job losses than cheap real wages create. This was the lesson of the British malaise, the Carter malaise, the Mexican malaise of the 1990s, Yeltsin's Russian malaise through 1999 and the rest. No countries have devalued their way into prosperity, while many—Hong Kong, China, Australia today—have used stable money to invite capital and jobs.
The more the dollar devalued against the yen in the 1970s and '80s, the more Japan gained share in valued-added manufacturing, using the capital from weak-currency countries to increase productivity. China is doing the same now. It watches in chagrin as the U.S. pleads with it to strengthen the yuan, adding productivity fast with the dollars rushing its way in search of currency stability.
If stocks double but the dollar loses half its value, who beyond Wall Street are the winners and losers? There's been a clear demonstration this decade. The S&P nearly doubled from 2003 through 2007. Those who borrowed to buy won big-time. Rich people got richer, seeing their equity bottom line double. At the same time, the dollar's value was cut nearly in half versus the euro and other stable measures. Capital fled, undercutting job growth. Rent, gasoline and food prices rose more than wages.
Equity gains provide cold comfort when currencies crash. From the euro perspective, the S&P peaked at 1700 in 2000, finally reattained 1100 in the 2007 bubble, fell below 600 in March and now stands at 700 (see nearby chart). With most of the market capitalization of U.S. stocks held by Americans, the dollar devaluation has caused a massive decline in the U.S. share of global wealth.
Measured in euros (a more stable ruler than the ever-weakening dollar), U.S. real per capita GDP is down 25% since 2000, while Germany's is up 4% and tops ours.
The solution is a strong U.S. jobs and wealth program. It has to include stable money, a flatter, more competitive tax structure, spending restraint, and common-sense bank regulation so small business lending can restart. Treasury has to rapidly lengthen the maturity of the national debt and take steps to protect the Fed from market losses on its long-term debt holdings.
Instead, Washington's current economic program pushes capital away by weakening the dollar, threatening higher tax rates, borrowing short (the Fed's near trillion-dollar overnight debt, Treasury's mounds of bill and note issuance) to lend long (mortgages, student loans, entitlements), doubling down on government subsidies, and rechanneling bank loans to governments and big businesses instead of the small business job-growth engine.
It's possible global bond vigilantes will call Washington's bluff, reducing their bond purchases until we stop devaluing and restart job growth, which is the ultimate source of tax revenues to repay our bond debt. This would create a Volcker moment when the U.S. might tighten even as the economy slowed (as then Fed Chairman Paul Volcker did back in 1979).
But the accepted outlook is the almost-as-gloomy new norm. If all goes according to current plans, the dollar devalues slowly and bond buyers come back for more even as national debt heads toward $15 trillion. World living standards grow faster than ours, as does global wealth. The Fed chases inflation as the dollar sinks, but not so fast as to stop the recovery. More capital moves abroad, leaving U.S. unemployment too high too long.
A better approach would start with President Barack Obama rejecting the Bush administration's weak-dollar policy. This would invite capital and jobs to come back before interest rates have to rise.
Mr. Malpass is president of Encima Global LLC.
Investors have been playing this weak-dollar trade for years, diverting more and more dollars into commodities, foreign currencies and foreign stock markets. This is the Third-World way of asset allocation.
Corporations play this game for bigger stakes, borrowing billions in dollars to expand their foreign businesses. As the pound slid in the 1950s and '60s and the British Empire crumbled, the corporations that prospered were the ones that borrowed pounds aggressively in order to expand abroad. Though British equities rose in pound terms, they generally underperformed gold and foreign equities. At the end of empire, the giant sucking sound was from British capital and jobs moving offshore as the pound sank.
Some weak-dollar advocates believe that American workers will eventually get cheap enough in foreign-currency terms to win manufacturing jobs back. In practice, however, capital outflows overwhelm the trade flows, causing more job losses than cheap real wages create. This was the lesson of the British malaise, the Carter malaise, the Mexican malaise of the 1990s, Yeltsin's Russian malaise through 1999 and the rest. No countries have devalued their way into prosperity, while many—Hong Kong, China, Australia today—have used stable money to invite capital and jobs.
The more the dollar devalued against the yen in the 1970s and '80s, the more Japan gained share in valued-added manufacturing, using the capital from weak-currency countries to increase productivity. China is doing the same now. It watches in chagrin as the U.S. pleads with it to strengthen the yuan, adding productivity fast with the dollars rushing its way in search of currency stability.
If stocks double but the dollar loses half its value, who beyond Wall Street are the winners and losers? There's been a clear demonstration this decade. The S&P nearly doubled from 2003 through 2007. Those who borrowed to buy won big-time. Rich people got richer, seeing their equity bottom line double. At the same time, the dollar's value was cut nearly in half versus the euro and other stable measures. Capital fled, undercutting job growth. Rent, gasoline and food prices rose more than wages.
Equity gains provide cold comfort when currencies crash. From the euro perspective, the S&P peaked at 1700 in 2000, finally reattained 1100 in the 2007 bubble, fell below 600 in March and now stands at 700 (see nearby chart). With most of the market capitalization of U.S. stocks held by Americans, the dollar devaluation has caused a massive decline in the U.S. share of global wealth.
Measured in euros (a more stable ruler than the ever-weakening dollar), U.S. real per capita GDP is down 25% since 2000, while Germany's is up 4% and tops ours.
The solution is a strong U.S. jobs and wealth program. It has to include stable money, a flatter, more competitive tax structure, spending restraint, and common-sense bank regulation so small business lending can restart. Treasury has to rapidly lengthen the maturity of the national debt and take steps to protect the Fed from market losses on its long-term debt holdings.
Instead, Washington's current economic program pushes capital away by weakening the dollar, threatening higher tax rates, borrowing short (the Fed's near trillion-dollar overnight debt, Treasury's mounds of bill and note issuance) to lend long (mortgages, student loans, entitlements), doubling down on government subsidies, and rechanneling bank loans to governments and big businesses instead of the small business job-growth engine.
It's possible global bond vigilantes will call Washington's bluff, reducing their bond purchases until we stop devaluing and restart job growth, which is the ultimate source of tax revenues to repay our bond debt. This would create a Volcker moment when the U.S. might tighten even as the economy slowed (as then Fed Chairman Paul Volcker did back in 1979).
But the accepted outlook is the almost-as-gloomy new norm. If all goes according to current plans, the dollar devalues slowly and bond buyers come back for more even as national debt heads toward $15 trillion. World living standards grow faster than ours, as does global wealth. The Fed chases inflation as the dollar sinks, but not so fast as to stop the recovery. More capital moves abroad, leaving U.S. unemployment too high too long.
A better approach would start with President Barack Obama rejecting the Bush administration's weak-dollar policy. This would invite capital and jobs to come back before interest rates have to rise.
Mr. Malpass is president of Encima Global LLC.
 Investors have been playing this weak-dollar trade for years, diverting more and more dollars into commodities, foreign currencies and foreign stock markets. This is the Third-World way of asset allocation.
Corporations play this game for bigger stakes, borrowing billions in dollars to expand their foreign businesses. As the pound slid in the 1950s and '60s and the British Empire crumbled, the corporations that prospered were the ones that borrowed pounds aggressively in order to expand abroad. Though British equities rose in pound terms, they generally underperformed gold and foreign equities. At the end of empire, the giant sucking sound was from British capital and jobs moving offshore as the pound sank.
Some weak-dollar advocates believe that American workers will eventually get cheap enough in foreign-currency terms to win manufacturing jobs back. In practice, however, capital outflows overwhelm the trade flows, causing more job losses than cheap real wages create. This was the lesson of the British malaise, the Carter malaise, the Mexican malaise of the 1990s, Yeltsin's Russian malaise through 1999 and the rest. No countries have devalued their way into prosperity, while many—Hong Kong, China, Australia today—have used stable money to invite capital and jobs.
The more the dollar devalued against the yen in the 1970s and '80s, the more Japan gained share in valued-added manufacturing, using the capital from weak-currency countries to increase productivity. China is doing the same now. It watches in chagrin as the U.S. pleads with it to strengthen the yuan, adding productivity fast with the dollars rushing its way in search of currency stability.
If stocks double but the dollar loses half its value, who beyond Wall Street are the winners and losers? There's been a clear demonstration this decade. The S&P nearly doubled from 2003 through 2007. Those who borrowed to buy won big-time. Rich people got richer, seeing their equity bottom line double. At the same time, the dollar's value was cut nearly in half versus the euro and other stable measures. Capital fled, undercutting job growth. Rent, gasoline and food prices rose more than wages.
Equity gains provide cold comfort when currencies crash. From the euro perspective, the S&P peaked at 1700 in 2000, finally reattained 1100 in the 2007 bubble, fell below 600 in March and now stands at 700 (see nearby chart). With most of the market capitalization of U.S. stocks held by Americans, the dollar devaluation has caused a massive decline in the U.S. share of global wealth.
Measured in euros (a more stable ruler than the ever-weakening dollar), U.S. real per capita GDP is down 25% since 2000, while Germany's is up 4% and tops ours.
The solution is a strong U.S. jobs and wealth program. It has to include stable money, a flatter, more competitive tax structure, spending restraint, and common-sense bank regulation so small business lending can restart. Treasury has to rapidly lengthen the maturity of the national debt and take steps to protect the Fed from market losses on its long-term debt holdings.
Instead, Washington's current economic program pushes capital away by weakening the dollar, threatening higher tax rates, borrowing short (the Fed's near trillion-dollar overnight debt, Treasury's mounds of bill and note issuance) to lend long (mortgages, student loans, entitlements), doubling down on government subsidies, and rechanneling bank loans to governments and big businesses instead of the small business job-growth engine.
It's possible global bond vigilantes will call Washington's bluff, reducing their bond purchases until we stop devaluing and restart job growth, which is the ultimate source of tax revenues to repay our bond debt. This would create a Volcker moment when the U.S. might tighten even as the economy slowed (as then Fed Chairman Paul Volcker did back in 1979).
But the accepted outlook is the almost-as-gloomy new norm. If all goes according to current plans, the dollar devalues slowly and bond buyers come back for more even as national debt heads toward $15 trillion. World living standards grow faster than ours, as does global wealth. The Fed chases inflation as the dollar sinks, but not so fast as to stop the recovery. More capital moves abroad, leaving U.S. unemployment too high too long.
A better approach would start with President Barack Obama rejecting the Bush administration's weak-dollar policy. This would invite capital and jobs to come back before interest rates have to rise.
Mr. Malpass is president of Encima Global LLC.
Investors have been playing this weak-dollar trade for years, diverting more and more dollars into commodities, foreign currencies and foreign stock markets. This is the Third-World way of asset allocation.
Corporations play this game for bigger stakes, borrowing billions in dollars to expand their foreign businesses. As the pound slid in the 1950s and '60s and the British Empire crumbled, the corporations that prospered were the ones that borrowed pounds aggressively in order to expand abroad. Though British equities rose in pound terms, they generally underperformed gold and foreign equities. At the end of empire, the giant sucking sound was from British capital and jobs moving offshore as the pound sank.
Some weak-dollar advocates believe that American workers will eventually get cheap enough in foreign-currency terms to win manufacturing jobs back. In practice, however, capital outflows overwhelm the trade flows, causing more job losses than cheap real wages create. This was the lesson of the British malaise, the Carter malaise, the Mexican malaise of the 1990s, Yeltsin's Russian malaise through 1999 and the rest. No countries have devalued their way into prosperity, while many—Hong Kong, China, Australia today—have used stable money to invite capital and jobs.
The more the dollar devalued against the yen in the 1970s and '80s, the more Japan gained share in valued-added manufacturing, using the capital from weak-currency countries to increase productivity. China is doing the same now. It watches in chagrin as the U.S. pleads with it to strengthen the yuan, adding productivity fast with the dollars rushing its way in search of currency stability.
If stocks double but the dollar loses half its value, who beyond Wall Street are the winners and losers? There's been a clear demonstration this decade. The S&P nearly doubled from 2003 through 2007. Those who borrowed to buy won big-time. Rich people got richer, seeing their equity bottom line double. At the same time, the dollar's value was cut nearly in half versus the euro and other stable measures. Capital fled, undercutting job growth. Rent, gasoline and food prices rose more than wages.
Equity gains provide cold comfort when currencies crash. From the euro perspective, the S&P peaked at 1700 in 2000, finally reattained 1100 in the 2007 bubble, fell below 600 in March and now stands at 700 (see nearby chart). With most of the market capitalization of U.S. stocks held by Americans, the dollar devaluation has caused a massive decline in the U.S. share of global wealth.
Measured in euros (a more stable ruler than the ever-weakening dollar), U.S. real per capita GDP is down 25% since 2000, while Germany's is up 4% and tops ours.
The solution is a strong U.S. jobs and wealth program. It has to include stable money, a flatter, more competitive tax structure, spending restraint, and common-sense bank regulation so small business lending can restart. Treasury has to rapidly lengthen the maturity of the national debt and take steps to protect the Fed from market losses on its long-term debt holdings.
Instead, Washington's current economic program pushes capital away by weakening the dollar, threatening higher tax rates, borrowing short (the Fed's near trillion-dollar overnight debt, Treasury's mounds of bill and note issuance) to lend long (mortgages, student loans, entitlements), doubling down on government subsidies, and rechanneling bank loans to governments and big businesses instead of the small business job-growth engine.
It's possible global bond vigilantes will call Washington's bluff, reducing their bond purchases until we stop devaluing and restart job growth, which is the ultimate source of tax revenues to repay our bond debt. This would create a Volcker moment when the U.S. might tighten even as the economy slowed (as then Fed Chairman Paul Volcker did back in 1979).
But the accepted outlook is the almost-as-gloomy new norm. If all goes according to current plans, the dollar devalues slowly and bond buyers come back for more even as national debt heads toward $15 trillion. World living standards grow faster than ours, as does global wealth. The Fed chases inflation as the dollar sinks, but not so fast as to stop the recovery. More capital moves abroad, leaving U.S. unemployment too high too long.
A better approach would start with President Barack Obama rejecting the Bush administration's weak-dollar policy. This would invite capital and jobs to come back before interest rates have to rise.
Mr. Malpass is president of Encima Global LLC.
Jobless claims - 8:30
Full report here
UNEMPLOYMENT INSURANCE WEEKLY CLAIMS REPORT
SEASONALLY ADJUSTED DATA
In the week ending Oct. 3, the advance figure for seasonally adjusted initial claims was 521,000, a decrease of 33,000 from the previous week's revised figure of 554,000. The 4-week moving average was 539,750, a decrease of 9,000 from the previous week's revised average of 548,750.
The advance seasonally adjusted insured unemployment rate was 4.5 percent for the week ending Sept. 26, a decrease of 0.1 percentage point from the prior week's unrevised rate of 4.6 percent.
The advance number for seasonally adjusted insured unemployment during the week ending Sept. 26 was 6,040,000, a decrease of 72,000 from the preceding week's revised level of 6,112,000. The 4-week moving average was 6,144,250, a decrease of 15,750 from the preceding week's revised average of 6,160,000.
The fiscal year-to-date average for seasonally adjusted insured unemployment for all programs is 5.677 million.
UNADJUSTED DATA
The advance number of actual initial claims under state programs, unadjusted, totaled 449,375 in the week ending Oct. 3, an increase of 3,757 from the previous week. There were 426,789 initial claims in the comparable week in 2008.
The advance unadjusted insured unemployment rate was 3.8 percent during the week ending Sept. 26, unchanged from the prior week. The advance unadjusted number for persons claiming UI benefits in state programs totaled 4,994,971, a decrease of 77,884 from the preceding week. A year earlier, the rate was 2.3 percent and the volume was 3,057,698.
Extended benefits were available in Alabama, Alaska, Arizona, Arkansas, California, Colorado, Connecticut, Delaware, the District of Columbia, Florida, Georgia, Idaho, Illinois, Indiana, Kansas, Kentucky, Maine, Massachusetts, Michigan, Minnesota, Missouri, Nevada, New Hampshire, New Jersey, New Mexico, New York, North Carolina, Ohio, Oregon, Pennsylvania, Puerto Rico, Rhode Island, South Carolina, Tennessee, Texas, Vermont, Virginia, Washington, West Virginia, and Wisconsin during the week ending Sept. 19.
Initial claims for UI benefits by former Federal civilian employees totaled 1,499 in the week ending Sept. 26, an increase of 44 from the prior week. There were 2,387 initial claims by newly discharged veterans, an increase of 91 from the preceding week.
There were 19,523 former Federal civilian employees claiming UI benefits for the week ending Sept. 19, a decrease of 885 from the previous week. Newly discharged veterans claiming benefits totaled 30,550, a decrease of 139 from the prior week.
States reported 3,321,210 persons claiming EUC (Emergency Unemployment Compensation) benefits for the week ending Sept. 19, an increase of 45,997 from the prior week. There were 1,140,558 claimants in the comparable week in 2008. EUC weekly claims include both first and second tier activity.
The highest insured unemployment rates in the week ending Sept. 19 were in Puerto Rico (6.1 percent), Oregon (5.3), Nevada (5.2), Pennsylvania (5.0), California (4.9), Michigan (4.8), Wisconsin (4.7), Arkansas (4.6), North Carolina (4.6), and South Carolina (4.5).
The largest increases in initial claims for the week ending Sept. 26 were in California (+4,467), Ohio (+3,421), Illinois (+1,815), Missouri (+1,049), and Tennessee (+1,048), while the largest decreases were in New York (-2,253), North Carolina (-1,609), South Carolina (-1,159), Arkansas (-818), and Florida
(-734).
More at link with formatted tables
Pre-market - Thursday, October 8, 2009
Futures up big after Alcoa reported last night. More to come today.
DJIA INDEX 9,750.00 77.00
S&P 500 1,063.00 9.40
NASDAQ 100 1,720.75 12.75
Today's economic calendar:
BOE Announcement 7:00 AM ET
ECB Announcement 7:45 AM ET
Jobless Claims 8:30 AM ET
RBC CASH Index 9:00 AM ET
Wholesale Trade 10:00 AM ET
EIA Natural Gas Report 10:30 AM ET
3-Month Bill Announcement 11:00 AM ET
6-Month Bill Announcement 11:00 AM ET
30-Yr Bond Auction 1:00 PM ET
Today's earnings reports:
Before market opens:
ISCA International Speedway Corp. Services Sporting Activities
MAR Marriott International, Inc. Services Lodging
PEP Pepsico, Inc. Consumer Goods Processed & Packaged Goods
PGR Progressive Corp. Financial Property & Casualty Insurance
After close:
CAMP CalAmp Corp. Technology Communication Equipment
INFY Infosys Technologies Limited Technology Technical & System Software
NUHC Nu Horizons Electronics Corp. Services Electronics Wholesale
PCBK Pacific Continental Corp. Financial Regional - Pacific Banks
TSCM TheStreet.com, Inc. Technology Internet Information Providers
Wednesday, October 7, 2009
Pre-market - Wednesday, October 7,2009
Futures up slightly this morning
DJIA INDEX 9,664.00 10.00
S&P 500 1,049.50 0.90
NASDAQ 100 1,702.75 2.00
Today's economic calendar:
MBA Purchase Applications 7:00 AM ET
EIA Petroleum Status Report 10:30 AM ET
10-Yr Note Auction 1:00 PM ET
Consumer Credit 3:00 PM E
Today's earnings reports:
Before open:
AYI Acuity Brands, Inc. Consumer Goods Home Furnishings & Fixtures
COST Costco Wholesale Corporation Services Discount, Variety Stores
FDO Family Dollar Stores Inc. Services Discount, Variety Stores
HELE Helen of Troy Limited Consumer Goods Appliances
LNN Lindsay Corporation Industrial Goods Farm & Construction Machinery
MERX Merix Corp. Technology Printed Circuit Boards
MON Monsanto Co. Basic Materials Agricultural Chemicals
WWW Wolverine World Wide Inc. Consumer Goods Textile - Apparel Footwear & Accessories
After close:
AA Alcoa, Inc. Basic Materials Aluminum
KED Kayne Anderson Energy Development Company Financial Closed-End Fund - Equity
PRXI Premier Exhibitions Inc. Services General Entertainment
RELL Richardson Electronics Ltd. Services Electronics Wholesale
RT Ruby Tuesday, Inc. Services Restaurants
Tuesday, October 6, 2009
Market wrap - 4:30
Dow 9,731 132 1.37%
Nasdaq 2,104 35 1.71%
S&P 500 1,055 14 1.37%
Gold 1,040 +22 +2.15%
Oil 71.04 0.47 0.67%
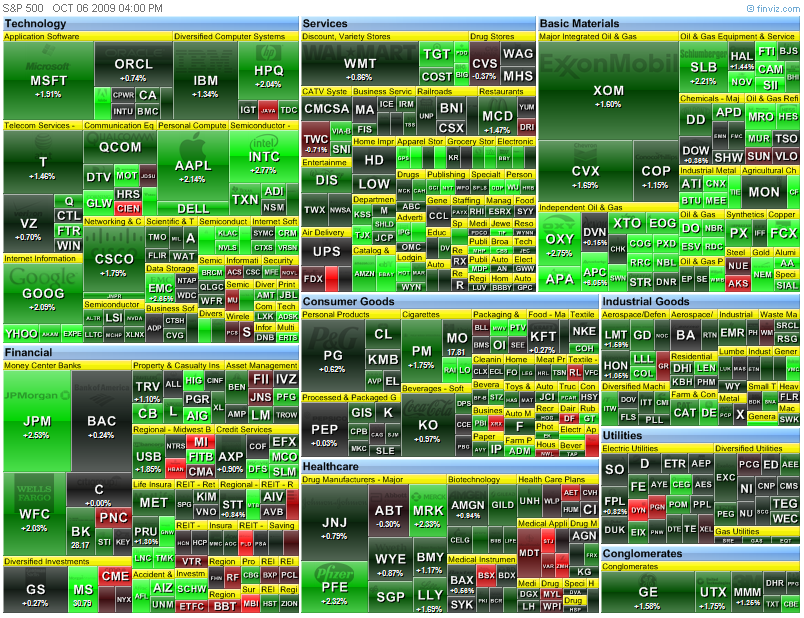
Today by sector:
Today's heatmap:
 Today's heatmap:

 Today's heatmap:
Pre-market - Tuesday, October 6, 2009
Futures up pretty big this morning
DJIA INDEX 9,620.00 74.00
S&P 500 1,046.70 10.30
NASDAQ 100 1,688.00 14.00
Today's economic calendar:
ICSC-Goldman Store Sales 7:45 AM ET
Redbook 8:55 AM ET
4-Week Bill Auction 11:30 AM ET
3-Yr Note Auction 1:00 PM ET
Treasury STRIPS 3:00 PM ET
Today's earnings reports:
Before market opens:
CHTT Chattem Inc. Consumer Goods Personal Products
GIGM GigaMedia Ltd. Technology Internet Software & Services
PBG Pepsi Bottling Group Inc. Consumer Goods Beverages - Soft Drinks
After market closes:
ANGO AngioDynamics Inc. Healthcare Medical Instruments & Supplies
YUM Yum! Brands, Inc. Services Restaurants
Monday, October 5, 2009
Market wrap - 6:00
Dow 9,600 112 1.18%
Nasdaq 2,068 20 0.98%
S&P 500 1,040 15 1.49%
Gold 1,018 +14 +1.34%
Oil 70.25 0.46 0.66%
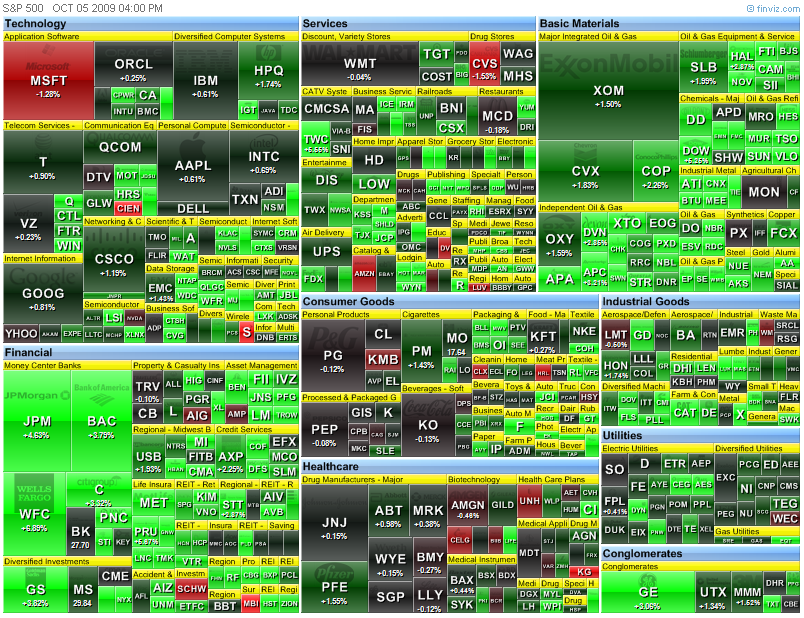
Today by sector:


ISM non-mfg index report - 10:00
Full report here
September 2009 Non-Manufacturing ISM Report On Business®
NMI (Non-Manufacturing Index) at 50.9%
DO NOT CONFUSE THIS NATIONAL REPORT with the various regional purchasing reports released across the country. The national report's information reflects the entire United States, while the regional reports contain primarily regional data from their local vicinities. Also, the information in the regional reports is not used in calculating the results of the national report. The information compiled in this report is for the month of September 2009.
Business Activity Index at 55.1%
New Orders Index at 54.2%
Employment Index at 44.3%
More at link with formatted tables.
Pre-market - Monday, October 5,2009
Futures up this morning after a week won by the Bears:
DJIA INDEX 9,472.00 37.00
S&P 500 1,027.00 5.30
NASDAQ 100 1,672.00 9.75
Today's economic calendar:
ISM Non-Mfg Index 10:00 AM ET
4-Week Bill Announcement 11:00 AM ET
3-Month Bill Auction 11:30 AM ET
6-Month Bill Auction 11:30 AM ET
10-Yr TIPS Auction 1:00 PM ET
Today's earnings reports:
Before open:
RPM
After close:
MOS Mosaic Co. Basic Materials Agricultural Chemicals
PEDH Peoples Educational Holdings, Inc. Services Publishing - Books
RBN Robbins & Myers Inc. Industrial Goods Diversified Machinery
TISI Team Inc. Services Business Services
Friday, October 2, 2009
Op Ed piece from Meredith Whitney - 11:00
Link to WSJ article
The Credit Crunch Continues
Taxpayer dollars have supported institutions that are 'too big to fail.' Small business has been left out in the cold.
By MEREDITH WHITNEY
Anyone counting on a meaningful economic recovery will be greatly disappointed. How do I know? I follow credit, and credit is contracting. Access to credit is being denied at an accelerating pace. Large, well-capitalized companies have no problem finding credit. Small businesses, on the other hand, have never had a harder time getting a loan.
Since the onset of the credit crisis over two years ago, available credit to small businesses and consumers has contracted by trillions of dollars, and that phenomenon is reflected in dismal consumer spending trends. Equally worrisome are the trends in small-business credit, which has contracted at one of the fastest paces of any lending category. Small business loans are hard to find, and credit-card lines (a critical funding source to small businesses) have been cut by 25% since last year.
Unfortunately for small businesses, credit-line cuts are only about half way through. Home equity loans, also historically a key funding source for start-up small businesses, are not a source of liquidity anymore because more than 32% of U.S. homes are worth less than their mortgages.
Why do small businesses matter so much? In the U.S., small businesses employ 50% of the country's workforce and contribute 38% of GDP. Without access to credit, small businesses can't grow, can't hire, and too often end up going out of business. What's more, small businesses are often the primary source of this country's innovation. Apple, Dell, McDonald's, Starbucks were all started as small businesses.
What's especially disturbing is how taxpayer dollars have supported "too big to fail" businesses yet left small businesses unassisted and at a significant disadvantage. Small businesses do not have the same access to government guarantees on their debt. After all, most of these small businesses don't issue public debt.
As is true in most recessions, banks' commercial lending portfolios shrink as creditworthy customers pay down their debts and the less-worthy borrowers are simply denied loans. Banks, in other words, want to lend only to those that don't want to borrow. Challenging as that may be, in the last cycle small businesses at least had access to their credit cards.
Small businesses primarily fund themselves through credit cards and loans from local lenders. In the past two years, credit-card lines have been cut by over $1.25 trillion. During the same time, 10% of all credit-card accounts have been cancelled. According to the most recent Federal Reserve data, small business lending is down 3%, or $113 billion, from fourth-quarter 2008 peak levels—the first contraction since 1993. Credit cards are the most common source of liquidity to small businesses, used by 82% as a vital portion of their overall funding. Thus, it is of merit when 79% of small businesses surveyed tell the Small Business Association that credit-card lending standards have tightened drastically and their access to credit lines has decreased materially.
Incentives should be provided to smaller banks to step up small-business loans on a greater scale. Smaller banks could not only bridge gaps created by the shut down in the securitization market but also gaps being created by a massive contraction in credit-card lines. Arguably credit would perform better with these types of loans as they would reintroduce and reinforce the most important rule in banking: "Know Your Customer."
I believe that we are only in the early stages of the second half of this credit cycle. I expect another $1.5 trillion of credit-card lines to be removed from the system by the end of 2010. This includes not only the large lenders reducing exposure but also the shuttering of several major subprime credit-card lenders. Beginning in the fourth quarter of 2007, lenders began reducing available credit by zip code. During the past four quarters, lenders have cut "inactive" accounts (whether or not the customer viewed the account as a liquidity vehicle).
The next phase will likely be credit-line cuts as lenders race to pre-emptively protect themselves from regulatory changes associated with the Credit Card Accountability, Responsibility and Disclosure Act, passed in May of this year, and the 2008 Unfair and Deceptive Acts and Practices Act.
Regulators should be mindful that regulatory change during the midst of a credit crisis often ends with unintended consequences. Those same consumers that regulators are trying to help are actually being hurt by a vast reduction in available credit.
Main Street represents the foundation of this country. Reviving it should take priority over any regulatory reform or systemic overhaul.
Ms. Whitney is CEO of Meredith Whitney Advisory Group, LLC.
Factory orders - 10:00am
Full report here
August 2009 --------------- Released 10:00 A.M. EDT October 2, 2009
(M3-2(09)-08)
Note: All figures in text are in seasonally adjusted current dollars
For Data - (301) 763-4673
For Questions - Chris Savage or Jessica Young
(301) 763-4832
Summary
New orders for manufactured goods in August, down following four consecutive monthly increases, decreased $2.8 billion or 0.8 percent to $352.9 billion, the U.S. Census Bureau reported today. This followed a 1.4 percent July increase. Excluding transportation, new orders increased 0.4 percent. Shipments, down following two consecutive monthly increases, decreased $0.9 billion or 0.3 percent to $360.0 billion. This followed a 0.3 percent July increase. Unfilled orders, down eleven consecutive months, decreased $3.1 billion or 0.4 percent to $736.8 billion. This was the longest streak of consecutive monthly decreases since the series was first published on a NAICS basis in 1992. This followed a 0.1 percent July decrease. The unfilled orders-to-shipments ratio was 5.98, up from 5.94 in July. Inventories, down twelve consecutive months, decreased $3.9 billion or 0.8 percent to $498.2 billion. This was the longest streak of consecutive monthly decreases since February 2001-May 2002 and followed a 0.9 percent July decrease. The inventories-to-shipments ratio was 1.38, down from 1.39 in July.
New Orders
New orders for manufactured durable goods in August, down two of the last three months, decreased $4.4 billion or 2.6 percent to $164.1 billion, revised from the previously published 2.4 percent decrease. This followed a 4.8 percent July increase.
New orders for manufactured nondurable goods increased $1.5 billion or 0.8 percent to $188.7 billion.
Shipments
Shipments of manufactured durable goods in August, down following two consecutive monthly increases, decreased $2.4 billion or 1.4 percent to $171.3 billion, unchanged from the previously published decrease. This followed a 2.3 percent July increase.
Shipments of manufactured nondurable goods, up three of the last four months, increased $1.5 billion or 0.8 percent to $188.7 billion. This followed a 1.5 percent July decrease. This increase was due to petroleum and coal products, which increased $1.9 billion or 5.4 percent to $36.7 billion.
Unfilled Orders
Unfilled orders for manufactured durable goods in August, down eleven consecutive months, decreased $3.1 billion or 0.4 percent to $736.8 billion, unchanged from the previously published decrease. This was the longest streak of consecutive monthly decreases since the series was first published on a NAICS basis in 1992 and followed a 0.1 percent July decrease.
Inventories
Inventories of manufactured durable goods in August, down eight consecutive months, decreased $4.5 billion or 1.4 percent to $308.4 billion, revised from the previously published 1.3 percent decrease. This followed a 1.2 percent July decrease.
Inventories of manufactured nondurable goods, up following eleven consecutive monthly decreases, increased $0.6 billion or 0.3 percent to $189.9 billion. This followed a 0.4 percent July decrease. Petroleum and coal products drove the increase, up $0.7 billion or 2.8 percent to $27.4 billion.
By stage of fabrication, August materials and supplies decreased 0.8 percent in durable goods and 0.1 percent in nondurable goods. Work in process decreased 2.3 percent in durable goods and increased 1.4 percent in nondurable goods. Finished goods decreased 1.0 percent in durable goods and increased 0.1 percent in nondurable goods.
Employment report - 8:30am
Opps!
Full report here
THE EMPLOYMENT SITUATION -- SEPTEMBER 2009
Nonfarm payroll employment continued to decline in September (-263,000), and
the unemployment rate (9.8 percent) continued to trend up, the U.S. Bureau of
Labor Statistics reported today. The largest job losses were in construction,
manufacturing, retail trade, and government.
Household Survey Data
Since the start of the recession in December 2007, the number of unemployed
persons has increased by 7.6 million to 15.1 million, and the unemployment
rate has doubled to 9.8 percent. (See table A-1.)
Unemployment rates for the major worker groups--adult men (10.3 percent),
adult women (7.8 percent), teenagers (25.9 percent), whites (9.0 percent),
blacks (15.4 percent), and Hispanics (12.7 percent)--showed little change
in September. The unemployment rate for Asians was 7.4 percent, not season-
ally adjusted. The rates for all major worker groups are much higher than
at the start of the recession. (See tables A-1, A-2, and A-3.)
Among the unemployed, the number of job losers and persons who completed
temporary jobs rose by 603,000 to 10.4 million in September. The number of
long-term unemployed (those jobless for 27 weeks and over) rose by 450,000
to 5.4 million. In September, 35.6 percent of unemployed persons were job-
less for 27 weeks or more. (See tables A-8 and A-9.)
The civilian labor force participation rate declined by 0.3 percentage point
in September to 65.2 percent. The employment-population ratio, at 58.8 per-
cent, also declined over the month and has decreased by 3.9 percentage points
since the recession began in December 2007. (See table A-1.)
In September, the number of persons working part time for economic reasons
(sometimes referred to as involuntary part-time workers) was little changed
at 9.2 million. The number of such workers rose sharply throughout most of
the fall and winter but has been little changed since March. (See table A-5.)
About 2.2 million persons were marginally attached to the labor force in
September, an increase of 615,000 from a year earlier. (The data are not sea-
sonally adjusted.) These individuals were not in the labor force, wanted and
were available for work, and had looked for a job sometime in the prior 12
months. They were not counted as unemployed because they had not searched for
work in the 4 weeks preceding the survey. (See table A-13.)
Among the marginally attached, there were 706,000 discouraged workers in
September, up by 239,000 from a year earlier. (The data are not seasonally
adjusted.) Discouraged workers are persons not currently looking for work
because they believe no jobs are available for them. The other 1.5 million
persons marginally attached to the labor force in September had not searched
for work in the 4 weeks preceding the survey for reasons such as school
attendance or family responsibilities.
Establishment Survey Data
Total nonfarm payroll employment declined by 263,000 in September. From May
through September, job losses averaged 307,000 per month, compared with los-
ses averaging 645,000 per month from November 2008 to April. Since the start
of the recession in December 2007, payroll employment has fallen by 7.2 mil-
lion. (See table B-1.)
In September, construction employment declined by 64,000. Monthly job los-
ses averaged 66,000 from May through September, compared with an average of
117,000 per month from November to April. September job cuts were concen-
trated in the industry's nonresidential components (-39,000) and in heavy
construction (-12,000). Since December 2007, employment in construction has
fallen by 1.5 million.
Employment in manufacturing fell by 51,000 in September. Over the past 3
months, job losses have averaged 53,000 per month, compared with an average
monthly loss of 161,000 from October to June. Employment in manufacturing
has contracted by 2.1 million since the onset of the recession.
In the service-providing sector, the number of jobs in retail trade fell by
39,000 in September. From April through September, retail employment has
fallen by an average of 29,000 per month, compared with an average monthly
loss of 68,000 for the prior 6-month period.
Government employment was down by 53,000 in September, with the largest
decline occurring in the non-education component of local government
(-24,000).
Employment in health care continued to increase in September (19,000), with
the largest gain occurring in ambulatory health care services (15,000).
Health care has added 559,000 jobs since the beginning of the recession,
although the average monthly job gain thus far in 2009 (22,000) is down from
the average monthly gain during 2008 (30,000).
Employment in transportation and warehousing continued to trend down in
September. The number of jobs in financial activities, professional and
business services, leisure and hospitality, and information showed little
or no change over the month.
In September, the average workweek for production and nonsupervisory workers
on private nonfarm payrolls edged down by 0.1 hour to 33.0 hours. Both the
manufacturing workweek and factory overtime decreased by 0.1 hour over the
month, to 39.8 and 2.8 hours, respectively. (See table B-2.)
In September, average hourly earnings of production and nonsupervisory
workers on private nonfarm payrolls edged up by 1 cent, or 0.1 percent, to
$18.67. Over the past 12 months, average hourly earnings have risen by 2.5
percent, while average weekly earnings have risen by only 0.7 percent due
to declines in the average workweek. (See table B-3.)
The change in total nonfarm payroll employment for July was revised from
-276,000 to -304,000, and the change for August was revised from -216,000
to -201,000.
More at link with formatted tables
Pre-market - Friday, October 2, 2009
Futures down this morning waiting on the jobs report at 8:30
DJIA INDEX 9,439.00 -32.00
S&P 500 1,024.50 -2.90
NASDAQ 100 1,665.50 -5.00
Today's economic calendar:
Employment Situation 8:30 AM ET
Factory Orders 10:00 AM ET
Today's earnings reports:
NONE
Thursday, October 1, 2009
Market wrap - 4:30
Wow! Do I see Bears eating green shoots? They did today.
Dow 9,509 -203 -2.09%
Nasdaq 2,057 -65 -3.06%
S&P 500 1,030 -27 -2.58%
GlobalDow 1,855 -40 -2.09%
Gold 1,001 -9 -0.85%
Oil 70.32 0.21 0.30%
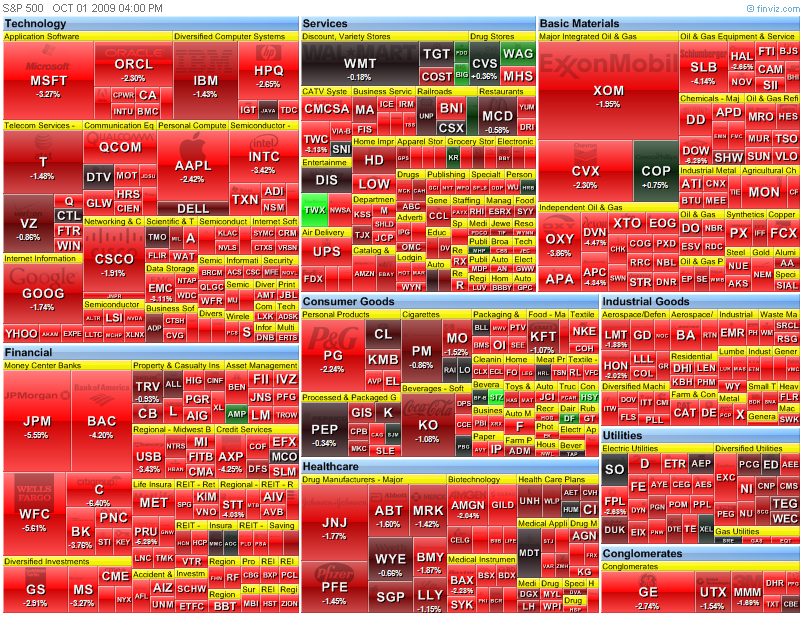
Today by sector:
 Today's heatmap:

 Today's heatmap:
New home sales index report - 10:00am
Full report here
Washington, October 01, 2009
Pending home sales have increased for seven straight months, the longest in the series of the index which began in 2001, according to the National Association of Realtors®.
The Pending Home Sales Index,* a forward-looking indicator based on contracts signed in August, rose 6.4 percent to 103.8 from a reading of 97.6 in July, and is 12.4 percent above August 2008 when it was 92.4. The index is at the highest level since March 2007 when it was 104.5.
Lawrence Yun, NAR chief economist, said not all contracts are turning into closed sales within an expected timeframe. “The rise in pending home sales shows buyers are returning to the market and signing contracts, but deals are not necessarily closing because of long delays related to short sales, and issues regarding complex new appraisal rules,” he said. “No doubt many first-time buyers are rushing to beat the deadline for the $8,000 tax credit, which expires at the end of next month.”
The Pending Home Sales Index in the Northeast jumped 8.2 percent to 85.3 in August and is 12.0 percent higher than August 2008. In the Midwest the index rose 3.1 percent to 90.8 in August and is 7.6 percent above a year ago. In the South, pending home sales increased 0.8 percent to an index of 104.6 and is 8.2 percent above August 2008. In the West the index surged 16.0 percent to 130.5 and is 22.3 percent above a year ago.
“There is likely to be some double counting over a span of several months because some buyers whose contracts were cancelled have found another home and signed a new contract to buy,” Yun explained. “Perhaps the real question is how many transactions are being delayed in the pipeline, and how many are being cancelled? Without historic precedents, it’s challenging to assess.”
Yun also noted that the data sample coverage for pending sales is smaller than the measurement for closed existing-home sales, so the two series will never match one for one.
NAR President Charles McMillan, a broker with Coldwell Banker Residential Brokerage in Dallas-Fort Worth, said first-time buyers need to act now. “Potential first-time buyers must make a contract offer very soon to have a reasonable chance of qualifying for the tax credit,” he said. “Congress needs to extend and expand this program because it’s stimulating the economy and reducing inventory close to price stabilization points.”
McMillan said a sizable number of homebuyers already in the pipeline could be let down because of the tight deadline. “We know there is a pent-up demand because sales are below normal levels for the size of our population. The faster we absorb excess inventory, the sooner we’ll turn the corner on home prices, prevent additional families from becoming upside-down in their mortgages, and give Wall Street the confidence to extend credit to other sectors,” he said. “Each home sale pumps an additional $63,000 into the economy through related goods and services, so the benefits of extending and expanding the tax credit far outweigh the costs.”
Yun said the forecast for home sales and prices depends very much on whether a tax credit is extended. “All we can say for certain is sales will decline when the tax credit expires because we are not yet on a self-sustaining recovery path. It also raises a risk of a double-dip recession,” he said. “Extending and expanding the tax credit is the best tool in our arsenal to encourage financially qualified buyers to stimulate the economy and help reduce the budget deficit.”
The National Association of Realtors®, “The Voice for Real Estate,” is America’s largest trade association, representing 1.2 million members involved in all aspects of the residential and commercial real estate industries.
Construction spending - 10:00am
Full report here
AUGUST 2009 CONSTRUCTION AT $941.9 BILLION ANNUAL RATE
The U.S. Census Bureau of the Department of Commerce announced today that construction spending during August 2009 was estimated at a seasonally adjusted annual rate of $941.9 billion, 0.8 percent (±1.8%)* above the revised July
estimate of $934.6 billion. The August figure is 11.6 percent (±1.8%) below the August 2008 estimate of $1,066.1 billion. During the first 8 months of this year, construction spending amounted to $629.5 billion, 11.9 percent (±1.3%) below the $714.3 billion for the same period in 2008.
PRIVATE CONSTRUCTION
Spending on private construction was at a seasonally adjusted annual rate of $622.1 billion, 1.8 percent (±1.1%) above the revised July estimate of $611.1 billion. Residential construction was at a seasonally adjusted annual rate of $249.5 billion
in August, 4.7 percent (±1.3%) above the revised July estimate of $238.3 billion. Nonresidential construction was at a seasonally adjusted annual rate of $372.6 billion in August, 0.1 percent (±1.1%)* below the revised July estimate of $372.8 billion.
PUBLIC CONSTRUCTION
In August, the estimated seasonally adjusted annual rate of public construction spending was $319.8 billion, 1.1 percent (±2.7%)* below the revised July estimate of $323.5 billion. Educational construction was at a seasonally adjusted annual
rate of $89.2 billion, nearly the same as (±4.2%)* the revised July estimate of $89.3 billion. Highway construction was at a seasonally adjusted annual rate of $85.2 billion, 0.8 percent (±7.5%)* above the revised July estimate of $84.5 billion.
More at link.
ISM report - 10:00am
Full report here
September 2009 Manufacturing ISM Report On Business®
PMI at 52.6%
DO NOT CONFUSE THIS NATIONAL REPORT with the various regional purchasing reports released across the country. The national report's information reflects the entire United States, while the regional reports contain primarily regional data from their local vicinities. Also, the information in the regional reports is not used in calculating the results of the national report. The information compiled in this report is for the month of September 2009.
New Orders and Production Growing
Employment and Inventories Contracting
Supplier Deliveries Slower
(Tempe, Arizona) — Economic activity in the manufacturing sector expanded in September for the second consecutive month, and the overall economy grew for the fifth consecutive month, say the nation's supply executives in the latest Manufacturing ISM Report On Business®.
The report was issued today by Norbert J. Ore, CPSM, C.P.M., chair of the Institute for Supply Management™ Manufacturing Business Survey Committee. "The manufacturing sector grew for the second consecutive month in September. While the rate of growth moderated slightly when compared to August, the recovery broadened as the number of industries reporting growth increased from 11 to 13. Both new orders and production are growing, but at a slower rate when compared to August. It appears the fundamentals for continuing recovery are still at work as inventories and sales are gaining balance. This month, we asked a special question with regard to the American Recovery and Reinvestment Act. Twelve of the 18 manufacturing industries expect to derive some benefit from the program, and 12 manufacturing industries responded that they expect their companies to see some benefit."
PERFORMANCE BY INDUSTRY
In September, 13 of the 18 manufacturing industries reported growth. The industries — listed in order — are: Wood Products; Paper Products; Apparel, Leather & Allied Products; Transportation Equipment; Textile Mills; Printing & Related Support Activities; Petroleum & Coal Products; Electrical Equipment, Appliances & Components; Fabricated Metal Products; Chemical Products; Computer & Electronic Products; Miscellaneous Manufacturing; and Food, Beverage & Tobacco Products. The four industries reporting contraction in September are: Primary Metals; Furniture & Related Products; Plastics & Rubber Products; and Machinery.
WHAT RESPONDENTS ARE SAYING ...
* "Purchasing remains a challenge as suppliers now seem to be trying to raise pricing at any sign of life in the economy." (Computer & Electronic Products)
* "Business is picking up — lots of opportunities." (Primary Metals)
* "Agricultural commodities continue to weaken, with the exception of the domestic and world sugar markets." (Food, Beverage & Tobacco Products)
* "Automotive demand continues to be strong even after 'cash for clunkers.'" (Fabricated Metal Products)
* "Business remains slow, with no sign of improvement again this month." (Nonmetallic Mineral Products)
More at link
Jobless claims - 8:30am
Opps! But good news, not as bad as expected. CNBC giddy over the numbers.
Full report here
UNEMPLOYMENT INSURANCE WEEKLY CLAIMS REPORT
SEASONALLY ADJUSTED DATA
In the week ending Sept. 26, the advance figure for seasonally adjusted initial claims was 551,000, an increase of 17,000 from the previous week's revised figure of 534,000. The 4-week moving average was 548,000, a decrease of 6,250 from the previous week's revised average of 554,250.
The advance seasonally adjusted insured unemployment rate was 4.6 percent for the week ending Sept. 19, unchanged from the prior week's unrevised rate of 4.6 percent.
The advance number for seasonally adjusted insured unemployment during the week ending Sept. 19 was 6,090,000, a decrease of 70,000 from the preceding week's revised level of 6,160,000. The 4-week moving average was 6,154,500, a decrease of 39,250 from the preceding week's revised average of 6,193,750.
The fiscal year-to-date average for seasonally adjusted insured unemployment for all programs is 5.665 million.
UNADJUSTED DATA
The advance number of actual initial claims under state programs, unadjusted, totaled 443,694 in the week ending Sept. 26, an increase of 5,878 from the previous week. There were 392,515 initial claims in the comparable week in 2008.
The advance unadjusted insured unemployment rate was 3.8 percent during the week ending Sept. 19, a decrease of 0.1 percentage point from the prior week. The advance unadjusted number for persons claiming UI benefits in state programs totaled 5,054,617, a decrease of 169,287 from the preceding week. A year earlier, the rate was 2.3 percent and the volume was 3,018,976.
Extended benefits were available in Alabama, Alaska, Arizona, Arkansas, California, Colorado, Connecticut, Delaware, the District of Columbia, Florida, Georgia, Idaho, Illinois, Indiana, Kansas, Kentucky, Maine, Massachusetts, Michigan, Minnesota, Missouri, Nevada, New Hampshire, New Jersey, New Mexico, New York, North Carolina, Ohio, Oregon, Pennsylvania, Puerto Rico, Rhode Island, South Carolina, Tennessee, Texas, Vermont, Virginia, Washington, West Virginia, and Wisconsin during the week ending Sept. 12.
Initial claims for UI benefits by former Federal civilian employees totaled 1,455 in the week ending Sept. 19, an increase of 323 from the prior week. There were 2,296 initial claims by newly discharged veterans, an increase of 367 from the preceding week.
There were 20,408 former Federal civilian employees claiming UI benefits for the week ending Sept. 12, an increase of 1,202 from the previous week. Newly discharged veterans claiming benefits totaled 30,689, an increase of 457 from the prior week.
States reported 3,275,213 persons claiming EUC (Emergency Unemployment Compensation) benefits for the week ending Sept. 12, an increase of 99,832 from the prior week. There were 1,559,198 claimants in the comparable week in 2008. EUC weekly claims include both first and second tier activity.
The highest insured unemployment rates in the week ending Sept. 12 were in Puerto Rico (6.1 percent), Oregon (5.4), Nevada (5.3), Pennsylvania (5.3), California (4.9), Michigan (4.9), Wisconsin (4.8), New Jersey (4.7), North Carolina (4.7), Arkansas (4.6), and South Carolina (4.6).
The largest increases in initial claims for the week ending Sept. 19 were in California (+5,112), Texas (+3,946), Florida (+2,348), Iowa (+2,013), and Illinois (+1,945), while the largest decreases were in Kansas (-1,545), Wisconsin (-1,258), Oregon (-833), Ohio (-804), and New York (-623).
More at link with formatted tables
Futures down this morning waiting on economic data.
DJIA INDEX 9,609.00 -44.00
S&P 500 1,046.50 -6.40
NASDAQ 100 1,706.75 -10.75
Today's economic reports:
Monster Employment Index
Motor Vehicle Sales
Challenger Job-Cut Report 7:30 AM ET
Personal Income and Outlays 8:30 AM ET
Jobless Claims 8:30 AM ET
Ben Bernanke Speaks 9:00 AM ET
30-Yr Bond Announcement 9:00 AM ET
ISM Mfg Index 10:00 AM ET
Construction Spending 10:00 AM ET
Pending Home Sales Index 10:00 AM ET
EIA Natural Gas Report 10:30 AM ET
3-Month Bill Announcement 11:00 AM ET
6-Month Bill Announcement 11:00 AM ET
3-Yr Note Announcement 11:00 AM ET
10-Yr Note Announcement 11:00 AM ET
10-Yr TIPS Announcement 11:00 AM ET
Today's earnings reports:
Before open:
CRAI CRA International Inc. Services Management Services
MTRX Matrix Service Co. Industrial Goods Heavy Construction
STZ Constellation Brands Inc. Consumer Goods Beverages - Wineries & Distillers
After close:
ACN Accenture plc Services Management Services
BLUD Immucor Inc. Healthcare Diagnostic Substances
CREL Corel Corporation Technology Multimedia & Graphics Software
DMAN DemandTec, Inc. Technology Business Software & Services
GPN Global Payments Inc. Services Business Services
RECN Resources Connection Inc. Services Management Services
SMOD SMART Modular Technologies (WWH) Inc. Technology Semiconductor - Integrated Circuits
SMSC Standard Microsystems Corp. Technology Semiconductor - Integrated Circuits
TSCM TheStreet.com, Inc. Technology Internet Information Providers
Wednesday, September 30, 2009
GDP - 8:30am
Full report here
GROSS DOMESTIC PRODUCT: SECOND QUARTER 2009 (THIRD ESTIMATE)
CORPORATE PROFITS: SECOND QUARTER 2009 (REVISED ESTIMATE)
Real gross domestic product -- the output of goods and services produced by labor and property located in the United States -- decreased at an annual rate of 0.7 percent in the second quarter of 2009, (that is, from the first quarter to the second quarter), according to the "third" estimate released by the Bureau of Economic Analysis. In the first quarter, real GDP decreased 6.4 percent.
The GDP estimate released today is based on more complete source data than were available for the "second" estimate issued last month. In the second estimate, the decrease in real GDP was 1.0 percent (see "Revisions" on page 3).
The decrease in real GDP in the second quarter primarily reflected negative contributions from private inventory investment, nonresidential fixed investment, residential fixed investment, personal consumption expenditures (PCE), and exports that were partly offset by positive contributions from federal government spending and state and local government spending. Imports, which are a subtraction
in the calculation of GDP, decreased.
The much smaller decrease in real GDP in the second quarter than in the first primarily reflected much smaller decreases in nonresidential fixed investment and in exports, an upturn in federal government spending, a smaller decrease in private inventory investment, an upturn in state and local government spending, and a smaller decrease in residential fixed investment that were partly offset by a
much smaller decrease in imports and a downturn in PCE.
_________________________________________________
FOOTNOTE.--Quarterly estimates are expressed at seasonally adjusted annual rates, unless otherwise specified. Quarter-to-quarter dollar changes are differences between these published estimates. Percent changes are calculated from unrounded data and are annualized. “Real” estimates are in chained (2005) dollars. Price indexes are chain-type measures.
This news release is available on BEA’s Web site along with the Technical Note and Highlights related to this release.
_________________________________________________
Motor vehicle output added 0.19 percentage point to the second-quarter change in real GDP after subtracting 1.69 percentage points from the first-quarter change. Final sales of computers subtracted 0.04 percentage point from the second-quarter change in real GDP after adding 0.06 percentage point to the first-quarter change.
The price index for gross domestic purchases, which measures prices paid by U.S. residents, increased 0.5 percent in the second quarter, the same increase as in the second estimate; this index decreased 1.4 percent in the first quarter. Excluding food and energy prices, the price index for gross domestic purchases increased 0.8 percent in the second quarter, compared with an increase of 0.2
percent in the first.
Real personal consumption expenditures decreased 0.9 percent in the second quarter, in contrast to an increase of 0.6 percent in the first. Real nonresidential fixed investment decreased 9.6 percent, compared with a decrease of 39.2 percent. Nonresidential structures decreased 17.3 percent, compared with a decrease of 43.6 percent. Equipment and software decreased 4.9 percent, compared with a decrease of 36.4 percent. Real residential fixed investment decreased 23.3 percent, compared with a decrease of 38.2 percent.
Real exports of goods and services decreased 4.1 percent in the second quarter, compared with a decrease of 29.9 percent in the first. Real imports of goods and services decreased 14.7 percent, compared with a decrease of 36.4 percent.
Real federal government consumption expenditures and gross investment increased 11.4 percent in the second quarter, in contrast to a decrease of 4.3 percent in the first. National defense increased 14.0 percent, in contrast to a decrease of 5.1 percent. Nondefense increased 6.1 percent, in contrast to a decrease of 2.5 percent. Real state and local government consumption expenditures and gross
investment increased 3.9 percent, in contrast to a decrease of 1.5 percent.
The change in real private inventories subtracted 1.42 percentage points from the second-quarter change in real GDP, after subtracting 2.36 percentage points from the first-quarter change. Private businesses decreased inventories $160.2 billion in the second quarter, following a decrease of $113.9 billion in the first quarter and a decrease of $37.4 billion in the fourth.
Real final sales of domestic product -- GDP less change in private inventories -- increased 0.7 percent in the second quarter, in contrast to a decrease of 4.1 percent in the first.
Gross domestic purchases
Real gross domestic purchases -- purchases by U.S. residents of goods and services wherever produced -- decreased 2.3 percent in the second quarter, compared with a decrease of 8.6 percent in the first.
Gross national product
Real gross national product -- the goods and services produced by the labor and property supplied by U.S. residents -- decreased 1.0 percent in the second quarter, compared with a decrease of 6.6 percent in the first. GNP includes, and GDP excludes, net receipts of income from the rest of the world, which decreased $7.4 billion in the second quarter after decreasing $6.1 billion in the first; in the
second quarter, receipts decreased $8.4 billion, and payments decreased $1.0 billion.
Current-dollar GDP
Current-dollar GDP -- the market value of the nation's output of goods and services -- decreased 0.8 percent, or $26.8 billion, in the second quarter to a level of $14,151.2 billion. In the first quarter, current-dollar GDP decreased 4.6 percent, or $169.3 billion.
Revisions
The “third” estimate of the second-quarter is 0.3 percentage point less of a decrease, or $9.0 billion higher, than the "second" estimate issued last month. The upward revision to real GDP primarily reflected an upward revision to nonresidential fixed investment.
Advance Estimate Second Estimate Third Estimate
(Percent change from preceding quarter)
Real GDP................................. -1.0 -1.0 -0.7
Current-dollar GDP....................... -0.8 -1.0 -0.8
Gross domestic purchases price index..... 0.7 0.5 0.5
Corporate Profits
Profits from current production (corporate profits with inventory valuation and capital consumption adjustments) increased $43.8 billion in the second quarter, compared with an increase of $59.1 billion in the first quarter. Current-production cash flow (net cash flow with inventory valuation adjustment) -- the internal funds available to corporations for investment -- decreased $30.5 billion in
the second quarter, in contrast to an increase of $16.2 billion in the first.
Taxes on corporate income increased $35.6 billion in the second quarter, compared with an increase of $47.0 billion in the first. Profits after tax with inventory valuation and capital consumption adjustments increased $8.2 billion in the second quarter, compared with an increase of $12.0 billion in the first. Dividends decreased $62.1 billion, compared with a decrease of $51.8 billion; current-
production undistributed profits increased $70.3 billion, compared with an increase of $63.7 billion.
Domestic profits of financial corporations increased $28.5 billion in the second quarter, compared with an increase of $115.9 billion in the first. Domestic profits of nonfinancial corporations increased $29.8 billion in the second quarter, in contrast to a decrease of $40.2 billion in the first. In the second quarter, real gross value added of nonfinancial corporations decreased, and profits per unit of real value added increased. The increase in unit profits reflected decreases in unit labor and nonlabor costs that more than offset a decrease in unit prices.
The rest-of-the-world component of profits decreased $14.6 billion in the second quarter, compared with a decrease of $16.6 billion in the first. This measure is calculated as (1) receipts by U.S. residents of earnings from their foreign affiliates plus dividends received by U.S. residents from unaffiliated foreign corporations minus (2) payments by U.S. affiliates of earnings to their foreign
parents plus dividends paid by U.S. corporations to unaffiliated foreign residents. The second-quarter decrease was accounted for by a larger increase in payments than in receipts.
Profits before tax with inventory valuation adjustment is the best available measure of industry profits because estimates of the capital consumption adjustment by industry do not exist. This measure reflects depreciation-accounting practices used for federal income tax returns. According to this measure, domestic profits of both financial and nonfinancial corporations increased. The increase in nonfinancial corporations reflected increases in retail trade, in manufacturing, and in information that were partly offset by decreases in wholesale trade and in transportation and warehousing. Within manufacturing, the largest increases were in motor vehicles, in “other” nondurable goods, and in chemical products. The largest decrease was in petroleum and coal products.
Profits before tax increased $90.6 billion in the second quarter, compared with an increase of $186.4 billion in the first. The before-tax measure of profits does not reflect, as does profits from current production, the capital consumption and inventory valuation adjustments. These adjustments convert depreciation of fixed assets and inventory withdrawals reported on a tax-return, historical-cost
basis to the current-cost measures used in the national income and product accounts. The capital consumption adjustment increased $16.3 billion in the second quarter (from -$144.9 billion to -$128.6 billion), in contrast to a decrease of $69.3 billion in the first. The inventory valuation adjustment decreased $63.0 billion (from $81.1 billion to $18.1 billion), compared with a decrease of $58.1 billion.
ADP Employment report - 8:15am
Full report here
Wednesday, September 30, 2009, 8:15 A.M. ET
Nonfarm private employment decreased 254,000 from August to September 2009 on a seasonally adjusted basis, according to the ADP National Employment Report®. The estimated change of employment from July to August was revised by 21,000, from a decline of 298,000 to a decline of 277,000.
September’s employment decline was the smallest since July of 2008 and employment losses have diminished significantly over the last two quarters. Nevertheless, employment, which usually trails overall economic activity, is likely to decline for at least several more months, with losses continuing to diminish.
September’s ADP Report estimates nonfarm private employment in the service-providing sector fell by 103,000. Employment in the goods-producing sector declined 151,000, with employment in the manufacturing sector dropping 74,000, about the same as last month.
Large businesses, defined as those with 500 or more workers, saw employment decline by 61,000, while medium-size businesses with between 50 and 499 workers declined 93,000. Employment among small-size businesses, defined as those with fewer than 50 workers, declined 100,000. Employment losses among small-size businesses have diminished in each of the last six months.
In September, construction employment dropped 73,000. This was its thirty-second consecutive monthly decline, and brings the total decline in construction jobs since the peak in January 2007 to 1,632,000. Employment in the financial services sector dropped 19,000, the twenty-second consecutive monthly decline.
Pre-market - Wednesday, September 30, 2009
Futures up slightly this morning:
DJIA INDEX 9,704.00 31.00
S&P 500 1,058.80 4.00
NASDAQ 100 1,721.75
Today's economic calendar:
MBA Purchase Applications 7:00 AM ET
ADP Employment Report 8:15 AM ET
GDP 8:30 AM ET
Corporate Profits 8:30 AM ET
Chicago PMI 9:45 AM ET
EIA Petroleum Status Report 10:30 AM ET
Today's earnings reports:
Before open: ATU
After close:
AEHR Aehr Test Systems Technology Semiconductor Equipment & Materials
DMND Diamond Foods, Inc. Consumer Goods Processed & Packaged Goods
LWSN Lawson Software, Inc. Technology Application Software
OHB Orleans Homebuilders Inc. Industrial Goods Residential Construction
XRTX Xyratex Ltd. Technology Data Storage Devices
Market wrap - Wed edition
Dow 9,742 -47 -0.48%
Nasdaq 2,124 -7 -0.31%
S&P 500 1,061 -2 -0.22%
Today by sector:
 Today's heatmap:

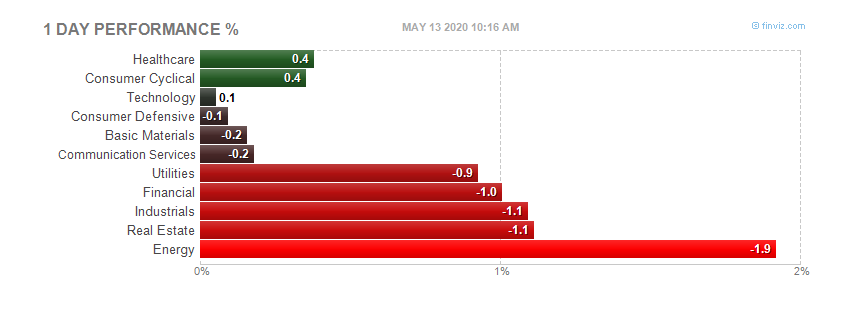 Today's heatmap:
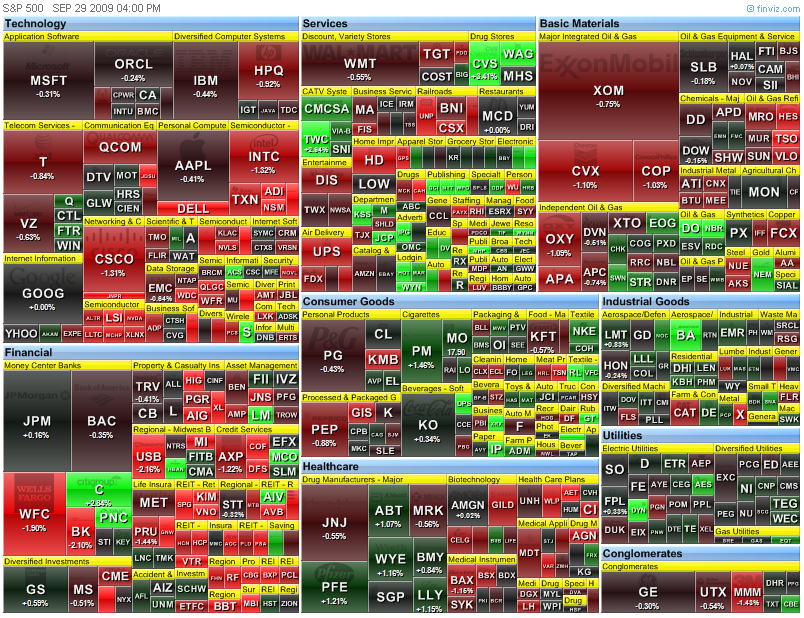
Tuesday, September 29, 2009
Consumer Confidence - 10:00
Full report here
The Conference Board Consumer Confidence Index® Dips in September
September 29, 2009
The Conference Board Consumer Confidence Index®, which had improved in August, dipped in September. The Index now stands at 53.1 (1985=100), down from 54.5 in August. The Present Situation Index decreased to 22.7 from 25.4. The Expectations Index declined to 73.3 from 73.8 last month.
The Consumer Confidence Survey® is based on a representative sample of 5,000 U.S. households. The monthly survey is conducted for The Conference Board by TNS. TNS is the world's largest custom research company. The cutoff date for September's preliminary results was September 22nd.
Says Lynn Franco, Director of The Conference Board Consumer Research Center: "Consumer Confidence, which had improved in August, retreated slightly in September. The Present Situation Index decreased, as consumers viewed both current business conditions and the labor market less favorably than last month. While not as pessimistic as earlier this year, consumers remain quite apprehensive about the short-term outlook and their incomes. With the holiday season quickly approaching, this is not very encouraging news."
Consumers' assessment of current conditions was less favorable in September. Those claiming business conditions are "bad" increased to 46.3 percent from 44.6 percent, while those claiming conditions are "good" increased to 8.7 percent from 8.5 percent. Consumers' appraisal of the job market was also less favorable. Those claiming jobs are "hard to get" increased to 47.0 percent from 44.3 percent, while those claiming jobs are "plentiful" decreased to 3.4 percent from 4.3 percent.
Consumers' short-term outlook was also slightly more pessimistic. Those anticipating an improvement in business conditions over the next six months decreased to 21.3 percent from 22.2 percent, while those expecting conditions to worsen decreased to 15.0 percent from 15.2 percent.
The labor market outlook was virtually unchanged. Those expecting more jobs in the months ahead edged down to 17.9 percent from 18.0 percent, while those expecting fewer jobs remained the same at 23.1 percent. The proportion of consumers expecting an increase in their incomes increased slightly to 11.2 percent from 10.8 percent.
Case Shiller HPI - 9:00am
Full report here
Broad Improvement in Home Prices According to the S&P/Case-Shiller Home Price Indices
New York, September 29, 2009 – Data through July 2009, released today by Standard & Poor’s for its S&P/Case-Shiller1 Home Price Indices, the leading measure of U.S. home prices, show that, although still negative, the annual rate of decline of the 10-City and 20-City Composites improved compared to last month’s reading. This marks approximately six months of improved readings in these statistics, beginning in early 2009.
The chart above depicts the annual returns of the 10-City and 20-City Composite Home Price Indices. The 10-City and 20-City Composites declined 12.8% and 13.3%, respectively, in July compared to the same month last year. All 20 metro areas also showed an improvement in the annual rates of decline, with July’s readings compared to June.
“The rate of annual decline in home price values continues to decelerate and we now seem to be witnessing some sustained monthly increases across many of the markets” says David M. Blitzer, Chairman of the Index Committee at Standard & Poor’s. “The two composites and all metro areas are showing an improvement in the annual rates of return, as seen through a moderation in their annual declines.
Looking at the monthly data, the 10-City and 20-City Composites and 18 of the 20 metros areas increased in July. In addition, both Composites and 13 of the MSA have had at least three consecutive months of positive prints. These figures continue to support an indication of stabilization in national real estate values, but we do need to be cautious in coming months to assess whether the housing market will weather the expiration of the Federal First-Time Buyer’s Tax Credit in November, anticipated higher unemployment rates and a possible increase in foreclosures.”
More at link with formatted tables.
Futures down slightly this morning after a big up day yesterday.
DJIA INDEX 9,720.00 -8.00
S&P 500 1,057.40 -1.60
NASDAQ 100 1,716.50 -6.25
Today's economic calendar:
Redbook 8:55 AM ET
S&P Case-Shiller HPI 9:00 AM ET
Consumer Confidence 10:00 AM ET
State Street Investor Confidence Index 10:00 AM ET
4-Week Bill Auction 1:00 PM ET
Farm Prices 3:00 PM ET
Today's earnings reports:
Before open:
CPSL China Precision Steel, Inc. Basic Materials Steel & Iron
GIGM GigaMedia Ltd. Technology Internet Software & Services
NSSC Napco Security Technologies, Inc. Services Security & Protection Services
NTZ Natuzzi SpA Consumer Goods Home Furnishings & Fixtures
PBG Pepsi Bottling Group Inc. Consumer Goods Beverages - Soft Drinks
PCH Potlatch Corp. Consumer Goods Paper & Paper Products
THO Thor Industries Inc. Consumer Goods Recreational Vehicles
WAG Walgreen Co. Services Drug Stores
After close:
DRI Darden Restaurants, Inc. Services Restaurants
JBL Jabil Circuit Inc. Technology Printed Circuit Boards
LNDC Landec Corp. Basic Materials Synthetics
MDRX Allscripts-Misys Healthcare Solutions, Inc. Technology Healthcare Information Services
MLNK ModusLink Global Solutions, Inc. Technology Internet Software & Services
NKE Nike Inc. Consumer Goods Textile - Apparel Footwear & Accessories
PSEM Pericom Semiconductor Corp. Technology Semiconductor - Integrated Circuits
WOR Worthington Industries, Inc. Basic Materials Steel & Iron
ZZ Sealy Corp. Consumer Goods Home Furnishings & Fixtures
Monday, September 28, 2009
Market wrap - 5:20
Low volume up day for the market. Shot right out of the gate higher, then leveled off for the rest of the day.
Dow 9,789 124 1.28%
Nasdaq 2,131 40 1.90%
S&P 500 1,063 19 1.78%
Gold 994 +3 +0.25%
Oil 67.20 0.82 1.24%
Today by sector:
 Today's heatmap:

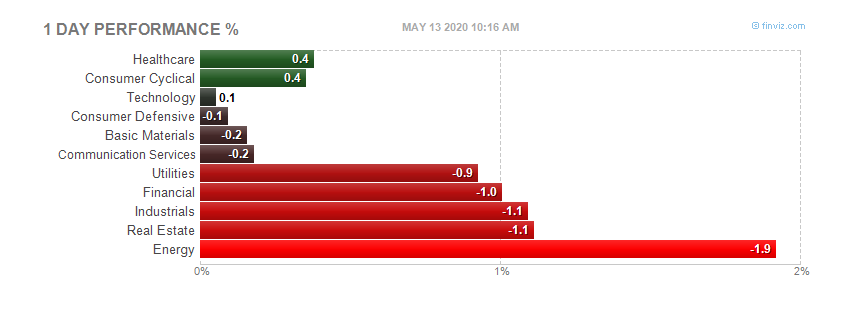 Today's heatmap:
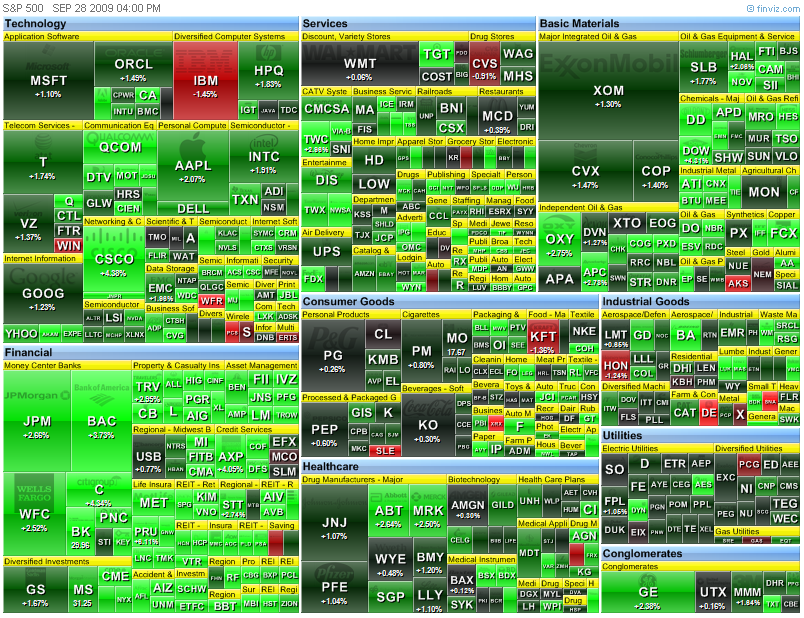
Pre--market, Monday, September 28, 2009
Futures up slightly this morning. Should be an interesting week.
DJIA INDEX 9,643.00 24.00
S&P 500 1,044.70 3.60
NASDAQ 100 1,702.50 5.50
Today's economic calendar:
4-Week Bill Announcement 11:00 AM ET
3-Month Bill Auction 1:00 PM ET
6-Month Bill Auction 1:00 PM ET
Today's earnings reports:
Before open:
CALM TRR
After close:
CRFT OHB
Friday, September 25, 2009
Market wrap - 5:00pm
Happy Friday. One bank closed today that we know of. Didn't catch the name.
Dow 9,665 -42 -0.44%
Nasdaq 2,091 -17 -0.79%
S&P 500 1,044 -6 -0.61%
Gold 992 -7 -0.73%
Oil 66.06 0.13 0.20%
Today by sector:
 Today's heatmap:

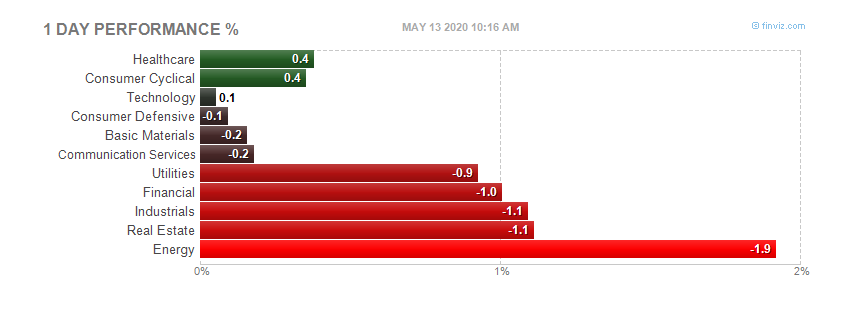 Today's heatmap:
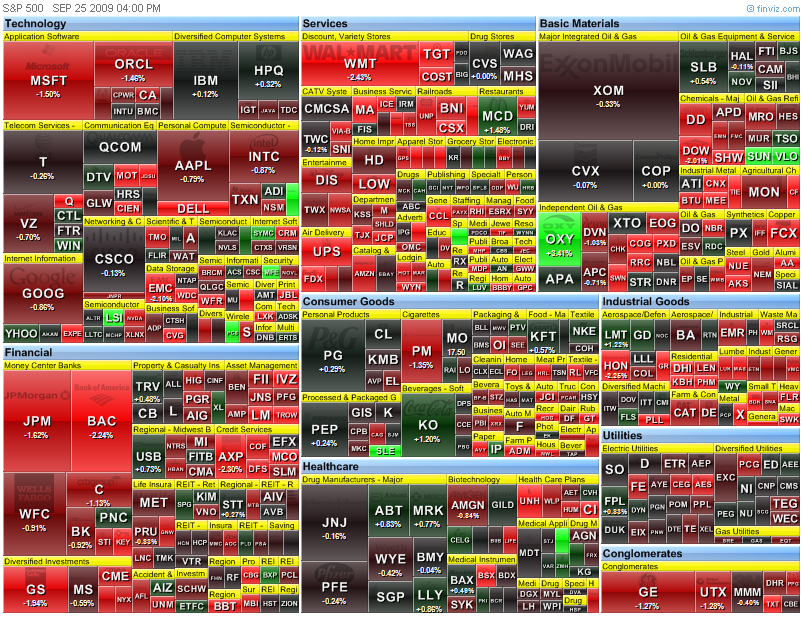
New home sales - 10:00am
Full report here
NEW RESIDENTIAL SALES IN AUGUST 2009
Sales of new one-family houses in August 2009 were at a seasonally adjusted annual rate of 429,000, according to estimates released jointly today by the U.S. Census Bureau and the Department of Housing and Urban Development.
This is 0.7 percent (±16.2%)* above the revised July rate of 426,000, but is 3.4 percent (±13.3%) below the August 2008 estimate of 444,000. The median sales price of new houses sold in August 2009 was $195,200; the average sales price was $256,800. The seasonally adjusted estimate of new houses for sale at the end of August was 262,000. This represents a supply of 7.3 months at the current sales rate.
Durable goods - 8:30am
Full report here
New Orders
New orders for manufactured durable goods in August decreased $4.0 billion or 2.4 percent to $164.4 billion, the U.S. Census Bureau announced today. This was the second decrease in the last three months. This followed a 4.8 percent July increase. Excluding transportation, new orders were down slightly. Excluding defense, new orders decreased 2.4 percent.
Shipments
Shipments of manufactured durable goods in August, down following two consecutive monthly increases, decreased $2.4 billion or 1.4 percent to $171.3 billion. This followed a 2.2 percent July increase.
Unfilled Orders
Unfilled orders for manufactured durable goods in August, down eleven consecutive months, decreased $2.8 billion or 0.4 percent to $737.1 billion. This was the longest streak of consecutive monthly decreases since the series was first published on a NAICS basis in 1992 and followed a 0.1 percent July decrease.
Inventories
Inventories of manufactured durable goods in August, down eight consecutive months, decreased $4.2 billion or 1.3 percent to $308.9 billion. This followed a 1.1 percent July decrease.
Capital Goods Industries
Nondefense
Nondefense new orders for capital goods in August decreased $4.0 billion or 7.1 percent to $52.7 billion.
Defense
Defense new orders for capital goods in August increased $0.1 billion or 1.1 percent to $9.9 billion.
Released September 25, 2009. This report presents advance information on two key business indicators: durable goods manufacturers' shipments and orders. Revised and more detailed estimates plus nondurable goods will be published October 2, 2009. The advance report on durable goods for September is scheduled for release October 28, 2009.
More at link with formatted tables
Pre-market - Friday, September 25, 2009
Futures up slightly as of 7:30
DJIA INDEX 9,654.00 19.00
S&P 500 1,046.70 2.40
NASDAQ 100 1,700.25 0.75
Today's economic calendar:
Durable Goods Orders 8:30 AM ET
Consumer Sentiment 9:55 AM ET
New Home Sales 10:00 AM ET
Today's earnings reports:
Before open:
AZZ AZZ incorporated Industrial Goods Industrial Electrical Equipment
KBH KB Home Industrial Goods Residential Construction
PKE Park Electrochemical Corp. Technology Printed Circuit Boards
SUTR Sutor Technology Group, Ltd. Basic Materials Steel & Iron
After close:
PSEM Pericom Semiconductor Corp. Technology Semiconductor - Integrated Circuits
QBAK Qualstar Corp. Technology Diversified Electronics
Thursday, September 24, 2009
Market wrap - 4:50
Humm...what do we have going on here.
Dow 9,707 -41 -0.42%
Nasdaq 2,108 -24 -1.12%
S&P 500 1,051 -10 -0.95%
Gold 999 -16 -1.53%
Oil 66.10 -3.08 -4.45%
Today by sector:
 Today's heatmap:
 Of note:
RIMM missed earnings, down 10 percent after hours.
MCD upping dividend 10 percent.
Of note:
RIMM missed earnings, down 10 percent after hours.
MCD upping dividend 10 percent.
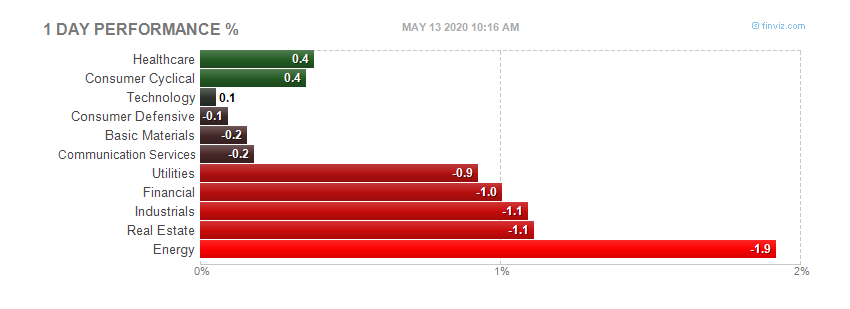 Today's heatmap:
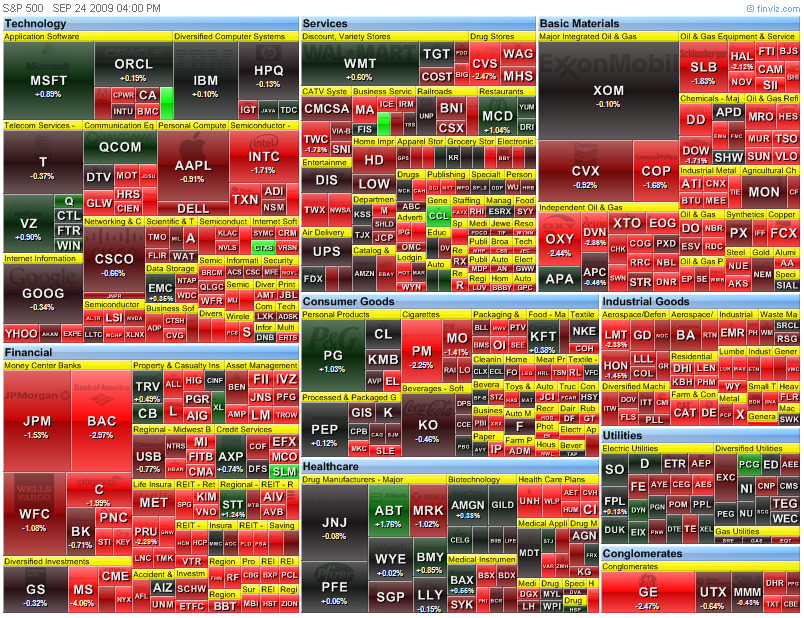 Of note:
RIMM missed earnings, down 10 percent after hours.
MCD upping dividend 10 percent.
Of note:
RIMM missed earnings, down 10 percent after hours.
MCD upping dividend 10 percent.
Santelli explains chart patterns - 2:20pm
Good explanation on how chart patterns "can" signal a reversal in the market:
Existing home sales - 10:15am
Full report here
Existing-Home Sales Ease Following Four Monthly Gains
Washington, September 24, 2009
Existing-home sales in August gave back some of their strong gain in July but remain above year-ago levels, according to the National Association of Realtors®.
Existing-home sales – including single-family, townhomes, condominiums and co-ops – declined 2.7 percent to a seasonally adjusted annual rate1 of 5.10 million units in August from a pace of 5.24 million in July, but remain 3.4 percent above the 4.93 million-unit level in August 2008. In the previous four months, sales had risen a total of 15.2 percent.
Lawrence Yun, NAR chief economist, said the tax credit is working. “Home sales retrenched from a very strong improvement in July but continue to be much higher than before the stimulus. The first-time buyer tax credit is having the intended impact of bringing buyers into the market, allowing them to take advantage of very favorable affordability conditions,” he said. “Some of the give-back in closed sales appears to result from rising numbers of contracts entering the system, with some fallouts and a backlog contributing to a longer closing process, but the decline demonstrates we can’t take a housing rebound for granted.”
According to Freddie Mac, the national average commitment rate for a 30-year, conventional, fixed-rate mortgage fell to 5.19 percent in August from 5.22 percent in July; the rate was 6.48 percent in August 2008.
An NAR practitioner survey shows first-time buyers purchased 30 percent of homes in August, and that distressed homes accounted for 31 percent of transactions; both were unchanged from July.
“The recent trend shows broad improvement in most of the country, but with an expected rise in foreclosures over the next 12 months we need to maintain a healthy level of ready buyers to absorb the inventory. An extension of the tax credit is critical to preserve incentives for financially qualified buyers to enter the market,” Yun said.
He added that many buyers had been on the sidelines during the past few years, waiting for signs of stabilization. “Now that the market is showing some momentum, we have an opportunity to achieve a more rapid and broader stabilization in home prices. Extending and expanding the tax credit also would help to keep other families from becoming upside down in their mortgages or risk foreclosure,” Yun said.
“When home prices show sustained gains, credit will become more widely available to other sectors because Wall Street will be able to price risks confidently. Stable home values will also allow more families to purchase consumer products and provide a strong boost for the broader economy.”
NAR President Charles McMillan, a broker with Coldwell Banker Residential Brokerage in Dallas-Fort Worth, said time is running very short for the existing tax credit. “Because it’s generally taking 60 days to close on a home after a contract is offered, buyers have little time to act to complete a purchase by the November 30 deadline,” he said.
“There’s no guarantee what Congress might do, so there’s really no time to waste. Since Realtors® have unparalleled knowledge of local markets, they can also advise first-time buyers on any additional state or local programs that might be able to offer them financial assistance, and help them close on a home before the tax credit expires.”
Total housing inventory at the end of August fell 10.8 percent to 3.62 million existing homes available for sale, which represents an 8.5-month supply2 at the current sales pace, down from a 9.3-month supply in July. Unsold inventory totals are 16.4 percent lower than a year ago.
The national median existing-home price3 for all housing types was $177,700 in August, down 12.5 percent from August 2008. Distressed properties continue to downwardly distort the median price because they generally sell for 15 to 20 percent less than traditional homes.
Single-family home sales fell 2.8 percent to a seasonally adjusted annual rate of 4.48 million in August from a level of 4.61 million in July, but are 2.5 percent higher than the 4.37 million-unit pace in August 2008. The median existing single-family home price was $177,500 in August, down 12.1 percent from a year ago.
Existing condominium and co-op sales slipped 1.6 percent to a seasonally adjusted annual rate of 620,000 units in August from a spike of 630,000 in July, but are 10.1 percent higher than the 563,000-unit level a year ago. The median existing condo price4 was $179,300 in August, which is 15.7 percent below August 2008.
Regionally, existing-home sales in the Northeast declined 2.2 percent to an annual pace of 910,000 in August, but are 5.8 percent above August 2008. The median price in the Northeast was $241,100, which is 10.5 percent below a year ago.
Existing-home sales in the Midwest fell 6.6 percent in August to a level of 1.14 million but are unchanged from a year ago. The median price in the Midwest was $149,900, down 10.4 percent from August 2008.
In the South, existing-home sales were down 3.1 percent to an annual pace of 1.89 million in August but are 1.6 percent above August 2008. The median price in the South was $157,400, which is 11.0 percent below a year ago.
Existing-home sales in the West declined 2.7 percent to an annual rate of 1.16 million in August but are 7.4 percent higher than a year ago. The median price in the West was $220,500, down 12.2 percent from August 2008.
The National Association of Realtors®, “The Voice for Real Estate,” is America’s largest trade association, representing 1.2 million members involved in all aspects of the residential and commercial real estate industries.
Jobless claims - 8:45am
Full report here
UNEMPLOYMENT INSURANCE WEEKLY CLAIMS REPORT
SEASONALLY ADJUSTED DATA
In the week ending Sept. 19, the advance figure for seasonally adjusted initial claims was 530,000, a decrease of 21,000 from the previous week's revised figure of 551,000. The 4-week moving average was 553,500, a decrease of 11,000 from the previous week's revised average of 564,500.
The advance seasonally adjusted insured unemployment rate was 4.6 percent for the week ending Sept. 12, a decrease of 0.1 percentage point from the prior week's unrevised rate of 4.7 percent.
The advance number for seasonally adjusted insured unemployment during the week ending Sept. 12 was 6,138,000, a decrease of 123,000 from the preceding week's revised level of 6,261,000. The 4-week moving average was 6,187,250, a decrease of 1,250 from the preceding week's revised average of 6,188,500.
The fiscal year-to-date average for seasonally adjusted insured unemployment for all programs is 5.651 million.
UNADJUSTED DATA
The advance number of actual initial claims under state programs, unadjusted, totaled 434,358 in the week ending Sept. 19, an increase of 21,966 from the previous week. There were 398,070 initial claims in the comparable week in 2008.
The advance unadjusted insured unemployment rate was 3.9 percent during the week ending Sept. 12, a decrease of 0.1 percentage point from the prior week. The advance unadjusted number for persons claiming UI benefits in state programs totaled 5,204,972, a decrease of 91,789 from the preceding week. A year earlier, the rate was 2.3 percent and the volume was 3,014,874.
Extended benefits were available in Alabama, Alaska, Arizona, Arkansas, California, Colorado, Connecticut, Delaware, the District of Columbia, Florida, Georgia, Idaho, Illinois, Indiana, Kansas, Kentucky, Maine, Massachusetts, Michigan, Minnesota, Missouri, Nevada, New Hampshire, New Jersey, New York, North Carolina, Ohio, Oregon, Pennsylvania, Puerto Rico, Rhode Island, South Carolina, Tennessee, Texas, Vermont, Virginia, Washington, West Virginia, and Wisconsin during the week ending Sept. 5.
Initial claims for UI benefits by former Federal civilian employees totaled 1,141 in the week ending Sept. 12, a decrease of 401 from the prior week. There were 1,919 initial claims by newly discharged veterans, a decrease of 281 from the preceding week.
There were 19,192 former Federal civilian employees claiming UI benefits for the week ending Sept. 5, a decrease of 1,233 from the previous week. Newly discharged veterans claiming benefits totaled 30,213, a decrease of 51 from the prior week.
States reported 3,223,849 persons claiming EUC (Emergency Unemployment Compensation) benefits for the week ending Sept. 5, an increase of 82,364 from the prior week. There were 1,116,863 claimants in the comparable week in 2008. EUC weekly claims include both first and second tier activity.
The highest insured unemployment rates in the week ending Sept. 5 were in Puerto Rico (6.7 percent), Oregon (5.6), Nevada (5.4), Pennsylvania (5.4), Michigan (5.2), Wisconsin (4.9), California (4.8), New Jersey (4.8), Connecticut (4.7), North Carolina (4.7), and South Carolina (4.7).
The largest increases in initial claims for the week ending Sept. 12 were in Wisconsin (+1,573), Oregon (+829), and Kansas(+677), while the largest decreases were in Texas (-4,623), Illinois (-4,217), Pennsylvania (-3,961), Michigan (-3,012), and Massachusetts (-2,389).
Pre-market - Thursday, September 24, 2009
Futures flat waiting on Jobless Claims at 8:30
DJIA INDEX 9,718.00 1.00
S&P 500 1,059.40 0.50
NASDAQ 100 1,729.75 4.25
Today's earnings calendar:
Jobless Claims 8:30 AM ET
Existing Home Sales 10:00 AM ET
EIA Natural Gas Report 10:30 AM ET
3-Month Bill Announcement 11:00 AM ET
6-Month Bill Announcement 11:00 AM ET
Christina Romer Speaks 1:00 PM ET
7-Yr Note Auction 1:00 PM ET
Money Supply 4:30 PM ET
Today's earnings reports:
Before open:
AM American Greetings Corp. Services Business Services
COMS 3Com Corporation Technology Networking & Communication Devices
CRAI CRA International Inc. Services Management Services
MKC McCormick & Co. Inc. Consumer Goods Processed & Packaged Goods
MTN Vail Resorts Inc. Services Resorts & Casinos
NEOG Neogen Corp. Healthcare Diagnostic Substances
OHB Orleans Homebuilders Inc. Industrial Goods Residential Construction
RAD Rite Aid Corp. Services Drug Stores
SCHL Scholastic Corporation Services Publishing - Books
SCS Steelcase Inc. Consumer Goods Business Equipment
TXI Texas Industries Inc. Industrial Goods Cement
ZLC Zale Corporation Services Jewelry Stores
After close:
ADAT Authentidate Holding Corp. Technology
ALOG Analogic Corporation Technology
CBK Christopher & Banks Corp. Services
FINL Finish Line Inc. Services
LPTH LightPath Technologies Inc. Technology
PSDV pSivida Corp. Healthcare
PSEM Pericom Semiconductor Corp. Technology
RIMM Research In Motion Ltd. Technology
SABA Saba Software Inc. Technology
SPEC Spectrum Control Inc. Technology
TIBX Tibco Software Inc. Technology
TSCM TheStreet.com, Inc. Technology
UAHC United American Healthcare Corp. Financial
Wednesday, September 23, 2009
Mark Haines asking tough questions to Wellpoint - 10:30pm
Missed this today, but interesting just the same
Market wrap - 4:15
Dow 9,749 -81 -0.83%
Nasdaq 2,131 -15 -0.69%
S&P 5001,061 -11 -1.01%
Gold 1,014 -1 -0.11%
Oil 68.35 -2.79 -3.92%
By Sector:
 Today's heatmap

 Today's heatmap
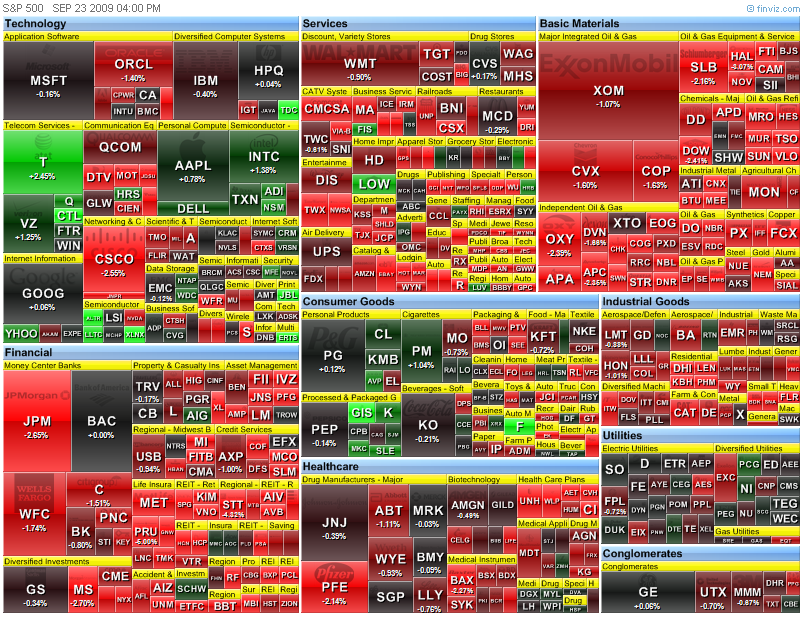
FED Statement - 2:15pm
Full report here
Release Date: September 23, 2009
For immediate release
Information received since the Federal Open Market Committee met in August suggests that economic activity has picked up following its severe downturn. Conditions in financial markets have improved further, and activity in the housing sector has increased. Household spending seems to be stabilizing, but remains constrained by ongoing job losses, sluggish income growth, lower housing wealth, and tight credit. Businesses are still cutting back on fixed investment and staffing, though at a slower pace; they continue to make progress in bringing inventory stocks into better alignment with sales. Although economic activity is likely to remain weak for a time, the Committee anticipates that policy actions to stabilize financial markets and institutions, fiscal and monetary stimulus, and market forces will support a strengthening of economic growth and a gradual return to higher levels of resource utilization in a context of price stability.
With substantial resource slack likely to continue to dampen cost pressures and with longer-term inflation expectations stable, the Committee expects that inflation will remain subdued for some time.
In these circumstances, the Federal Reserve will continue to employ a wide range of tools to promote economic recovery and to preserve price stability. The Committee will maintain the target range for the federal funds rate at 0 to 1/4 percent and continues to anticipate that economic conditions are likely to warrant exceptionally low levels of the federal funds rate for an extended period. To provide support to mortgage lending and housing markets and to improve overall conditions in private credit markets, the Federal Reserve will purchase a total of $1.25 trillion of agency mortgage-backed securities and up to $200 billion of agency debt. The Committee will gradually slow the pace of these purchases in order to promote a smooth transition in markets and anticipates that they will be executed by the end of the first quarter of 2010. As previously announced, the Federal Reserve’s purchases of $300 billion of Treasury securities will be completed by the end of October 2009. The Committee will continue to evaluate the timing and overall amounts of its purchases of securities in light of the evolving economic outlook and conditions in financial markets. The Federal Reserve is monitoring the size and composition of its balance sheet and will make adjustments to its credit and liquidity programs as warranted.
Voting for the FOMC monetary policy action were: Ben S. Bernanke, Chairman; William C. Dudley, Vice Chairman; Elizabeth A. Duke; Charles L. Evans; Donald L. Kohn; Jeffrey M. Lacker; Dennis P. Lockhart; Daniel K. Tarullo; Kevin M. Warsh; and Janet L. Yellen.
Crude oil - green shoots? 12:00
Crude extends losses after EIA petroleum data
NEW YORK (MarketWatch) -- Crude-oil futures extended losses Wednesday after the Energy Information Administration reported increases in U.S. petroleum inventories last week as gasoline demand dropped to the lowest level in nearly eight months. Crude inventories rose 2.8 million barrels in the week ended Sept 18, gasoline inventories gained 5.4 million barrels, and distillate stockpiles, which include diesel and heating oil, rose 3 million barrels. Gasoline supplied, an implied gauge of consumption, fell to 8.79 million barrels a day, the lowest level since late January, the EIA data showed. On the New York Mercantile Exchange, November crude lost $2.72, or 3.8%, to $69.04 a barrel. It was down less than 2% ahead of the data.
Subscribe to:
Posts (Atom)

