Wednesday, July 15, 2009

Pre-market - July 15, 2009

4...3...2...1...Liftoff! - Futures booming this morning waiting for the bell so this rocket can lift off. Intel posted better than expected earnings last night after close and this market is ready to go parabolic. The recession is over, Dennis Kneale said so. So did Merrill Lynch to back him up. Yipee! Probably 10 million jobs just around the corner. Futures at 7:45 DJIA INDEX 8,377.00 73.00 S&P 500 910.90 9.50 907.30 NASDAQ 100 1,471.50 24.75 Gold 923 0 0.03% Oil 60.54 1.01 1.70% The dollar index down .62 overnight Today's economic calendar: MBA Purchase Applications 7:00 AM ET Consumer Price Index 8:30 AM ET Empire State Mfg Survey 8:30 AM ET Industrial Production 9:15 AM ET EIA Petroleum Status Report 10:30 AM ET FOMC Minutes 2:00 PM ET We'll see if any of those can keep this rocket under 1000 today. Earnings calendar: Before market opens After market closes
I'm of course kidding about the rocket...kind of. This market really wants to go higher. Why, I have no idea. Maybe the relentless pumping by the media, or the fact that every time people get short this market they get killed by some news that is better than expected, or the so tired and worn out "not as bad as expected." Case and point Intel. Their forward guidance is good for their global business, but the business for the United States is very modest. Which means we are not in as good as shape as one may thing. Point two - Goldman Sachs - who blew out the quarter. Considering the TARP money they got, the billions more from AIG because of they were a counterparty, and the ability to get money almost free from the government - who the hell couldn't make money. That doesn't mean everything is fine, nor will be anytime soon. Even though the cheerleaders on CNBC will do their very best to get everyone to shovel every hard earned dollar they have into the casino. Beware!

Tuesday, July 14, 2009

Market wrap - 4:30PM

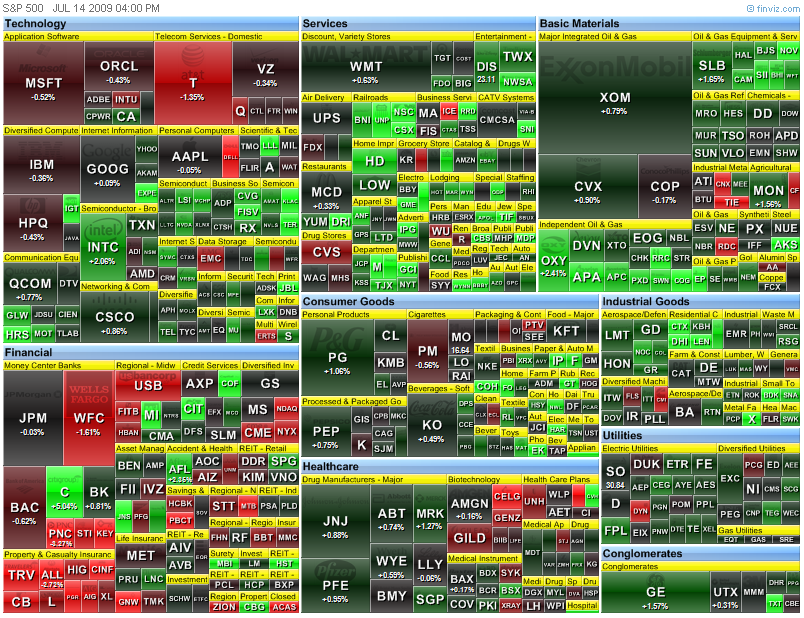
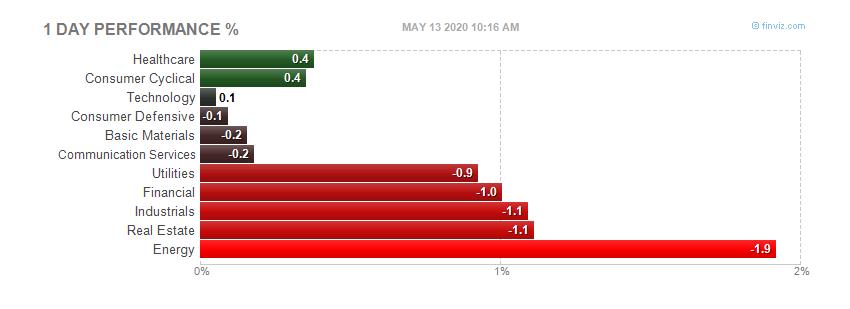
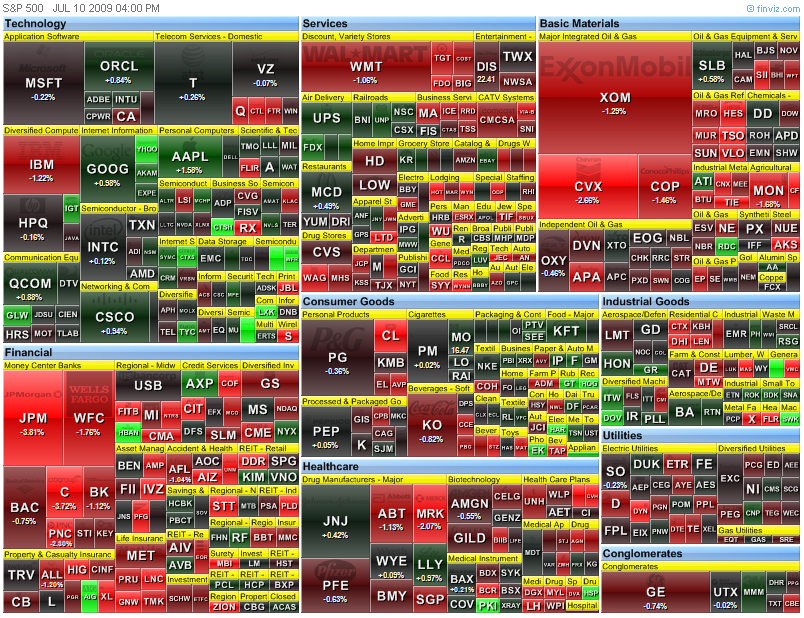
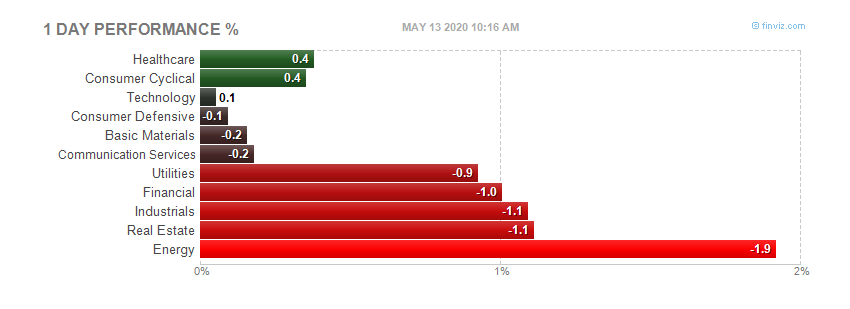
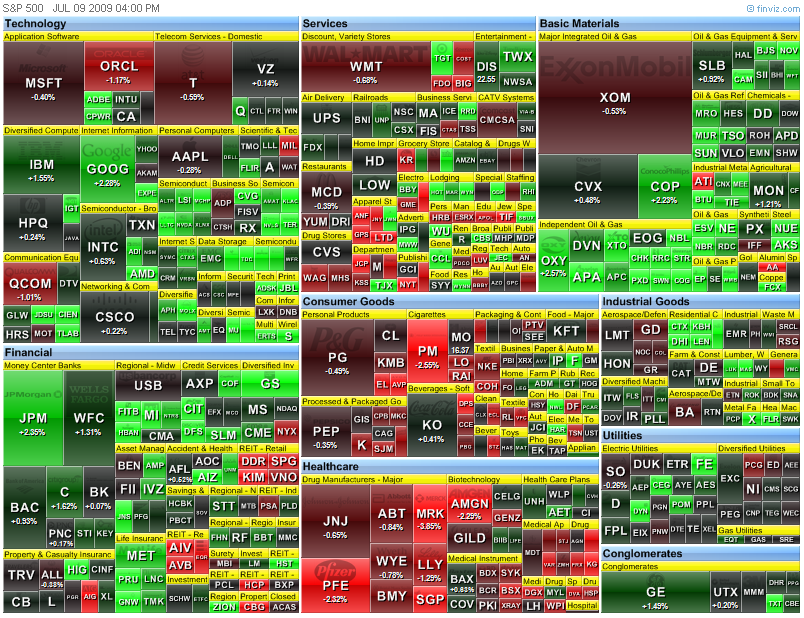
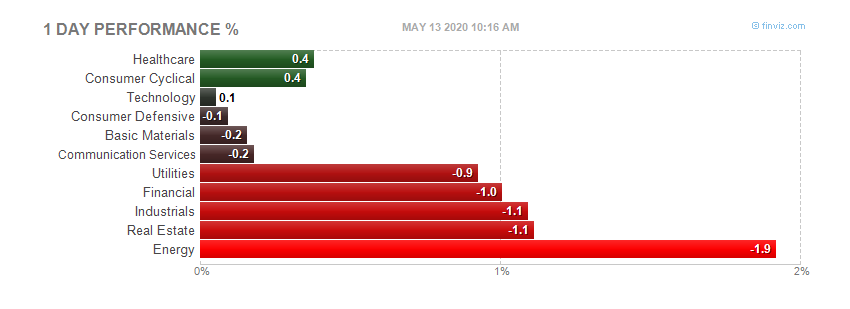
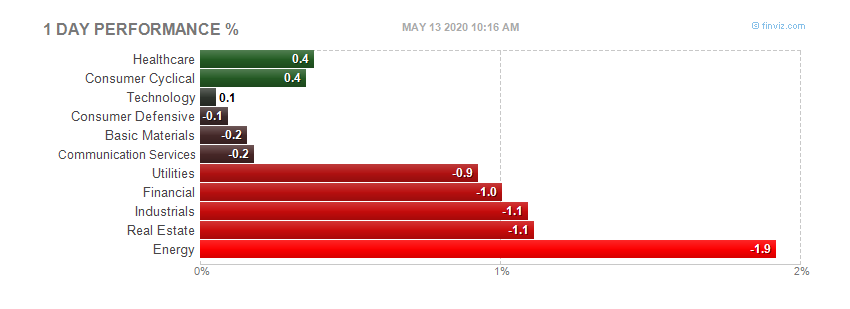
Slow day at the office today. After opening around 900, the S&P dropped to the 896 around 10.46, then rose sharply higher to hit 905 at 11.56. The index stayed positive the rest of the day and closed at 905.84. Low volume, not much action after that 1 hour and 10 minute move. Dow 8,359.49 +27.81 (0.33%) S&P 500 905.84 +4.79 (0.53%) Nasdaq 1,799.73 +6.52 (0.36%) Gold 923 +0 +0.03% Oil 59.30 -0.17 -0.29% Today by sector: Today's heatmap:
Intel's earnings report came out around 4:15 and trading was halted. Not sure about that. CNBC reporting, and showing a chart, of Intel trading higher after hours. My software was telling me trading was halted. Not sure what the deal is. UPDATE: Trading just resumed at 4:30 according to MY software, and Maria just came on and said Intel has resumed trading. I'll give them the benefit of the doubt this time. She gave the earning numbers which appeared to be better than expected, so she ASSUMED they should trade higher. Or, the person in her ear didn't tell her trading has stopped. With the incessant cheerleading and pumping from CNBC, this was a hard thing to say. YUM Brands also reported, and is trading lower after hours. SPY shares up

Since today is declared Goldman Sachs day - here is a video from Bloomberg worth watching.

Not that I am a fan of Elliot Spitzer, this is a pretty good interview just the same; Not a big fan of Charle Gasparino either, but he's right on this one, and from the CNBC cheerleader station as well;

PPI and Retail Sales - 9:03AM

PPI numbers - full report here. The Producer Price Index for Finished Goods rose 1.8 percent in June, seasonally adjusted, the Bureau of Labor Statistics of the U.S. Department of Labor reported today. This advance followed increases of 0.2 percent in May and 0.3 percent in April. At the earlier stages of processing, prices received by producers of intermediate goods climbed 1.9 percent in June after moving up 0.3 percent in the preceding month, and the crude goods index increased 4.6 percent following a 3.6-percent rise in May. (See table A.) The June acceleration in finished goods prices was broad based. The index for energy goods jumped 6.6 percent after advancing 2.9 percent in the prior month, prices for consumer foods increased 1.1 percent following a 1.6-percent drop in May, and the index for goods other than foods and energy rose 0.5 percent in June after edging down 0.1 percent in the previous month.
Full report here ADVANCE MONTHLY SALES FOR RETAIL AND FOOD SERVICES June 2009 The U.S. Census Bureau announced today that advance estimates of U.S. retail and food services sales for June, adjusted for seasonal variation and holiday and trading-day differences, but not for price changes, were $342.1 billion, an increase of 0.6 percent (±0.5%) from the previous month, but 9.0 percent (±0.7%) below June 2008. Total sales for the April through June 2009 period were down 9.6 percent (±0.5%) from the same period a year ago. The April to May 2009 percent change was unrevised from 0.5 percent (±0.3%). Retail trade sales were up 0.8 percent (±0.7%) from May 2009, but 10.0 percent (±0.7%) below last year. Gasoline stations sales were down 31.6 percent (±1.5%) from June 2008 and motor vehicle and parts dealers sales were down 14.1 percent (±2.5%) from last year. The advance estimates are based on a subsample of the Census Bureau’s full retail and food services sample. A stratified random sampling method is used to select approximately 5,000 retail and food services firms whose sales are then weighted and benchmarked to represent the complete universe of over three million retail and food services firms. Responding firms account for approximately 65% of the MARTS dollar volume estimate. For an explanation of the measures of sampling variability included in this report, please see the Reliability of Estimates section on the last page of this publication.
One more thing. Stay far away from your TV. The cheerleaders on CNBC are slobbering so bad after the Goldman earnings there is spit running out of the TV. CNBC - you are nothing but shills for the Wall Street banks - and you suck.

Goldman Sachs - Monster Quarter - 8:45AM

Shocked? Not me, I expected this. When you are in bed with the government, and their bailout money, who wouldn't make a profit? From MarketWatch By Greg Morcroft NEW YORK (MarketWatch) -- Goldman Sachs Group Inc said on Tuesday that its second quarter net income rose to $3.44 billion, or $4.93 a share, compared to $2.05 billion, or $4.58 a share a year ago. Analysts polled by Thomson Reuters had expected the company to earn $3.54 a share in the quarter. Net revenues at the firm were $13.76 billion in the second quarter, compared to $9.42 billion last year. Goldman switched from a fiscal reporting schedule to a calendar schedule last year, and this year's second quarter ended in June, while the year ago data is for the period ended May 31, 2008.
We also have this: CIT Group, which gives credit to many businesses is having a hard time recently: As their chart shows, they have been dropping quite severely, but the last two days have been really bad. But, not to worry, from Bloomberg we see this - CIT Rises on ‘Active’ Talks for U.S. Aid Before Debt Maturity - really? From the article - July 14 (Bloomberg) -- CIT Group Inc. rose in European trading after the corporate lender said it’s in “active discussions” with regulators about a rescue before $1 billion of bonds mature next month. ANOTHER RESCUSE/BAILOUT? Screw that, we the taxpayers have given these damn financial companies enough money. Here's an idea - LET GOLDMAN SACHS BAIL THEIR ASS OUT. By the way, they are up over 18 percent pre-market. Investors (cough, cough) ready to jump on the government backed gravy train. Err...I mean taxpayer backed gravy train. The robbing and pillaging continues.

Pre-market - July 14, 2009

Futures up slightly on the anticipation of Goldman Sachs earnings. CIT up big because of possible government bailout. DJIA INDEX 8,286.00 27.00 S&P 500 898.20 2.60 895.50 NASDAQ 100 1,445.00 2.50 Gold 923 10 1.10% Oil 60.80 1.08 1.81% Today's economic calendar: ICSC-Goldman Store Sales 7:45 AM ET Producer Price Index 8:30 AM ET Retail Sales 8:30 AM ET Redbook 8:55 AM ET Business Inventories 10:00 AM ET 4-Week Bill Auction 1:00 PM ET Today's earnings reports: Before market opens Today after close

Monday, July 13, 2009

Market wrap - A rocket ship to the moon - 4:10PM

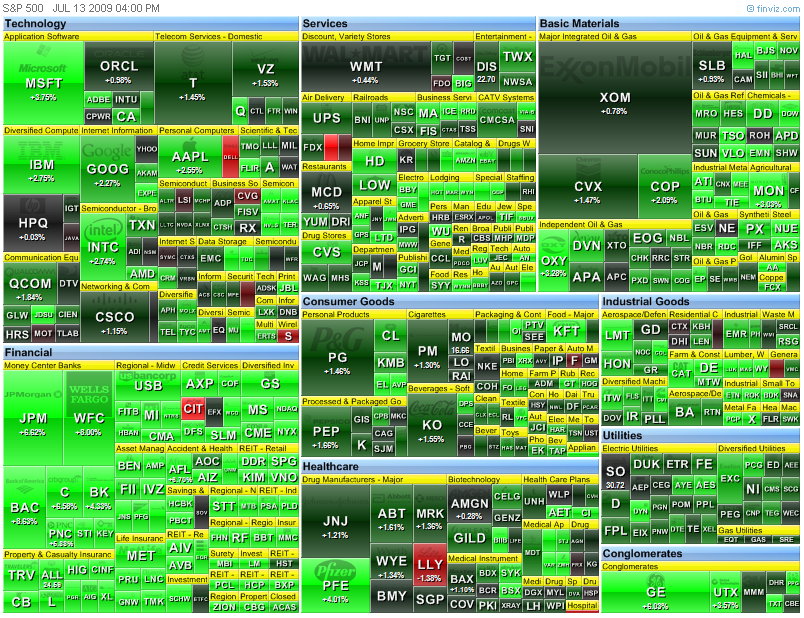
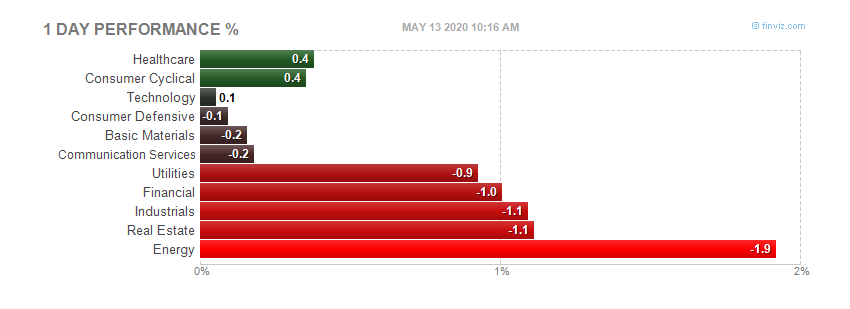
Well, well, well, what did we see today? A rocket ship north thanks to Meredith Whitney upgrading the crooks at Goldman Sachs. One bank upgrade and the market takes off like a rocket on no volume. Special! Dow 8,331.68 +185.16 (2.27%) S&P 500 901.05 +21.92 (2.49%) Nasdaq 1,793.21 +37.18 (2.12%) Gold 923 +10 +1.10% Oil 0.02 -0.20 -0.33% Notable: VIX -3.41 -11.72% BKX (bank index)+2.24 +6.53% Today by sector: The banks win again! Can anyone tell me how these banks, half of which should be bankrupt (at least)are six and a half percent better than last week? Today's heatmap: Lots of green there. Must be the green shoots turning into flowers.
Today made me about as sick as I have ever been watching this casino. The futures were lower around 7:30. Once Merideth Whitney went on CNBC and talked up Goldman Sachs, the futures turned around. Once the market opened, they were up nicely, only to fall back to the 874-875 area. Then at about 10:30, the rocket finished fueling itself up and off it went. The indexes gained all day long with little to no pullback. Incredible, one bank upgrade, with not so bullish news for the rest of the economy by Whitney (13 percent expected unemployment)the entire market acts like everything is this much better than last week? I have to give it to CNBC, who used snippets of Whitney's comments all day, to pump this puppy was quite impressive. We also got Bob "the important thing is" Pisoni back from vacation to help the pump job along. I only have one thing more to say - CNBC, you are simply pathetic, and a disgrace to the investors who watch you. It is an insult to our intelligence to say the bullshit you do on a daily basis. I hope GE, who reports Friday, is forced to cut costs because of profits, or lack of, they are forced to cut your sorry asses off TV. Screw you CNBC - you suck.

Bank of America Said to Balk at Paying Backstop Fee

The criminals are at it again. From Bloomberg: July 13 (Bloomberg) -- Bank of America Corp. is trying to avoid paying billions of dollars in fees to U.S. taxpayers for guarantees against losses at Merrill Lynch & Co., saying the rescue agreement was never signed and the funding never used. Regulators contend Bank of America owes at least part of a $4 billion fee it agreed to pay in January -- even without a completed legal document -- because the company benefited from implied U.S. backing on about $118 billion of Merrill Lynch assets, such as mortgage-backed bonds, people familiar with the matter said. The Charlotte, North Carolina-based bank says it owes the Treasury nothing, according to the people, who declined to be identified because the negotiations are confidential. Bank of America, ranked first by assets and deposits in the U.S., “got a moral commitment for insurance without tendering a check, so it appears they got something for nothing,” said Representative Brad Sherman, a California Democrat on the House Financial Services Committee. “If the government takes the risk, the government needs to be paid.” Both sides are under pressure from lawmakers who questioned whether taxpayers are being adequately rewarded for propping up lenders, and why Bank of America’s January acquisition of New York-based Merrill Lynch required a publicly funded bailout. The U.S. provided the bank $20 billion in capital plus the asset guarantees to keep Chief Executive Officer Kenneth Lewis from abandoning the takeover of money-losing Merrill, once the world’s biggest brokerage. More at link

Meredith Whitney ups Goldman Sachs - 8:55AM

Wow! Meredith Whitney on CNBC jammed the banking system up, especially Goldman Sachs, Bank of America and JP Morgan. Did she go over to the dark side, or did she find out having her own firm made her find out you only give bullish ratings: From Bloomberg: U.S. Stock-Index Futures Climb; Goldman Sachs Gains on Upgrade By Roger Neill July 13 (Bloomberg) -- U.S. stock index futures advanced as Goldman Sachs Group Inc. gained in early trading in New York after Meredith Whitney Advisory Group LLC recommended buying the shares before the bank reports earnings tomorrow. Standard & Poor’s 500 Index futures expiring in September climbed 0.3 percent to 877.20 at 8:20 a.m. in New York, having lost as much as 1 percent earlier.

Pre-market - July 13, 2009

Futures down slightly on this very important week for the market. Earnings season is full upon us, the Citi bankruptcy looms as something to watch. Futures as of 8:00: DJIA INDEX 8,067.00 -18.00 S&P 500 872.60 -1.70 874.50 NASDAQ 100 1,414.50 -1.50 Gold 913 -4 -0.40% Oil 59.94 +0.05 +0.08% Today's economic calendar: 4-Week Bill Announcement 11:00 AM ET 3-Month Bill Auction 1:00 PM ET 6-Month Bill Auction 1:00 PM ET Treasury Budget 2:00 PM E Today's earnings calendar: Before market opens in BOLD

Saturday, July 11, 2009

Citi to file bankrupcy? Saturday 5:35

From Bloomberg CIT Hires Bankruptcy Specialist Skadden as Bond Access Wanes By Pierre Paulden and Caroline Salas July 11 (Bloomberg) -- CIT Group Inc., the century-old lender to 950,000 businesses that has been unable to persuade the Federal Deposit Insurance Corp. to guarantee its debt sales, hired bankruptcy specialist Skadden, Arps, Slate, Meagher & Flom LLP as an adviser amid a plunge in its stock and bonds. The FDIC is concerned that standing behind CIT debt would put taxpayer money at risk because the company’s credit quality is worsening, said people familiar with the regulator’s thinking who declined to be identified because the talks are private. The FDIC has backed $274 billion in bond sales under its Temporary Liquidity Guarantee Program since Nov. 25. “Skadden is one of the principal law firms representing CIT,” Curt Ritter, a spokesman for New York-based CIT, said in an e-mail. “They represent the firm on a wide variety of corporate matters. CIT will not comment on any specific aspect of their engagement.” The Wall Street Journal, citing people it didn’t identify, said the hiring comes as CIT prepares for a possible bankruptcy filing. New York-based Skadden is known for its work in mergers and acquisitions and bankruptcies. The firm represented BHP Biliton Ltd., the world’s largest mining company, in its $150 billion proposed acquisition of Rio Tinto, and advised Circuit City Stores Inc. in its bankruptcy. Raising Capital The federal agency, run by Chairman Sheila Bair, is in discussions with CIT about how the lender can strengthen its financial position to get approval, including raising capital, said one of the people. CIT’s measures to improve its credit quality, such as by transferring assets to its bank, have been insufficient, the person said. CIT’s $500 million of floating-rate notes due in November 2010 fell 3.5 cents on the dollar yesterday to 70 cents, according to Trace, the bond-price reporting system of the Financial Industry Regulatory Authority. Credit-default swaps on CIT rose 2.5 percentage points to 37 percent upfront, and earlier reached 38 percent, according to broker Phoenix Partners Group. That’s in addition to 5 percent a year, meaning it would cost $3.7 million initially and $500,000 annually to protect $10 million of CIT debt for five years. The upfront cost reached the highest since Oct. 17, when it climbed to a record 41.5 percent, according to CMA DataVision prices. Maturing Debt The stock fell 33 cents, or 17.7 percent, to $1.53 in New York Stock Exchange composite trading yesterday, after earlier falling to $1.13, the lowest in seven years. CIT’s stock plunged 59 percent this year through yesterday, underperforming the Russell 1000 Financial Services Index by 50 percentage points. CIT became a bank in December to qualify for a government bailout and received $2.33 billion in funds from the U.S. Treasury. The lender, which has reported more than $3 billion of losses in the past eight quarters, faces $10 billion of maturing debt through 2010 and hasn’t had access to the corporate bond market in more than a year, according to data compiled by Bloomberg. Without the TLGP, CIT may default as soon as April, when a $2.1 billion credit line matures, according to Fitch Ratings. “CIT continues to be in active dialogue with the government,” the company said yesterday in a statement distributed by Business Wire. “There can be no assurance that CIT’s application will be approved by the FDIC, nor as to the timing or terms of any such determination.” Credit Crisis Ritter, the CIT spokesman, has declined to comment on the FDIC’s reasons for the delay. Andrew Gray, spokesman for the FDIC in Washington, declined to comment on CIT’s pending application. The TLGP program opened a channel of funding for financial institutions unable to borrow in U.S. markets after the September collapse of Lehman Brothers Holdings Inc. By paying the FDIC a fee to back their bonds, banks are able to sell debt with top credit ratings. The TLGP expires Oct. 31. Issuers must have applied by June 30. The FDIC has given competitors from Fairfield, Connecticut- based General Electric Co. to GMAC Inc. of Detroit access to the TLGP during the worst credit crisis since the Great Depression. GE is rated Aa2 by Moody’s Investors Service and AA+ by Standard & Poor’s, the third- and second-highest credit grades. Rating Lowered A failure of CIT would be the biggest bank collapse since regulators seized Washington Mutual Inc. in September. CIT reported $75.7 billion in assets and $68.2 billion in liabilities, including $3 billion in deposits, at the end of the first quarter. Fitch slashed CIT to speculative grade, or junk, in April, then lowered the lender’s rating again on June 1 to BB and cut it to B+ this week. Moody’s cut CIT three levels to Ba2 from Baa2 on April 24. S&P downgraded CIT three grades to BB- on June 12. The lender, which says it was the first to offer credit to help consumers nationwide buy Studebaker cars, funds businesses from Dunkin’ Brands Inc. in Canton, Massachusetts, to Eddie Bauer Holdings Inc., the bankrupt clothing chain in Bellevue, Washington. CIT says it’s the third-largest U.S. railcar-leasing firm and the world’s third-biggest aircraft financier.
Can AIG be far behind?

Missed by .19 - quite impressive actually - The battle of Bulls & Bears - Update Saturday 1:00PM

In the charts below you will see a classic Head & Shoulders pattern on the S&P500 chart. The pattern has been developing since the beginning of May. You can see this on the following chart: The important thing to notice is the neckline, at the 878.94 level, established by the candle (low wick)on 5/15/09. This level is just a tad below the other neckline candle on 7/7/09. This low is a little higher at 879.93. This pattern is known as a reversal pattern. Since the March 6th low, or the March 9th closing low, the market has been on an uptrend, so a reversal would be signifying the market is turning and heading lower. Much to the chagrin of the Government, who would like us to think everything is getting better, and the All Star cheerleaders on CNBC, who's on a mission to pump it higher for their parent company GE (and their buddies on Wall Street, especially the banks) this line represents the confirmation of the reversal. In other words, once this line is breached, and closes below this level, the Bears will come out of hibernation and short the market. You can see the battle of the Bulls & Bears and how this line has been successfully defended (so far) by the Bulls with this chart. The numbers above the candles designate the closing: In the last three days, notice how small the trading range has been? Also, the intraday range has broken this line, but the Bulls have successfully pushed it back above. This pattern was the hot topic on CNBC this week, or at least the last three days. It has been talked about on many blogs and trading sights as well. As usual, CNBC is a day late. But they did their homework, and went back far enough on a chart to call this "a possible" inverse head and shoulders, which means a reversal to the upside. Good grief! Friday, they were talking to Steve "this market is going higher" Grasso about where the market is going. This was some time in the early afternoon. His answer was "if it closes above 880, this market is going higher next week." Really? Of course it might, and I assume he was talking about the neckline at 878.94, but I won't get too technical on him. As you can see by the chart above, this line has been quite the battle for the last three days. But as Bob Pisoni would say "the important thing is" the line was defended and the market is set to the upside. Earnings season is upon us, with Alcoa the first DOW component to report this last week. Some of the large banks are due to report next week, including Goldman Sachs on Tuesday, followed by JP Morgan on Thursday. Friday is littered with Citigroup, Bank of America and GE, who trades like a bank. None of these companies are in very good shape, if you go by their recent stock performance (the ones that report on Friday). In the grand plan of bullshitting the people, this market needs to be pumped up. With earnings expectations lowered to a level easy enough for a cave man to make them, I expect some companies (especially a bank or two, most likely GS) to report the "better than expected" earnings next week. As long as this neckline is defended by the Bulls, the better than expected earnings by the banks will drive this market higher, along with the slobbering CNBC cheerleaders. We will hear "Green Shoots" galore and "the big money is getting off the sidelines, it's time to "buy, buy, buy" will be heard all day. Utopia has arrived in the stock market world. Dennis Kneale who declared the recession over last week (and got into it with the blogesphere for being the idiot that he is)will likely have wet pants while telling us "I told you so." For this to happen, they needed to defend the neckline. Friday morning Goldman upgraded about every stock in the tech world, after someone upgraded the home builders on Thursday. Home builders? Give me a break. But if you look at the stocks on Thursday, the home builders, casinos and hotels all did very will, helping to drive the market higher. Along with a bunch of other obscure bullshit stocks that nobody has ever heard of. On Friday, along with the Goldman upgrades and a mid to late day surge, with a nice ramp at the end of the day they made their bogey, closing .19 above the neck. Well done! But really, who thinks home builders, casinos and hotels are a good buy? But I digress. Here is the intraday from Friday's action on the S&P500. We all know the housing mess is far from over, and the 800 pound gorilla in the room is Commercial Real Estate, both which can be bought with the ETF known as IYR. Take a look at the intraday chart of IYR on Friday: Quite the battle at the end of the day is it not? Let me ask, who in their right mind would buy that much IYR after 3:30 on Friday going into a weekend? Actually, who would buy that crap to begin with? Seems either fishy or just plain dumb to me. There is plenty of pain to come in the world of real estate. I will be watching this neckline very close (as I have been) and depending on what happens next week, will determine if I go long or short. The neckline is key. Happy Trading

Market wrap - a day late - sorry - Updated Saturday - 12:15PM

The market today (yesterday)didn't seem to know which way it wanted to go. It shot up after the open, only to be reeled back in with the poor Consumer Sentiment report. After dropping until 11:30, it rallied throughout the day until a nice spike up right at the close. More on this later. Here's how we finished: Dow 8,146.52 -36.65 (-0.45%) S&P 500 879.13 -3.55 (-0.40%) Nasdaq 1,756.03 +3.48 (0.20%) Gold 913 -4 -0.40% Oil 59.66 -0.52 -0.86% Today by sector: Today's heatmap:

Friday, July 10, 2009

Consumer Sentiment - 10:00AM

Not good, much worse than expected. Sentiment Index = Prior = 71.5 Consensus Range 68.0 to 72.0 Actual = 64.6

Import/Export prices report - 8:30AM

Full report here U.S. IMPORT AND EXPORT PRICE INDEXES - JUNE 2009 - The U.S. Import Price Index rose 3.2 percent in June, the Bureau of Labor Statistics of the U.S. Department of Labor reported today, led by higher petroleum prices. The June increase followed a 1.4 percent advance in May. Export prices also increased in June, rising 1.1 percent after advancing 0.5 percent in the previous month. Import Goods U.S import prices increased 3.2 percent in June, the largest monthly advance since a 3.2 percent rise in November 2007. Import prices have risen for each of the past four months but decreased overall for the year ended in June, declining 17.4 percent. The June increase in import prices was driven by a 20.3 percent jump in petroleum prices, the largest monthly advance for that index since a 20.5 percent increase in April 1999. Petroleum prices have risen 69.5 percent since January but, despite the recent advances, fell 45.9 percent over the past 12 months. Nonpetroleum import prices ticked up 0.2 percent in June, and decreased 6.5 percent over the past year. The advance in nonpetroleum prices was led by a 0.7 percent increase in the price index for nonpetroleum industrial supplies and materials. Higher prices for unfinished metals were the primary contributor to the June increase in nonpetroleum industrial supplies and materials prices, which followed a 0.8 percent rise in May. Prices for foods, feeds, and beverages, for consumer goods, and for automotive vehicles also rose in June. Foods, feeds, and beverages prices increased 0.5 percent as higher prices for meat and coffee more than offset lower vegetable prices. The price indexes for consumer goods and automotive vehicles each ticked up 0.1 percent. In contrast, capital goods prices edged down 0.1 percent in June, led by a 0.5 percent decrease in computer prices. Excluding computer prices, capital goods prices advanced 0.1 percent. Export Goods Export prices rose for the third consecutive month in June, advancing 1.1 percent following 0.5 percent increases in each of the two previous months. Higher prices for both agricultural and nonagricultural exports contributed to the overall increase in June which was the largest monthly rise in export prices since a 1.5 percent increase in July 2008. Despite the advance, export prices declined 6.4 percent over the past year. Prices for agricultural exports increased 4.8 percent in June and 12.7 percent for the second quarter of 2009, the largest three-month gain since the first quarter of 2008. Both advances were led by rising prices for soybeans, corn, and wheat. Even with the increase over the past three months, agricultural prices fell 12.5 percent for the June 2008-2009 period. Nonagricultural prices rose 0.8 percent in June, but decreased 5.7 percent over the past 12 months. A 2.2 percent increase in the price index for nonagricultural industrial supplies and materials led the overall advance in nonagricultural prices in June. Higher prices for fuels, chemicals, and metals all contributed to the advance. Capital goods prices and consumer goods prices also rose in June, advancing 0.2 percent and 0.5 percent, respectively. The increase in capital goods prices was driven by a 0.4 percent rise in the price index for transportation equipment while higher consumer goods prices were led by a 0.9 percent advance in medicinal, dental, and pharmaceutical prices. In contrast, the price index for automotive vehicles edged down 0.1 percent in June after remaining unchanged in May. Imports by Locality of Origin Led by higher fuel prices in June, the price indexes for imports from Canada and from Mexico rose 2.8 percent and 1.6 percent, respectively. Despite rising in June, each index remained down over the past year; import prices from Canada fell 24.8 percent for the year ended in June while prices for imports from Mexico decreased 13.5 percent for the same period. Import prices from the European Union and from Japan both advanced 0.7 percent in June after falling 0.2 percent and remaining unchanged, respectively, the previous month. The price index for imports from the European Union fell 7.2 percent for the year ended in June, while prices for imports from Japan rose 1.9 percent. In contrast, prices for imports from China decreased 0.1 percent in June after recording no change in May. Overall import prices from China decreased 2.4 percent for the June 2008-2009 period, the largest 12-month drop since the index was first published in December 2003. Import and Export Services Import air passenger fares increased for the first time since October 2008, rising 13.0 percent in June. The advance was led by a 28.6 percent seasonal increase in European fares. Export air passenger fares rose in June, advancing 2.1 percent, which was the first increase for the index since January and was also driven by higher European fares. Despite the increases, both import air passenger fares and export air passenger fares fell over the past 12 months, declining 14.2 percent and 20.7 percent, respectively. The price index for import air freight advanced 1.4 percent in June after a 0.9 percent increase the previous month. The index fell 15.6 percent for the year ended in June. In contrast, export air freight prices fell 1.2 percent in June, led by a 2.2 percent drop in European air freight prices. Overall,export air freight prices declined 16.6 percent over the past year.

Pre-market - July 10, 2009

Futures down this morning on recovery woes; DJIA INDEX 8,069.00 -65.00 S&P 500 872.10 -6.80 878.20 NASDAQ 100 1,404.75 -8.75 Gold 916 7 0.76% Oil 59.65 -0.76 -1.26% Today's economic calendar: International Trade 8:30 AM ET Import and Export Prices 8:30 AM ET Consumer Sentiment 9:55 AM ET Tim Geithner Speaks 10:00 AM ET Today's earnings reports: Before market opens in BOLD
On the interesting news front, more on the trading code caper - From Bloomberg

Thursday, July 9, 2009

California IOUs - To be traded? 10:10PM

From Yahoo SEC: Treat California IOUs as securities SEC calls for California IOUs to be regulated as securities * By Marcy Gordon, AP Business Writer * On Thursday July 9, 2009, 9:05 pm EDT WASHINGTON (AP) -- The recipients of billions of dollars in promissory notes being issued by California soon may be able to sell them on a regulated market, following action taken Thursday by federal regulators. Some of the nation's largest banks say that, starting Friday, they will no longer accept the promissory notes. The banks want to pressure the state to end its budget impasse, but their action could leave many businesses and families with fewer options for getting their money. Therefore, the Securities and Exchange Commission recommended Thursday that the promissory notes, which carry an annual interest rate of 3.75 percent, be regulated by the Municipal Securities Rulemaking Board as a form of municipal debt. A regulated market for the promissory notes would make it easier for individuals holding them to sell them at a fair price, analysts said. The SEC oversees rules set by the nongovernment MSRB, which polices the municipal securities markets for fair pricing, disclosure and adherence to the requirement that the securities sold be suitable for the buyer. The SEC said in an announcement that its staff "has expressed its belief that California's recently issued IOUs are 'securities' under federal securities law." "As such, holders of these IOUs and those who may purchase them are protected by the provisions of the federal securities laws that prohibit fraud in the purchase or sale of securities," the SEC said. In addition, it said, those acting as intermediaries between buyers and sellers of the promissory notes, called IOUs for the phrase "I owe you" -- may need to register with regulators as brokers, dealers or municipal securities dealers. With Bank of America Corp., Wells Fargo & Co., Citigroup Inc. and some regional banks in the state having said they won't accept the promissory notes for payment after Friday, attention has turned to the possibility of a secondary market to buy up the notes. A spokesman for JPMorgan Chase & Co. left open the possibility Thursday of a change in that bank's policy, but spokesmen for Bank of America and Wells Fargo said those banks still planned to cease honoring the notes. Citigroup had no immediate comment. According to the California Credit Union League, more than 60 credit unions in the state will continue to accept the promissory notes after Friday. The Federal Reserve, meanwhile, advised bank customers with a promissory note that they should first check with their bank to make sure it will be accepted for deposit and whether any fees could be incurred. A regulated market for the promissory notes "makes it even more advantageous" for individuals holding them, who could sell them at a fair price, said Paul Maco, an attorney at Vinson & Elkins in Washington who was a director of the SEC's Office of Municipal Securities. The price they receive may be discounted in accordance with the market's perception of the risk of the state repaying the notes, but it would be an orderly market price, he said. As California legislators haggle over how to close a $26.3 billion budget deficit, the state is expected to send out $3.3 billion in IOUs this month to an array of individuals, small businesses and local governments. It marks the first time since 1992, and only the second time since the Great Depression, that California has sent out notes promising repayment at a later date instead of paying its bills on time. California Attorney General Jerry Brown has said the IOUs are valid and binding obligations of the state, a characterization that experts say qualifies them as municipal securities. Federal bank regulators, including the Federal Reserve and the Federal Deposit Insurance Corp., told banks in guidance issued Wednesday that they should exercise "the same prudent judgment and sound risk management practices" regarding the IOUs as they would with any other state debt securities. Copyright © 2009 The Associated Press. All rights reserved. The information contained in the AP News report may not be published, broadcast, rewritten, or redistributed without the prior written authority of The Associated Press.
This was breaking news on CNBC at 2:50PM. I have looked for details since. If finally found it's way to the media again. 6 hours later.

AIG to pay bonuses - Have you looked at your stock price? 9:00PM

From MarketWatch AIG set to pay 'millions' in more bonuses: report LOS ANGELES (MarketWatch) -- American International Group Inc. (AIG 9.30, -0.18, -1.90%) is preparing to pay millions of dollars more in bonuses to several dozen top corporate executives even though an earlier round of payments four months ago set off a national furor, the Washington Post reported late Thursday. The insurer is unnecessarily seeking federal government approval for the move, putting the administration's new compensation czar Kenneth Feinberg on the spot by seeking his opinion on bonuses that were promised long before he took his post, the report said. "Anytime we write a check to anybody" it is highly scrutinized, the report quoted an unnamed AIG official as saying. "We would want to feel comfortable that the government is comfortable with what we are doing."
Wow! Considering this; What happens when they pay these bonuses (If they are allowed to)and the stock goes to it's proper place - zero - and needs another bailout? That should be some quality TV.

Market wrap - 4:15PM

Quite the battle we had today. Index's mixed, little movement when the day was over. Dow 8,183.17 +4.76 (0.06%) S&P 500 882.67 +3.11 (0.35%) Nasdaq 1,752.55 +5.38 (0.31%) Gold 916 +7 +0.76% Oil 60.45 0.27 0.45% 30 year bond auction Yield 4.303% vs. Exp. 4.292% Bid to cover 2.36 vs. Avg. 2.54 (Prev. 2.68) Today's action by sector: Today's heatmap:
The banks were strong today, except for AIG, who is running through that 20 to 1 reverse stock split like water through a funnel. Closed at 9.48, down 27.63 percent. Not good. Merrill Lynch upgraded Goldman Sachs which gave a boost to the other banks. The Home builders, along with Hotels also got upgraded which pushed those stocks higher. The builders and hotels, were joined by the Casino's to the upside. When un-employment is still rising, with really no good news, why would anyone want, or believe these stocks will be any good. The S&P finished the second day very close to the 200 day moving average. It also sits just above the technical support known as the neckline of the head & shoulders that has formed over the last 2 months. The key support levels are 881.49 for the 200 moving average, and 878.94 on the neckline. If those supports are breached, look out below.

Wholesale Trade report - 10:00AM

Full report here MONTHLY WHOLESALE TRADE: SALES AND INVENTORIES APRIL 2009 Sales. The U.S. Census Bureau announced today that April 2009 sales of merchant wholesalers, except manufacturers’ sales branches and offices, after adjustment for seasonal variations and trading-day differences but not for price changes, were $309.4 billion, down 0.4 percent (+/-0.7%)* from the revised March level and were down 19.5 percent (+/-1.6%) from the April 2008 level. The March preliminary estimate was revised downward $0.2 billion or 0.1 percent. April sales of durable goods were down 1.9 percent (+/-0.9%) from last month and were down 23.4 percent (+/-1.9%) from a year ago. Sales of motor vehicle and motor vehicle parts and supplies, were down 7.8 percent from last month and sales of metals and minerals, except petroleum were down 6.5 percent. Sales of nondurable goods were up 0.8 percent (+/-0.9%)* from last month, but were down 16.1 percent (+/-1.9%) from last year. Sales of farm product raw materials were up 10.5 percent from last month and sales of beer, wine, and distilled alcoholic beverages were up 2.6 percent. Inventories. Total inventories of merchant wholesalers, except manufacturers’ sales branches and offices, after adjustment for seasonal variations but not for price changes, were $405.4 billion at the end of April, down 1.4 percent (+/-0.4%) from the revised March level and were down 6.2 percent (+/-1.1%) from a year ago. The March preliminary estimate was revised downward $0.6 billion or 0.1 percent. End-of-month inventories of durable goods were down 2.2 percent (+/-0.4%) from last month and were down 5.9 percent (+/-1.2%) from last April. Inventories of metals and minerals, except petroleum, were down 6.8 percent from last month and inventories of motor vehicle and motor vehicle parts and supplies were down 4.5 percent. End-of-month inventories of nondurable goods were virtually unchanged (+/-0.7%)* from March, but were down 6.6 percent (+/-1.9%) compared to last April. Inventories of apparel, piece goods, and notions were down 2.6 percent from last month, while inventories of paper and paper products were up 2.8 percent. Inventories/Sales Ratio. The April inventories/sales ratio for merchant wholesalers, except manufacturers’ sales branches and offices, based on seasonally adjusted data, was 1.31. The April 2008 ratio was 1.12.

Jobless claims - July 9, 2009

Full report here UNEMPLOYMENT INSURANCE WEEKLY CLAIMS REPORT SEASONALLY ADJUSTED DATA In the week ending July 4, the advance figure for seasonally adjusted initial claims was 565,000, a decrease of 52,000 from the previous week's revised figure of 617,000. The 4-week moving average was 606,000, a decrease of 10,000 from the previous week's revised average of 616,000. The advance seasonally adjusted insured unemployment rate was 5.1 percent for the week ending June 27, an increase of 0.1 percentage point from the prior week's unrevised rate of 5.0 percent. The advance number for seasonally adjusted insured unemployment during the week ending June 27 was 6,883,000, an increase of 159,000 from the preceding week's revised level of 6,724,000. The 4-week moving average was 6,769,000, an increase of 12,000 from the preceding week's revised average of 6,757,000. The fiscal year-to-date average for seasonally adjusted insured unemployment for all programs is 5.421 million. UNADJUSTED DATA The advance number of actual initial claims under state programs, unadjusted, totaled 577,506 in the week ending July 4, an increase of 17,612 from the previous week. There were 401,672 initial claims in the comparable week in 2008. The advance unadjusted insured unemployment rate was 4.5 percent during the week ending June 27, unchanged from the prior week. The advance unadjusted number for persons claiming UI benefits in state programs totaled 6,043,561, a decrease of 34,892 from the preceding week. A year earlier, the rate was 2.1 percent and the volume was 2,857,438. Extended benefits were available in Alaska, Arizona, Arkansas, California, Colorado, Connecticut, the District of Columbia, Florida, Georgia, Idaho, Illinois, Indiana, Kentucky, Maine, Massachusetts, Michigan, Minnesota, Missouri, Montana, Nevada, New Jersey, New York, North Carolina, Ohio, Oregon, Pennsylvania, Puerto Rico, Rhode Island, South Carolina, Tennessee, Vermont, Virginia, Washington, and Wisconsin during the week ending June 20. Initial claims for UI benefits by former Federal civilian employees totaled 1,628 in the week ending June 27, an increase of 54 from the prior week. There were 2,062 initial claims by newly discharged veterans, a decrease of 33 from the preceding week. There were 17,456 former Federal civilian employees claiming UI benefits for the week ending June 20, an increase of 434 from the previous week. Newly discharged veterans claiming benefits totaled 28,528, an increase of 164 from the prior week. States reported 2,519,101 persons claiming EUC (Emergency Unemployment Compensation) benefits for the week ending June 20, an increase of 81,276 from the prior week. EUC weekly claims include both first and second tier activity. The highest insured unemployment rates in the week ending June 20 were in Michigan (6.8 percent), Puerto Rico (6.8), Oregon (6.7), Pennsylvania (6.4), Nevada (6.2), Wisconsin (5.7), California (5.3), Illinois (5.3), North Carolina (5.3), and South Carolina (5.3). The largest increases in initial claims for the week ending June 27 were in New Jersey (+7,876), Massachusetts (+4,730), Kansas (+4,469), Kentucky (+3,614), and New York (+3,019), while the largest decreases were in Florida (-12,493), Illinois (-5,321), Pennsylvania (-3,949), California (-2,919), and Tennessee (-2,743).

Pre-market - July 9, 2009

Futures up after "not as bad as expected" earning from Alcoa last night: DJIA INDEX 8,163.00 47.00 S&P 500 880.30 6.60 873.70 NASDAQ 100 1,414.00 7.00 Gold 909 -20 -2.13% Oil 61.09 +0.95 +1.58% Today's economic calendar: Chain Store Sales BOE Announcement 7:00 AM ET Elizabeth Duke Speaks 8:00 AM ET Jobless Claims 8:30 AM ET Wholesale Trade 10:00 AM ET EIA Natural Gas Report 10:30 AM ET 3-Month Bill Announcement 11:00 AM ET 6-Month Bill Announcement 11:00 AM ET 30-Yr Bond Auction 1:00 PM ET Gary Stern Speaks 2:30 PM ET Money Supply 4:30 PM ET Today's earnings reports - Before market opens: Today after close:

Wednesday, July 8, 2009

Pre-market - July 8, 2009

Futures about flat this morning, waiting on Alcoa: DJIA INDEX 8,136.00 5.00 S&P 500 880.30 1.00 879.20 NASDAQ 100 1,409.75 1.75 Gold 929 5 0.52% Oil 62.49 -0.45 -0.72% Today's economic calendar: MBA Purchase Applications 7:00 AM ET EIA Petroleum Status Report 10:30 AM ET Charles Evans Speaks 12:55 PM ET 10-Yr Note Auction 1:00 PM ET Consumer Credit 3:00 PM ET Today's earnings reports: Before market opens in BOLD

Tuesday, July 7, 2009

Pre-market - July 7, 2009

Futures up slightly this morning: DJIA INDEX 8,291.00 14.00 S&P 500 897.30 1.80 NASDAQ 100 1,445.00 4.00 Gold 924 -7 -0.77% Oil 64.79 0.70 1.09% Today's economic calendar: ICSC-Goldman Store Sales 7:45 AM ET Redbook 8:55 AM ET 4-Week Bill Auction 11:30 AM ET 3-Yr Note Auction 1:00 PM ET Treasury STRIPS 3:00 PM ET Today's earnings reports: Before market opens in BOLD

Monday, July 6, 2009

Market wrap - 4:15PM

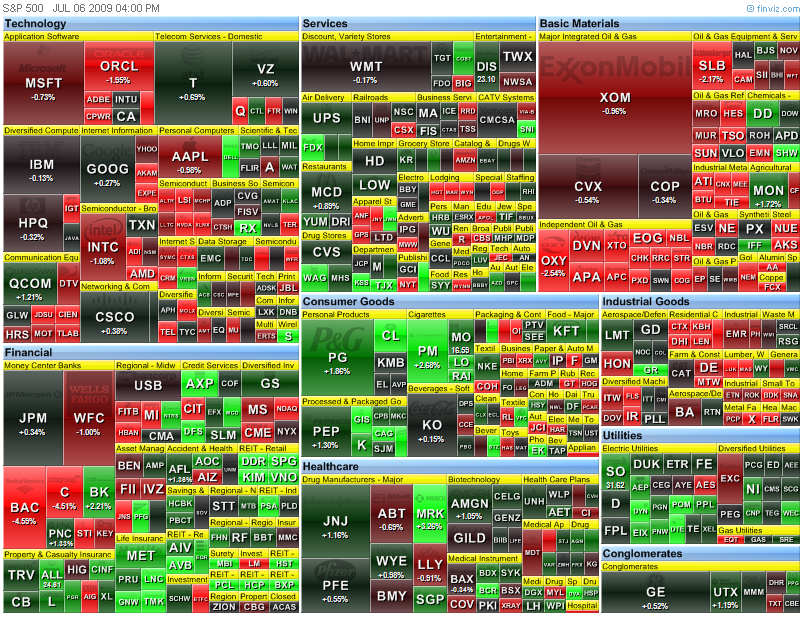
Another boring day in the market. Nothing much except the all to familiar ram job at 3:30. Dow 8,324.87 +44.13 (0.53%) S&P 500 898.72 +2.30 (0.26%) Nasdaq 1,787.40 -9.12 (-0.51%) Gold 924 -7 -0.72% Oil 64.16 -1.58 -2.40% Today by sector: Today's heatmap:
That heatmap doesn't tell the whole story. The REITs were good all day. Why I have no idea. Who would buy this crap is beyond me.

Pre-market - Monday - July 6, 2009

Futures are down this morning: DJIA INDEX 8,165.00 -76.00 S&P 500 884.80 -8.50 NASDAQ 100 1,434.75 -10.50 Gold 931 -10 -1.09% Oil 63.56 -2.06 -3.14% Today's economic calendar: ISM Non-Mfg Index 10:00 AM ET 4-Week Bill Announcement 11:00 AM ET 3-Month Bill Auction 11:30 AM ET 6-Month Bill Auction 11:30 AM ET 10-Yr TIPS Auction 1:00 PM ET Today's earnings calendar: CMED China Medical Technologies Inc. Healthcare VIMC Vimicro International Corp. Technology CMED is before the market opens

Thursday, July 2, 2009

Market wrap - 5:00PM

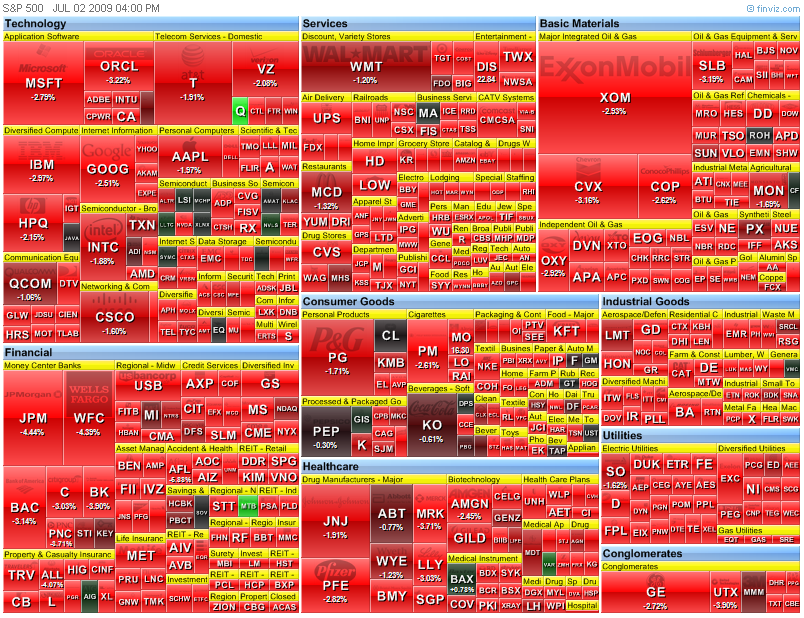
The market hours were extended today by 15 minutes due to some electronic system problems at the NYSE. Closed at 4:15. The job numbers didn't sit too well with traders today as we saw a pretty good sell off. Dow 8,280.74 -223.32 (-2.63%) S&P 500 896.42 -26.91 (-2.91%) Nasdaq 1,796.52 -49.20 (-2.67%) Gold 931 -10 -1.09% Oil 66.31 -2.58 -3.75% Today by sector: Today's heatmap:
Lookie what we have here? I'm not a technician, but that looks like a pretty nice head and shoulders. We have yet to find out of course. Earnings season is right around the corner, and next week we have some bond auctions that might be interesting. The economic news is not very good with a few exceptions. Less bad, not as bad as expected, contracting slower, and green shoots have been the buzzwords. The chart is suggesting a bearish tone. I think we may want to watch that chart. Green shoots might turn into weeds.

Big Pay Packages Return to Wall Street - Update 1:22PM

I'm shocked, shocked I tell you: Big Pay Packages Return to Wall Street - WSJ Business is back on Wall Street. If the good times continue to roll, lofty pay packages may be set for a comeback as well. Based on analysts' earnings forecasts for 2009, Goldman Sachs Group Inc. is on track to pay out as much as $20 billion this year, or about $700,000 per employee. That would be nearly double the firm's $363,000 average last year, and slightly higher than the $661,000 for the average Goldman employee in fiscal 2007, according to analyst estimates reviewed by The Wall Street Journal. Morgan Stanley, the only other huge U.S. securities firm left as an independent company, will likely pay out $11 billion to $14 billion in compensation and benefits this year, analysts predict. On a per-employee basis, payouts are expected to exceed last year's average of $262,000. Howard Chen, an analyst at Credit Suisse, projects that the company's average pay will come close to the $340,000 paid out by Morgan Stanley in fiscal 2007. More at link.

California ready to issue IOUs - 11:36AM

California ready to issue IOUs Full link here The controller's office is set to begin printing the scrip this afternoon, the first time in 17 years. Some 28,742 IOUs worth $53.3 million will be sent, mostly to residents awaiting tax refunds. By Eric Bailey 7:03 AM PDT, July 2, 2009 Reporting from Sacramento — With budget negotiators at a loggerheads and California government facing a cash crisis, the state controller's office will start printing IOUs this afternoon for the first time in 17 years. The presses are set to start at 2 p.m., churning out 28,742 IOUs worth $53.3 million that will be dispatched mostly to residents throughout the state still awaiting their income-tax refunds. A panel of state finance officials will meet this morning to set the interest rate for banks and other financial institutions that decide to accept the IOUs. Some banks have agreed to honor them, including Bank of America, which will do so until July 10. Other banks have not made a decision. The move comes little more than a day after Senate Republicans, with the support of Gov. Arnold Schwarzenegger, blocked an 11th-hour attempt by Democratic leaders to push through a slate of bills that would have staved off the IOUs. With the California economy hobbled, tax receipts waning and the budget deficit continuing to swell, the governor Wednesday declared a fiscal emergency, and ordered state workers to take a third unpaid furlough day each month. He also issued a new list of cuts to schools and public universities to address a deficit that his finance team now says has swelled to $26.3 billion. Schwarzenegger's latest cuts are designed to pare state spending by an additional $4.9 billion.
Green shoots!

MANUFACTURERS' SHIPMENTS, INVENTORIES, AND ORDERS - 10:00AM

For May - full report here Summary New orders for manufactured goods in May, up three of the last four months, increased $4.1 billion or 1.2 percent to $347.9 billion, the U.S. Census Bureau reported today. This followed a 0.5 percent April increase. Excluding transportation, new orders increased 0.8 percent. Shipments, down ten consecutive months, decreased $3.1 billion or 0.9 percent to $353.3 billion. This was the longest streak of consecutive monthly decreases since the series was first published on a NAICS basis in 1992 and followed a 0.5 percent April decrease. Unfilled orders, down eight consecutive months, decreased $1.8 billion or 0.2 percent to $747.3 billion. This was the longest streak of consecutive monthly decreases since November 2001-July 2002. This followed a 1.1 percent April decrease. The unfilled orders-to-shipments ratio was 6.15, up from 6.04 in April. Inventories, down nine consecutive months, decreased $3.2 billion or 0.6 percent to $513.3 billion. This was the longest streak of consecutive monthly decreases since March 2003-January 2004 and followed a 1.2 percent April decrease. The inventories-to-shipments ratio was 1.45, unchanged from April. New Orders New orders for manufactured durable goods in May, up three of the last four months, increased $2.9 billion or 1.8 percent to $163.4 billion, unchanged from the previously published increase. This followed a 1.4 percent April increase. New orders for manufactured nondurable goods increased $1.2 billion or 0.7 percent to $184.5 billion. Shipments Shipments of manufactured durable goods in May, down ten consecutive months, decreased $4.3 billion or 2.5 percent to $168.9 billion, revised from the previously published 2.1 percent decrease. This also was the longest streak of consecutive monthly decreases since the series was first published on a NAICS basis in 1992 and followed a 0.7 percent April decrease. Shipments of manufactured nondurable goods, up following three consecutive monthly decreases, increased $1.2 billion or 0.7 percent to $184.5 billion. This followed a 0.2 percent April decrease. This increase was due to petroleum and coal products, which increased $2.5 billion or 8.3 percent to $32.3 billion. Unfilled Orders Unfilled orders for manufactured durable goods in May, down eight consecutive months, decreased $1.8 billion or 0.2 percent to $747.3 billion, revised from the previously published 0.3 percent decrease. This followed a 1.1 percent April decrease. Inventories Inventories of manufactured durable goods in May, down five consecutive months, decreased $3.3 billion or 1.0 percent to $322.1 billion, revised from the previously published 0.8 percent decrease. This followed a 1.2 percent April decrease. Inventories of manufactured nondurable goods, up following eight consecutive monthly decreases, increased slightly to $191.2 billion. This followed a 1.1 percent April decrease. Petroleum and coal products drove the increase, up $0.7 billion or 3.0 percent to $25.2 billion. By stage of fabrication, May materials and supplies decreased 1.7 percent in durable goods and increased 0.3 percent in nondurable goods. Work in process decreased 0.2 percent in durable goods and increased 0.2 percent in nondurable goods. Finished goods decreased 1.4 percent in durable goods and 0.3 percent in nondurable goods.

Jobs report - 8:31AM

Opps! Did the green shoots get mowed down? Full report here THE EMPLOYMENT SITUATION: JUNE 2009 Nonfarm payroll employment continued to decline in June (-467,000), and the unemployment rate was little changed at 9.5 percent, the Bureau of Labor Statistics of the U.S. Department of Labor reported today. Job losses were widespread across the major industry sectors, with large declines occurring in manufacturing, professional and business services, and construction. Unemployment (Household Survey Data) The number of unemployed persons (14.7 million) and the unemployment rate (9.5 percent) were little changed in June. Since the start of the recession in December 2007, the number of unemployed persons has increased by 7.2 million, and the unemployment rate has risen by 4.6 percentage points. If you got to the site you need to look at the U-6 number: June 09 = 16.8 vs May = 15.9 U6 is Total unemployed, plus all marginally attached workers, plus total employed part time for economic reasons, as a percent of the civilian labor force plus all marginally attached workers.

Pre-market - July 2, 2009

Futures down before the jobs report: DJIA INDEX 8,398.00 -50.00 S&P 500 913.20 -6.00 NASDAQ 100 1,469.75 -9.00 Gold 941 14 1.50% Oil 68.05 -1.41 -2.03% Today's economic calendar: ECB Announcement 7:45 AM ET (interest rate unchanged) Employment Situation 8:30 AM ET Jobless Claims 8:30 AM ET 30-Yr Bond Announcement 9:00 AM ET Factory Orders 10:00 AM ET EIA Natural Gas Report 10:30 AM ET 3-Month Bill Announcement 11:00 AM ET 6-Month Bill Announcement 11:00 AM ET 3-Yr Note Announcement 11:00 AM ET 10-Yr Note Announcement 11:00 AM ET 10-Yr TIPS Announcement 11:00 AM ET Money Supply 4:30 PM ET Today's earnings reports: After market closes in BOLD

Wednesday, July 1, 2009

Construction spending - June - 10:10AM

Full report here For Release at 10:00 A.M. EDT, Wednesday, July 1, 2009 Michael Davis, Linnet Holland, or John Tremblay CB09-100 (301) 763-1605 MAY 2009 CONSTRUCTION AT $964.0 BILLION ANNUAL RATE The U.S. Census Bureau of the Department of Commerce announced today that construction spending during May 2009 was estimated at a seasonally adjusted annual rate of $964.0 billion, 0.9 percent (±1.1%)* below the revised April estimate of $972.5 billion. The May figure is 11.6 percent (±1.6%) below the May 2008 estimate of $1,090.7 billion. During the first 5 months of this year, construction spending amounted to $368.8 billion, 11.7 percent (±1.4%) below the $417.5 billion for the same period in 2008. PRIVATE CONSTRUCTION Spending on private construction was at a seasonally adjusted annual rate of $649.2 billion, 1.0 percent (±1.1%)* below the revised April estimate of $655.6 billion. Residential construction was at a seasonally adjusted annual rate of $240.2 billion in May, 3.4 percent (±1.3%) below the revised April estimate of $248.8 billion. Nonresidential construction was at a seasonally adjusted annual rate of $409.0 billion in May, 0.5 percent (±1.1%)* above the revised April estimate of $406.9 billion. PUBLIC CONSTRUCTION In May, the estimated seasonally adjusted annual rate of public construction spending was $314.9 billion, 0.6 percent (±1.9%)* below the revised April estimate of $316.9 billion. Educational construction was at a seasonally adjusted annual rate of $91.3 billion, 0.5 percent (±2.7%)* above the revised April estimate of $90.8 billion. Highway construction was at a seasonally adjusted annual rate of $78.5 billion, 1.3 percent (±6.6%)* below the revised April estimate of $79.5 billion.

ISM Manufacturing report - 10:10AM

Full report here June 2009 Manufacturing ISM Report On Business® PMI at 44.8% DO NOT CONFUSE THIS NATIONAL REPORT with the various regional purchasing reports released across the country. The national report's information reflects the entire United States, while the regional reports contain primarily regional data from their local vicinities. Also, the information in the regional reports is not used in calculating the results of the national report. The information compiled in this report is for the month of June 2009. Production Growing New Orders, Employment and Inventories Contracting Prices Unchanged Supplier Deliveries Slower (Tempe, Arizona) — Economic activity in the manufacturing sector failed to grow in June for the 17th consecutive month, while the overall economy grew for the second consecutive month following seven months of decline, say the nation's supply executives in the latest Manufacturing ISM Report On Business®. The report was issued today by Norbert J. Ore, CPSM, C.P.M., chair of the Institute for Supply Management™ Manufacturing Business Survey Committee. "Manufacturing continues to contract at a slower rate, but the trends in the indexes are encouraging as seven of 18 industries reported growth in June. Most encouraging is the gain in the Production Index, which is up 12.1 percentage points in the last two months to 52.5 percent. Aggressive inventory reduction continues and indications are that the de-stocking cycle is at or near the end in most industries, as the Customers' Inventories Index remained below 50 percent for the third consecutive month. The Prices Index was unchanged from May, indicating that the supply/demand balance is improving. Overall, a slow recovery for manufacturing is forming based on the current trends in the ISM data." PERFORMANCE BY INDUSTRY Seven of the 18 manufacturing industries reported growth in June. These industries — listed in order — are: Petroleum & Coal Products; Printing & Related Support Activities; Wood Products; Nonmetallic Mineral Products; Miscellaneous Manufacturing; Chemical Products; and Primary Metals. The industries reporting contraction in June — listed in order — are: Apparel, Leather & Allied Products; Furniture & Related Products; Machinery; Computer & Electronic Products; Electrical Equipment, Appliances & Components; Plastics & Rubber Products; Textile Mills; Transportation Equipment; Food, Beverage & Tobacco Products; and Fabricated Metal Products. WHAT RESPONDENTS ARE SAYING ... * "Customer inventory burn is complete and real demand has reappeared." (Machinery) * "... a lot of people are requoting old business and using favorable pricing to negotiate with their current suppliers." (Computer & Electronic Products) * "Banks are reluctant to lend to businesses, and until this changes the economy will continue to be weak." (Fabricated Metal Products) * "Slow June, but firm large orders in July, August and September." (Food, Beverage & Tobacco Products) * "Market appears to have bottomed out as aftermarket has picked up slightly over the past month." (Transportation Equipment)

ADP job report - 8:15AM

Not so good it seems: Full link here ROSELAND, N.J. – July 1, 2009 – According to today’s ADP National Employment Report®, private sector employment decreased by 473,000 in June. The ADP National Employment Report, created by ADP® Employer Services, a division of Automatic Data Processing, Inc. (ADP), in partnership with Macroeconomic Advisers, LLC, is derived from actual payroll data and measures the change in total nonfarm private employment each month. Nonfarm Private Employment Highlights – June Report: • Total employment: -473,000 • Small businesses* -177,000 • Medium businesses** -205,000 • Large businesses*** -91,000 • Goods-producing sector: -250,000 • Service-providing sector: -223,000 Addendum: • Manufacturing industry: -146,000 * Small businesses represent payrolls with 1-49 employees ** Medium businesses represent payrolls with 50-499 employees *** Large businesses represent payrolls with more than 499 employees

Pre-market - July 1, 2009

Futures up slightly this morning before some important numbers come out later: DJIA INDEX 8,433.00 39.00 S&P 500 920.70 5.20 NASDAQ 100 1,485.25 9.00 Gold 927 -13 -1.41% Oil 71.11 +1.21 +1.73% Economic calendar for today: Monster Employment Index Motor Vehicle Sales[djStar] MBA Purchase Applications 7:00 AM ET Challenger Job-Cut Report 7:30 AM ET ADP Employment Report 8:15 AM ET ISM Mfg Index 10:00 AM ET Construction Spending 10:00 AM ET Pending Home Sales Index 10:00 AM ET EIA Petroleum Status Report 10:30 AM ET Today's earnings reports: After market closed in BOLD

Tuesday, June 30, 2009

Market wrap - 4:15PM

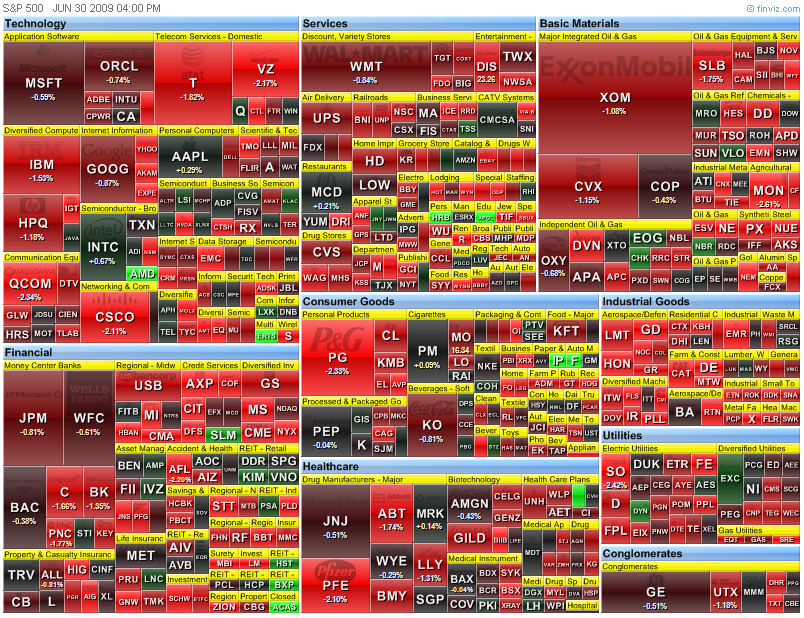
Another slow day in the market. Volume down, little price action except for a few. Thee market was up a little after open, until the 10:00 Consumer Sentiment was released. Number went the wrong way and the market quickly sold off to a low of 912.86, from a high of 930.01 at 9:45 on the S&P. The large sell off came at 10:00 reports. The market hit the lows at 11:38. The market then traded lightly in a very gradual climb to the close. Dow 8,447.53 -81.85 (-0.96%) S&P 500 919.32 -7.91 (-0.85%) Nasdaq 1,835.04 -9.02 (-0.49%) Gold 927 -13 -1.41% Oil 70.08 -1.60 -2.23% Today by sector: Today's heatmap: Economic calendar for tomorrow: Monster Employment Index Motor Vehicle Sales[djStar] MBA Purchase Applications 7:00 AM ET Challenger Job-Cut Report 7:30 AM ET ADP Employment Report 8:15 AM ET ISM Mfg Index 10:00 AM ET Construction Spending 10:00 AM ET Pending Home Sales Index 10:00 AM ET EIA Petroleum Status Report 10:30 AM ET Tomorrows earnings reports - After market close in BOLD

U.S. housing misery poised to enter new phase - Reuters - 1:45PM

Link to article here. U.S. housing misery poised to enter new phase U.S. housing misery poised to enter new phase Fri Jun 26, 2009 1:25pm EDT By Herbert Lash - Analysis NEW YORK (Reuters) - Signs that home prices may have bottomed have stirred hope on Wall Street that the economy is on the mend, yet tight credit and a new foreclosure wave cast doubt on any looming housing revival. Sales of previously owned U.S. homes rose for a second straight month in May, realty data on Tuesday showed, while the U.S. government and Federal Reserve have designed a number of programs to alleviate a battered housing market. However, the chief economist of the National Association of Realtors warned of the danger of a "delayed" recovery in housing, with prices down 32 percent nationwide from their peak three years ago. Big risk factors that could spur more foreclosures include expectations of rising unemployment and the forecast resetting of interest rates on 2.8 million subprime and Alt-A mortgages in the next two years. Delinquency rates on mortgage payments typically rise in tandem with unemployment, which is expected to top 10 percent after hitting a 25-year high of 9.4 percent in May. And when mortgages interest rates reset, they are typically at higher rates that can cause monthly payments to balloon. "I'm worried that the investment community is a little too sanguine about how much of the housing pain is behind us and that we might be in the all-clear," said Ronald Temple, co-director of research at Lazard Asset Management in New York. Against this backdrop comes continuing tightness in housing credit. According to Amherst Securities Group LP, a severe lack of credit outside of government-sponsored mortgages has reduced loans, especially for the purchase of new homes, and is putting further downward pressure on prices. Authorities are aware of the hurdles housing poses to economic recovery. The U.S. government is trying to stabilize housing by offering incentives for lenders to favorably modify the terms of delinquent mortgages. And the Federal Reserve has pledged to buy as much as $1.25 trillion in mortgage-backed securities to free up funding for new home loans. FORECLOSURES HITTING THE MORE CREDIT-WORTHY One in eight U.S. households at the end of March had entered foreclosure or was delinquent on payments, the Mortgage Bankers Association (MBA) said last month. The number of homes in foreclosure in the first quarter jumped to a record 3.85 percent of outstanding U.S. mortgages, MBA said. The bulk of recent foreclosures was on prime, fixed-rate loans, extended to the most credit-worthy borrowers and the bedrock of home ownership in America. The first wave of foreclosures had been mostly on subprime loans offered to the riskiest borrowers. The foreclosure rate is getting worse and will likely rise to about 4.5 percent, said Patrick Newport, an economist at IHS in Lexington, Massachusetts who closely follows housing. "What's driving people to leave their homes is a combination of having their house under water and then losing their job," Newport said. "Under water," or negative equity, refers to when the market value of a home is less than the mortgage. "We're in this vicious cycle and there are no signs that we're getting out of it," Newport said. Another wave of defaults, this one associated with Alt-A loans, is building. While Alt-A borrowers in general were more credit-worthy, they included self-documented income histories, which may be problematic, and loans that need to be recast or redone, said Mark Fleming, chief economist at First American CoreLogic. About 812,000 adjustable-rate mortgages, or 11 percent, have already had their interest rates reset, according to Loan Performance, a unit of First American CoreLogic Inc, a leading provider of real estate and property information. Compounding the problem for loans facing rate resets is that the potential for negative equity has increased as home prices have fallen more. "These homeowners are having this issue of resets in an environment where the economic stress is higher, and the cumulative effect of house price declines is higher," Fleming said. LIMITED CREDIT SQUEEZING HOUSING MARKET In addition, while analysts and the press have focused on foreclosures and unemployment, the lack of mortgage credit has "received significantly less attention than it deserves" and instead of being addressed, continues to deteriorate, according to Amherst. Government-sponsored lending, known as agency debt, soared to account for more than 98 percent of U.S. residential loans in the first quarter. That is a dramatic surge from 2005 and 2006 -- the height of the housing boom -- when it was less than 50 percent, according to data that Amherst compiled from Inside MBS & ABS, Loan Performance and its own information. Mortgage debt held in bank portfolios has dropped, while issuance of subprime and Alt-A loans, the latter accounting for $1 trillion in mortgage issuance in both 2005 and 2006, has plunged. Only $64 billion was issued in that space last year. While agency activity has picked up considerably, most of that has been for refinancing existing loans, leaving very little credit for new home loans, Amherst said. New lending has been minimal and one reason for declining home prices is that mortgage credit is very tight, Amherst said. And declining prices could spell more trouble in the future. The average U.S. household at the end of March held only 8 percent equity in their home, Temple said. A 20 percent slide in home prices could lead in two years to more than 30 million people who owe more than their homes are worth, he said.
Consumer confidence report - 10:45AM

Full report here. Consumer Confidence Survey™ Press Release Please visit the Consumer Research Center pages to learn more about: * detailed consumer confidence data * additional consumer information * benefits of center membership THESE DATA ARE FOR ANALYSIS PURPOSES ONLY. NOT FOR REDISTRIBUTION, PUBLISHING, DATABASING, OR PUBLIC POSTING WITHOUT EXPRESS WRITTEN PERMISSION. The Conference Board Consumer Confidence Index™ Retreats June 30, 2009 The Conference Board Consumer Confidence Index™, which had improved considerably in May, retreated in June. The Index now stands at 49.3 (1985=100), down from 54.8 in May. The Present Situation Index decreased to 24.8 from 29.7. The Expectations Index declined to 65.5 from 71.5 in May. The Consumer Confidence SurveyTM is based on a representative sample of 5,000 U.S. households. The monthly survey is conducted for The Conference Board by TNS. TNS is the world’s largest custom research company. The cutoff date for June’s preliminary results was June 23rd. Says Lynn Franco, Director of The Conference Board Consumer Research Center: "After back-to-back months of strong gains, Consumer Confidence retreated in June. The decline in the Present Situation Index, caused by a less favorable assessment of business conditions and employment, continues to imply that economic conditions, while not as weak as earlier this year, are nonetheless weak. Looking ahead, Expectations continue to suggest less negative conditions in the months ahead, as opposed to strong growth." Consumers' appraisal of present-day conditions was less favorable in June. Those claiming business conditions are "good" decreased to 8.0 percent from 8.8 percent, while those saying conditions are "bad" increased to 45.6 percent from 44.5 percent. Consumers’ assessment of the labor market was also less favorable. Those stating jobs are "hard to get" increased to 44.8 percent from 43.9 percent. Those saying jobs are "plentiful" decreased to 4.5 percent from 5.8 percent. Consumers' short-term outlook also waned in June. Consumers anticipating an improvement in business conditions over the next six months decreased to 21.2 percent from 22.5 percent, while those expecting conditions will worsen increased to 20.2 percent from 18.0 percent in May. The job outlook was also more pessimistic. Those anticipating more jobs in the months ahead decreased to 17.4 percent from 19.3 percent, while those anticipating fewer jobs increased to 27.3 percent from 25.6 percent. The proportion of consumers expecting an increase in their incomes declined to 9.8 percent from 10.8 percent. The next release is scheduled for Tuesday, July 28, at 10:00 AM ET. For further information contact: Lynn Franco at +1 212 339 0344 lynn.franco@conference-board.org
There is nothing in this report that is good. The last time it was released, the market shot up like a rocket because it spiked (bump is more like it)up a little. The clowns (clowns is being nice) on CNBC hailed it all day as "GREEN SHOOTS". Today, the worse of the worse, Larry "I can scream louder than you" Kudlow, an admitted permabull, said "ehh" no big deal. It sure was the last time you damn liar. Kudlow is beyond watchable, and CNBC is getting there fast. What a bunch of assclowns.

Chicago PMI - 11:42AM

Full report here. Chicago PMI Better than Expected Last Update: 30-Jun-09 10:08 ET According to the Institute of Supply Management-Chicago and Kingsbury International, Ltd., the Chicago Purchasing Managers Index increased to 39.9 in June from 34.9 in May. That was better than the consensus estimate of 39.0 and above the six-month average of 35.6. A reading below 50 still connotes a contraction in manufacturing activity in this region, although the uptick from May implies the rate of contraction has slowed. The June number improved month-to-month, aided by an uptick in new orders, which jumped to 41.6 from 37.3. In fact, increases were seen in every component index, although some increases didn't necessarily imply encouraging things. For instance, the inventories index went up to 34.2 from 31.5 and prices paid increased to 36.3 from 29.8. Separately, production improved to 39.3 from 38.1, order backlogs increased to 37.6 from 26.3, and employment edged up to 28.9 from 25.0. This survey was better than expected, but one needs to be careful not to extrapolate too much encouragement from it just yet knowing that it follows on the heels of a very problematic period for the auto industry, which is closely linked to the Chicago region. In other words, it could simply mark a temporary bounce from a very depressed situation.
Pre-market - June 30, 2009

Futures up a little before things get underway today: DJIA INDEX 8,469.00 11.00 S&P 500 922.80 1.60 NASDAQ 100 1,483.00 1.50 Gold 941 0 -0.03% Oil 71.41 -0.11 -0.15% Today's economic calendar: ICSC-Goldman Store Sales 7:45 AM ET Redbook 8:55 AM ET Chicago PMI 9:45 AM ET Consumer Confidence 10:00 AM ET State Street Investor Confidence Index 10:00 AM ET Jim Bullard Speaks 12:00 PM ET 4-Week Bill Auction 1:00 PM ET 52-Week Bill Auction 1:00 PM ET Today's earnings reports: Before market opens in BOLD

Monday, June 29, 2009

Market wrap - 4:10PM

Well, there you have it. Another day watching the paint dry. Awful market, no volume (other than the 10 o'clock jam job). Dow 8,529.76 +91.37 (1.08%) S&P 500 927.12 +8.22 (0.89%) Nasdaq 1,844.06 +5.84 (0.32%) Gold 941 0 -0.03% Oil 71.49 2.33 3.37% Today by sector: Funny, nothing up big, but all sectors up. 91 points on the DOW worth.

Madoff sentanced to 150 years - Update11:35AM

More details when I can get them. The news just broke. Update 11:40AM - From MarketWatch Madoff faces life in prison at sentencing NEW YORK (MarketWatch) -- Bernard Madoff on Monday will learn his fate for stealing at least $13 billion from thousands of unwitting victims, and regardless of the sentence, it's likely that the 71-year-old admitted swindler will end up in jail for the rest of his life. Madoff, who bilked clients over several decades in what's been called the biggest Ponzi scheme in history, could be sentenced to a maximum of 150 years in a Manhattan courthouse at 10 a.m. Eastern. His lawyers, however, have reportedly sought a sentence of just 12 years, arguing that Madoff is expected to live only another 13 years. In March, Madoff pleaded guilty to 11 felony charges, including securities fraud, money laundering and theft from an employee-benefit plan. His clients have reportedly lost more than $13 billion. See archived story. Madoff's scam, which he admitted to his sons last December, came undone as too many clients sought to withdraw money at the same time in the aftermath of the September 2008 financial meltdown. As the credit crisis hit hard and falling markets sparked exploding demand for cash, investors sought to tap the funds they had with Madoff to meet other commitments and raise cash. But, as Madoff recounted it to his sons, he had been using new investors' money to fund earlier investors' returns, and when too many clients sought to withdraw money, the game was up. It was the classic unraveling of the Ponzi scheme, named for one of the scam's most successful perpetrators, Charles Ponzi, who ran it in the early 20th century. While thousands lost money with Madoff, some of his clients were higher-profile than others, ranged across occupations from entertainers to executives, and included several charities and foundations -- several of which were completely wiped out. See interactive list of Madoff's victims. His victims included Fred Wilpon, an owner of the New York Mets baseball team, as well as Norman Braman, the former owner of football's Philadelphia Eagles, and the Elie Wiesel Foundation for Humanity. Madoff's sentencing comes just days after his wife agreed to relinquish her claim to more than $80 million of assets, according to a Wall Street Journal report. Ruth Madoff gave up millions of dollars in cash and securities, as well as her $7.5 million interest in a New York City apartment and a $7 million Montauk, N.Y., property, the Journal reported. She will retain $2.5 million. See full story at WSJ.com. The court-appointed trustee has so far recovered just $1.2 billion of the losses that investors suffered. Most of what the trustee is expected to recover from now on will come from any "clawback" suits against investors who had withdrawn money from their accounts with Madoff in recent years, the Journal reported. See full story at WSJ.com.

Someone finally admits it - and more surprising - CNBC let them say it - 9:55AM

Watch this video, and pay special attention to the guy in the red shirt:


This guy said some things I thought would never see the light of television, little lone the cheerleaders from CNBC. Incredible!

Pre-market - June 29, 2009

Futures up slightly this morning: DJIA INDEX 8,394.00 21.00 S&P 500 916.50 2.60 NASDAQ 100 1,481.75 5.00 Gold 941 2 0.16% Oil 69.94 +0.83 +1.20% Today's economic calendar: 4-Week Bill Announcement 11:00 AM ET 3-Month Bill Auction 1:00 PM ET 6-Month Bill Auction 1:00 PM ET Farm Prices 3:00 PM ET Today's earnings reports: Before market opens in BOLD