Friday, June 19, 2009

Market wrap - 4:10PM

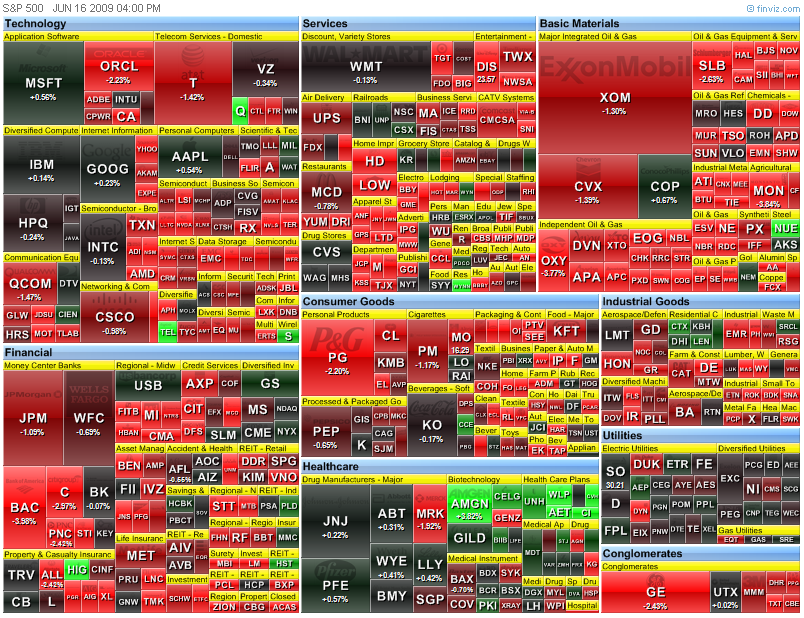
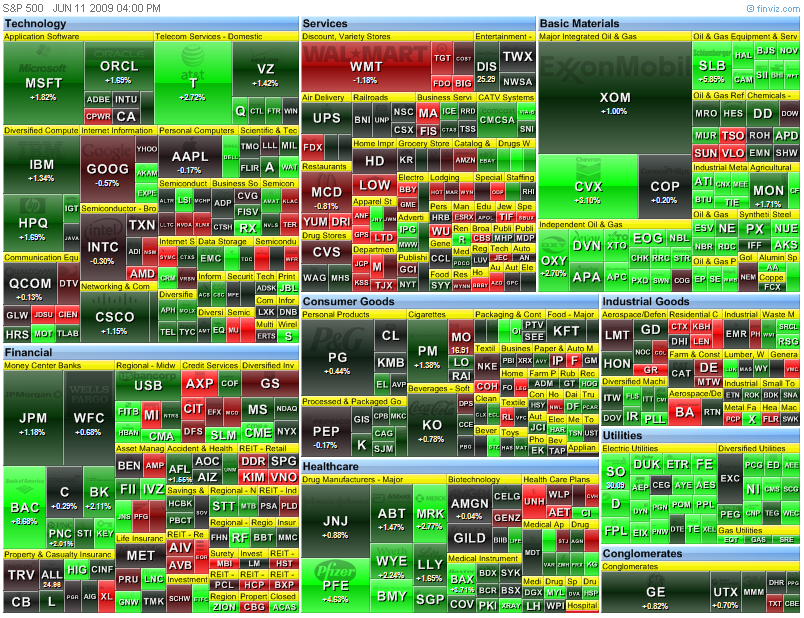
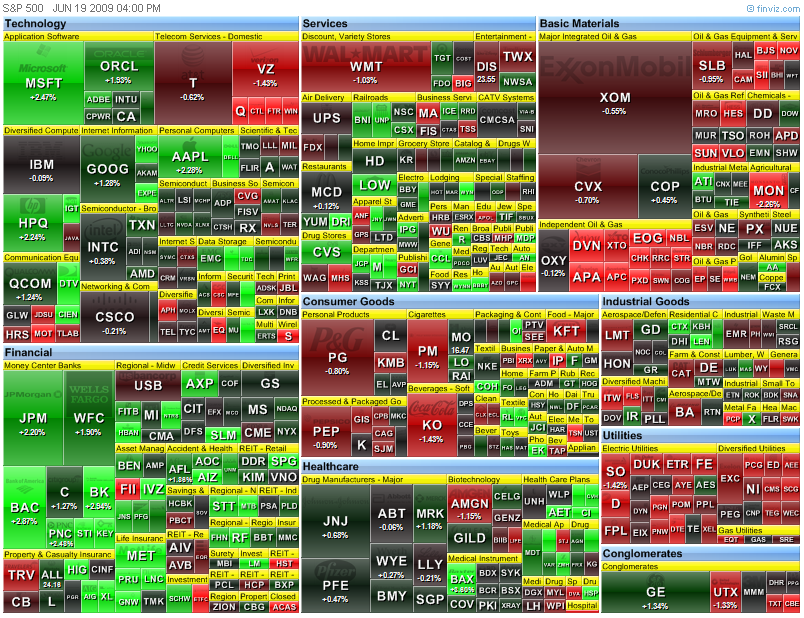
Pretty uneventful day again - no volume to speak of - other than the all to familiar 3:30 jam job to the upside. Dow 8,538.75 -16.85 (-0.20%) S&P 500 921.17 +2.80 (0.30%) Nasdaq 1,827.47 +19.75 (1.09%) Gold 936 +2 +0.17% Oil 69.55 -1.82 -2.55% Today by sector: The financials win again - shocked I tell ya! Today's heatmap:
Larry Kudlow vs. Diana Olick - 12:26PM

What an ass! I can't put it any better than that; From today's "The Call" show on CNBC. Larry, as usual, know more than anyone in the entire freaking world about housing, as well as anything else. Diana Olick has covered the housing mess since it became an issue. Diana is one of the FEW CNBC reports who tell it like it is, rather we want to hear it or not. Props to Diana for that. Larry Kudlow is a permabull who has no problem lying to you about anything and everything as long as it drives the price of stock up. He hates anything non-conservative, and enjoys every chance he has to bash the current administration. Not that they don't deserve it, but he does this all the while cheerleading the market up each and every day. If it wasn't for this administration and the obscene spending, the market would be at 600. So while he doesn't mind playing head cheerleader for the market, out the other side of his mouth bashes everything Democrat. There is only a few words for that 1)liar 2)hypocrite. Oh, one more 3)pompous ass. Screw you Kudlow - do us all a favor and retire.

Pre-market - Friday, June 19, 2009

Futures pointing higher today: DJIA INDEX 8,540.00 47.00 S&P 500 919.10 5.90 NASDAQ 100 1,459.75 10.25 Gold 935 -1 -0.15% Oil 72.06 0.72 1.01% Today's economic calendar: Quadruple Witching Today's earnings report: FMCN Focus Media Holding KMX Carmax NOBH Nobility Homes KMX is before market opens

Thursday, June 18, 2009

Market wrap - 4:15PM

Another pretty boring day in the market. Dow 8,555.60 +58.42 (0.69%) S&P 500 918.37 +7.66 (0.84%) Nasdaq 1,807.72 -0.34 (-0.02%) Gold 935 -1 -0.15% Oil 71.23 0.34 0.48% Today's moves by sector: Today's heatmap:
Research in Motion just reported earnings. I don't have all the details as of yet, but the apparently missed estimates. They are down almost 5% as I post this.

Jobless claims - 8:40AM

Full report here UNEMPLOYMENT INSURANCE WEEKLY CLAIMS REPORT SEASONALLY ADJUSTED DATA In the week ending June 13, the advance figure for seasonally adjusted initial claims was 608,000, an increase of 3,000 from the previous week's revised figure of 605,000. The 4-week moving average was 615,750, a decrease of 7,000 from the previous week's revised average of 622,750. The advance seasonally adjusted insured unemployment rate was 5.0 percent for the week ending June 6, a decrease of 0.1 percentage point from the prior week's unrevised rate of 5.1 percent. The advance number for seasonally adjusted insured unemployment during the week ending June 6 was 6,687,000, a decrease of 148,000 from the preceding week's revised level of 6,835,000. The 4-week moving average was 6,757,500, an increase of 2,250 from the preceding week's revised average of 6,755,250. The fiscal year-to-date average for seasonally adjusted insured unemployment for all programs is 5.286 million.

Pre-market - Thursday, June 18, 2009

Futures up a little before the reports today: DJIA INDEX 8,448.00 11.00 S&P 500 906.60 1.30 NASDAQ 100 1,452.00 -1.50 Gold 936 4 0.41% Oil 70.56 -0.48 -0.68% Earnings calendar for today: Jobless Claims 8:30 AM ET Tim Geithner Speaks 9:30 AM ET Leading Indicators 10:00 AM ET Philadelphia Fed Survey 10:00 AM ET EIA Natural Gas Report 10:30 AM ET 3-Month Bill Announcement 11:00 AM ET 6-Month Bill Announcement 11:00 AM ET 2-Yr Note Announcement 11:00 AM ET 5-Yr Note Announcement 11:00 AM ET 7-Yr Note Announcement 11:00 AM ET Money Supply 4:30 PM ET Earnings reports today: Reports after close in BOLD

Wednesday, June 17, 2009

Crude oil report - 10:45AM

Oil extends losses as gasoline stocks rise NEW YORK (MarketWatch) -- Oil futures accelerated their decline on Wednesday after the Energy Information Administration reported a bigger-than-expected drop in crude supplies and a much larger-than-expected rise in gasoline stocks. Oil for July delivery was last down $1.32, or 2%, to $69.10 a barrel in electronic trading on Globex. Before the data, the contract was down 85 cents. The EIA reported Wednesday that crude supplies decreased by 3.9 million barrels during the week ended June 12 to stand at 357.7 million barrels. Analysts expected a decline of 1.7 million barrels in crude stockpiles, according to a Platts survey of analysts. The EIA also reported that gasoline inventories rose by 3.4 million barrels last week, while analysts polled by Platts had expected a rise of only 650,000 barrels. The EIA also said that distillate inventories rose by 0.3 million barrels last week.

Pre-market - Wednesday, June 17, 2009

Futures down a little after the FEDEX earnings report: DJIA INDEX 8,434.00 -25.00 S&P 500 905.20 -2.60 NASDAQ 100 1,445.75 1.50 Gold 932 5 0.51% Oil 69.66 -0.73 -1.04% Today's economic calendar: MBA Purchase Applications 7:00 AM ET Consumer Price Index 8:30 AM ET Current Account 8:30 AM ET Ben Bernanke Speaks 9:00 AM ET EIA Petroleum Status Report 10:30 AM ET Today's earning report: Before market opens in BOLD

Tuesday, June 16, 2009

Market wrap - 4:10PM

Wow! Did I just see what I thought I saw? TWO days down in a row???? CNBC is going to have the big one. How are they going to spin this? Not to worry, they will. Dow 8,504.67 -107.46 (-1.25%) S&P 500 911.97 -11.75 (-1.27%) Nasdaq 1,796.18 -20.20 (-1.11%) Gold 932 +5 +0.51% Oil 70.60 -0.15 -0.21% Today's leaders: Today's heatmap:
Second day in a row the market was down. It sold off early, but came back in the afternoon, only to sell of at the end. As much as the CNBC cheerleaders tried to spin up the housing starts, when you drilled down into them, the were not all that impressive. The manufacturing number was on target, but still bad. Seven straight months of a decline in manufacturing. Many have expected a pullback. Even CNBC has spoke of it. What we need to watch now is where it goes from here. The volume is light, which is a bullish sign, even when the market falls. Technical resistance is a factor, as well as Quadruple Witching on Friday. Add in the reports, calendar events, and news, by the end of the week I think we can get a better read on where the market is headed. Happy trading.

Pre-market - Tuesday, June 16, 2009

Futures flat this morning before the data: DJIA INDEX 8,584.00 +20.00 S&P 500 921.80 +2.40 919.80 NASDAQ 100 1,463.00 +5.75 Gold 928 -13 -1.40% Oil 72.01 1.33 1.88% Today's economic calendar: ICSC-Goldman Store Sales 7:45 AM ET Housing Starts 8:30 AM ET Producer Price Index 8:30 AM ET Redbook 8:55 AM ET Industrial Production 9:15 AM ET 4-Week Bill Auction 1:00 PM ET Todays's earnings reports:

Monday, June 15, 2009

Market wrap - 4:10PM

Finally, a day down. Moreover, not a jam job in the last half hour. Dow 8,596.11 -203.15 (-2.31%) S&P 500 923.92 -22.29 (-2.36%) Nasdaq 1,816.38 -42.42 (-2.28%) Gold 928 -13 -1.40% Oil 70.55 -1.42 -1.97% Today by sector: Today's heatmap:
Volume low today so not a distribution day. At the same time, there is really nothing to send it higher. Their is little to no good news. Unless of course, you listen to the goofballs on CNBC. They are still awful.

Pre-market - Monday June, 15, 2009

Futures down a bit this morning: DJIA INDEX 8,645.00 -93.00 S&P 500 930.00 -10.70 NASDAQ 100 1,471.25 -14.25 Gold 941 -21 -2.21% Oil 70.92 -1.10 -1.53% Today's economic reports: Empire State Mfg Survey 8:30 AM ET Treasury International Capital 9:00 AM ET 4-Week Bill Announcement 11:00 AM ET Housing Market Index 1:00 PM ET 3-Month Bill Auction 1:00 PM ET 6-Month Bill Auction 1:00 PM ET Today's earings reports: Company in bold is before market opens.

Friday, June 12, 2009

Pre-market - Friday, June 12,2009

Futures down slightly this morning: DJIA INDEX 8,675.00 -24.00 S&P 500 935.00 -3.20 938.20 NASDAQ 100 1,487.00 -4.00 Gold 962 +7 0.76% Oil 71.34 -1.38 -1.90% Economic calendar today: Import and Export Prices 8:30 AM ET Consumer Sentiment 9:55 AM ET Earnings reports today: DUCK Duckwall-ALCO Stores Inc. - Services MSB Mesabi Trust - Financial

Thursday, June 11, 2009

Market wrap - 4:10PM

Dow 8,801.45 +62.43 (0.71%) S&P 500 944.56 +5.41 (0.58%) Nasdaq 1,862.37 +9.29 (0.50%) Gold 962 +7 +0.77% Oil 72.58 +1.35 1.90% Today's leaders by sector: Today's heatmap:

Retail sales - Update 8:45AM

Full report here. ADVANCE MONTHLY SALES FOR RETAIL TRADE AND FOOD SERVICES MAY 2009 The U.S. Census Bureau announced today that advance estimates of U.S. retail and food services sales for May, adjusted for seasonal variation and holiday and trading-day differences, but not for price changes, were $340.0 billion, an increase of 0.5 percent (±0.5%)* from the previous month, but 9.6 percent (±0.7%) below May 2008. Total sales for the March through May 2009 period were down 9.7 percent (±0.5%) from the same period a year ago. The March to April 2009 percent change was revised from -0.4 percent (±0.5%)* to -0.2 percent (±0.2%)*. Retail trade sales were up 0.5 percent (±0.7%)* from April 2009, but 10.8 percent (±0.7%) below last year. Gasoline stations sales were down 33.8 percent (±1.5%) from May 2008 and motor vehicle and parts dealers sales were down 19.6 percent (±2.3%) from last year. The advance estimates are based on a subsample of the Census Bureau's full retail and food services sample. A stratified random sampling method is used to select approximately 5,000 retail and food services firms whose sales are then weighted and benchmarked to represent the complete universe of over three million retail and food services firms. Responding firms account for approximately 65% of the MARTS dollar volume estimate. For an explanation of the measures of sampling variability included in this report, please see the Reliability of Estimates section on the last page of this publication.

Jobless claims - Update 8:40AM

Full report here. UNEMPLOYMENT INSURANCE WEEKLY CLAIMS REPORT SEASONALLY ADJUSTED DATA In the week ending June 6, the advance figure for seasonally adjusted initial claims was 601,000, a decrease of 24,000 from the previous week's revised figure of 625,000. The 4-week moving average was 621,750, a decrease of 10,500 from the previous week's revised average of 632,250. The advance seasonally adjusted insured unemployment rate was 5.1 percent for the week ending May 30, unchanged from the prior week's revised rate of 5.1 percent. The advance number for seasonally adjusted insured unemployment during the week ending May 30 was 6,816,000, an increase of 59,000 from the preceding week's revised level of 6,757,000. The 4-week moving average was 6,750,500, an increase of 57,250 from the preceding week's revised average of 6,693,250. The fiscal year-to-date average for seasonally adjusted insured unemployment for all programs is 5.238 million.

Pre-market, Thursday, June 11,2009

Futures up a little this morning DJIA INDEX 8,768.00 +14.00 S&P 500 942.50 +2.00 NASDAQ 100 1,499.25 +3.50 Gold 955 0 0.00% Oil 72.02 +0.69 +0.97% Economic indicators for Thursday: Retail Sales 8:30 AM ET Jobless Claims 8:30 AM ET RBC CASH Index 9:00 AM ET Business Inventories 10:00 AM ET EIA Natural Gas Report 10:30 AM ET 3-Month Bill Announcement 11:00 AM ET 6-Month Bill Announcement 11:00 AM ET 30-Yr Bond Auction 1:00 PM ET Earnings reports for today (before open): Today after close:

Wednesday, June 10, 2009

Beige Book report from the FED - Update 2:10PM

Full report here. Summary Prepared at the Federal Reserve Bank of Cleveland based on information collected on or before June 1, 2009. This document summarizes comments received from business and other contacts outside the Federal Reserve and is not a commentary on the views of Federal Reserve officials. Reports from the twelve Federal Reserve District Banks indicate that economic conditions remained weak or deteriorated further during the period from mid-April through May. However, five of the Districts noted that the downward trend is showing signs of moderating. Further, contacts from several Districts said that their expectations have improved, though they do not see a substantial increase in economic activity through the end of the year. Manufacturing activity declined or remained at a low level across most Districts. However, several Districts also reported that the outlook by manufacturers has improved somewhat. Demand for nonfinancial services contracted across Districts reporting on this segment. Retail spending remained soft as consumers focused on purchasing less expensive necessities and shied away from buying luxury goods. New car purchases remained depressed, with several Districts indicating that tight credit conditions were hampering auto sales. Travel and tourism activity also declined. A number of Districts reported an uptick in home sales, and many said that new home construction appeared to have stabilized at very low levels. Vacancy rates for commercial properties were rising in many parts of the country, while developers are finding financing for new commercial projects increasingly difficult to obtain. Most Districts reported that overall lending activity was stable or weak, but with mixed results across loan categories. Credit conditions remained stringent or tightened further. Energy activity continued to weaken across most Districts, and demand for natural resources remained depressed. Planting and growing conditions varied across Districts as did agricultural input costs. Labor market conditions continued to be weak across the country, with wages generally remaining flat or falling. Two Districts also mentioned employers' plans to scale back employee benefit programs. The Atlanta, Chicago, and St. Louis Districts reported that some state and local governments faced hiring freezes or outright job cuts. While manufacturing employment levels remained low, some Districts saw signs that job losses may be moderating. With few exceptions, Districts reported that prices at all stages of production were generally flat or falling. The notable exception to the downward pressure on prices was the widely-reported increase in oil prices.

Crude oil report - 10:30AM

Crude inventories fall 4.4 million barrels: EIA Gasoline inventories fall 1.6 million barrels: EIA Distillate inventories fall 300,000 barrels I'll post the link to the report when it becomes available.

Purchase Applications Remain Steady, Refinance Applications Continue to Fall in Latest MBA Weekly Survey - Update 9:50

Purchase Applications Remain Steady, Refinance Applications Continue to Fall in Latest MBA Weekly Survey - Full link here WASHINGTON, D.C. (June 10, 2009) — The Mortgage Bankers Association (MBA) today released its Weekly Mortgage Applications Survey for the week ending June 5, 2009. The Market Composite Index, a measure of mortgage loan application volume, was 611.0, a decrease of 7.2 percent on a seasonally adjusted basis from 658.7 one week earlier. On an unadjusted basis, the Index increased 15.7 percent compared with the previous week and increased 7.6 percent compared with the same week one year earlier. The Refinance Index decreased 11.8 percent to 2605.7 from 2953.6 the previous week and the seasonally adjusted Purchase Index increased 1.1 percent to 270.7 from 267.7 one week earlier. The four week moving average for the seasonally adjusted Market Index is down 8.7 percent. The four week moving average is up 0.5 percent for the Purchase Index, while this average is down 12.2 percent for the Refinance Index. The refinance share of mortgage activity decreased to 59.4 percent of total applications from 62.4 percent the previous week. This is the lowest the refinance share has been since November 2008. The adjustable-rate mortgage (ARM) share of activity increased to 3.4 percent from 3.0 percent of total applications from the previous week. The average contract interest rate for 30-year fixed-rate mortgages increased to 5.57 percent from 5.25 percent, with points increasing to 1.09 from 1.02 (including the origination fee) for 80 percent loan-to-value (LTV) ratio loans. The average contract interest rate for 15-year fixed-rate mortgages increased to 5.10 percent from 4.80 percent, with points decreasing to 1.04 from 1.10 (including the origination fee) for 80 percent LTV loans. The average contract interest rate for one-year ARMs increased to 6.75 percent from 6.61 percent, with points decreasing to 0.10 from 0.15 (including the origination fee) for 80 percent LTV loans. **SPECIAL NOTES** The survey covers more than 50 percent of all U.S. retail residential mortgage applications, and has been conducted weekly since 1990. Respondents include mortgage bankers, commercial banks and thrifts. Base period and value for all indexes is March 16, 1990=100.